
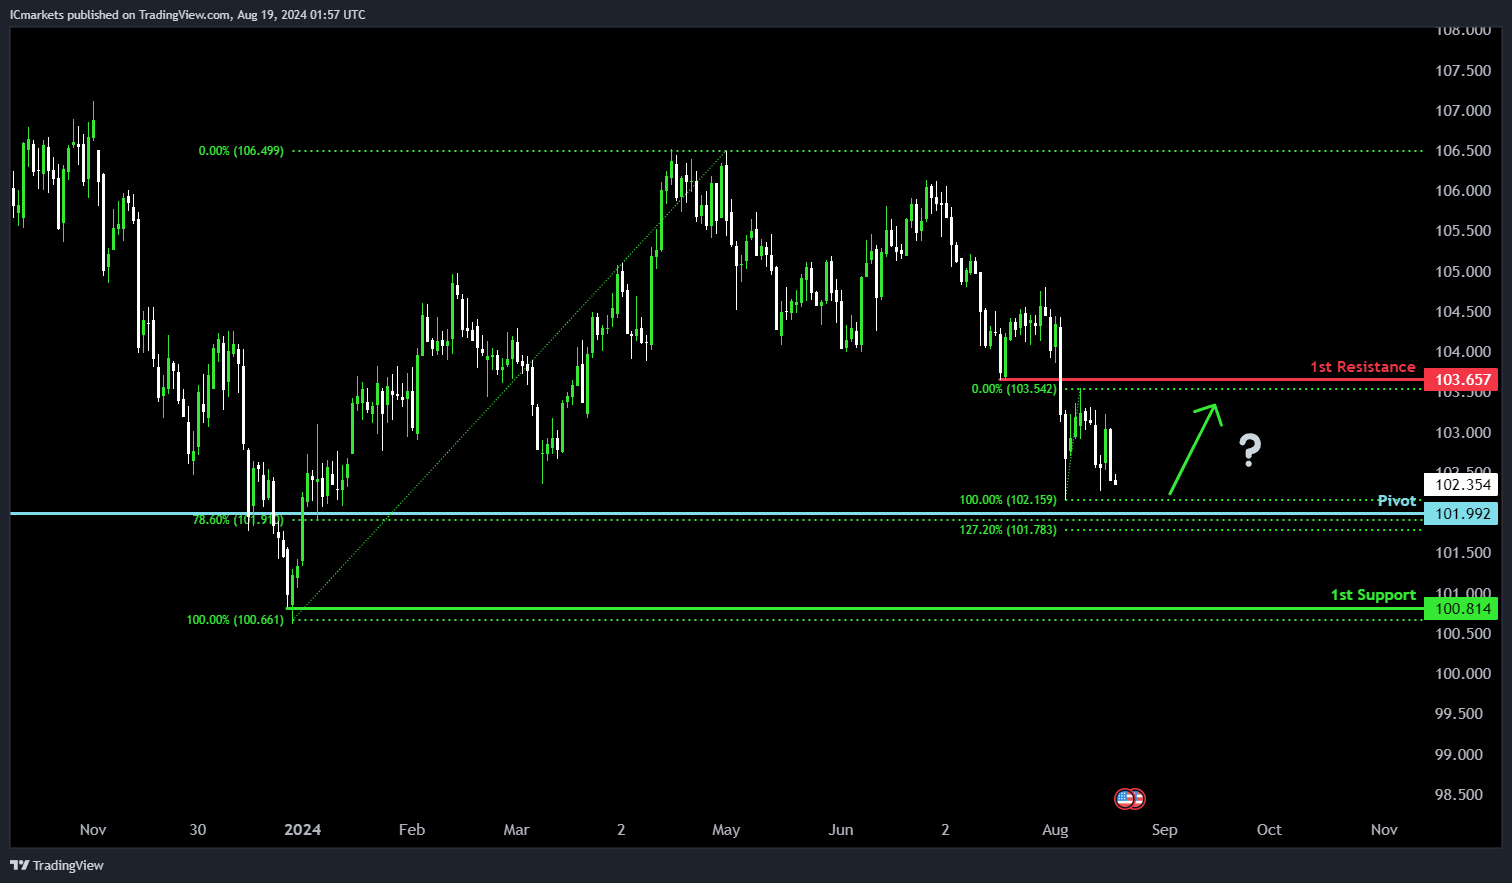
DXY (US Dollar Index):
Potential Direction: Bullish
Overall momentum of the chart: Bearish
Price could potentially make a bullish bounce off the pivot and head towards the 1st resistance.
Pivot: 101.99
Supporting reasons: Identified as an overlap support, reinforced by the 78.60% Fibonacci Retracement and the 127.20% Fibonacci Extension, indicating a confluence of support that could encourage buying activity.
1st support: 100.81
Supporting reasons: Identified as swing low support, suggesting a significant area where previous declines have been halted, potentially providing a strong base for a reversal or continuation of bullish momentum.
1st resistance: 103.65
Supporting reasons: Identified as an overlap resistance, indicating a level where the price might face selling pressure, which could either stall the bullish momentum or confirm a break to higher levels.
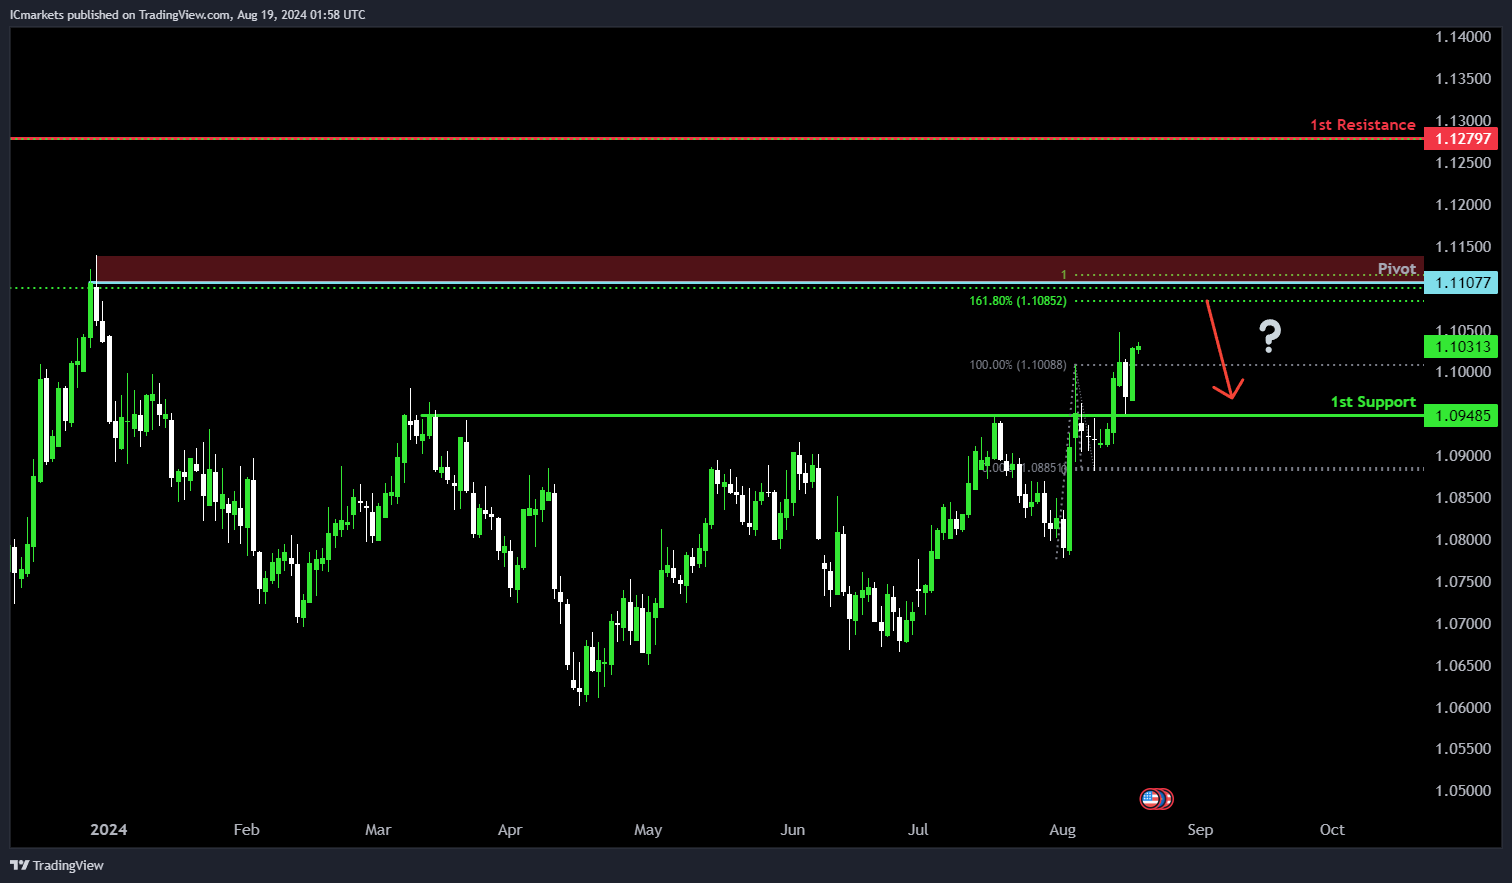
EUR/USD:
Potential Direction: Bearish
Overall momentum of the chart: Bullish
Price could potentially make a bearish reaction off the pivot and drop to the 1st support.
Pivot: 1.1107
Supporting reasons: Identified as swing high resistance, reinforced by the 100% Fibonacci Projection, suggesting a significant level where bullish momentum may face resistance and potentially reverse.
1st support: 1.0948
Supporting reasons: Identified as an overlap support, indicating an area where previous declines have found a stable base, which could serve as a target for a potential bearish move.
1st resistance: 1.1279
Supporting reasons: Identified as swing high resistance, representing a level where previous bullish advances have faced selling pressure, making it a key level to watch if the price continues to rise.
EUR/JPY:
Potential Direction: Bearish
Overall momentum of the chart: Bearish
Price could potentially make a bearish reaction off the pivot and drop to the 1st support.
Pivot: 164.48
Supporting reasons: Identified as pullback resistance, reinforced by the 50% Fibonacci Retracement, indicating a key level where bearish momentum could resume.
1st support: 157.95
Supporting reasons: Identified as an overlap support, marking an area where previous declines have stabilized, potentially serving as a target for a bearish move.
1st resistance: 170.74
Supporting reasons: Identified as pullback resistance, supported by the 78.60% Fibonacci Retracement, suggesting a significant level where bullish attempts may face selling pressure.

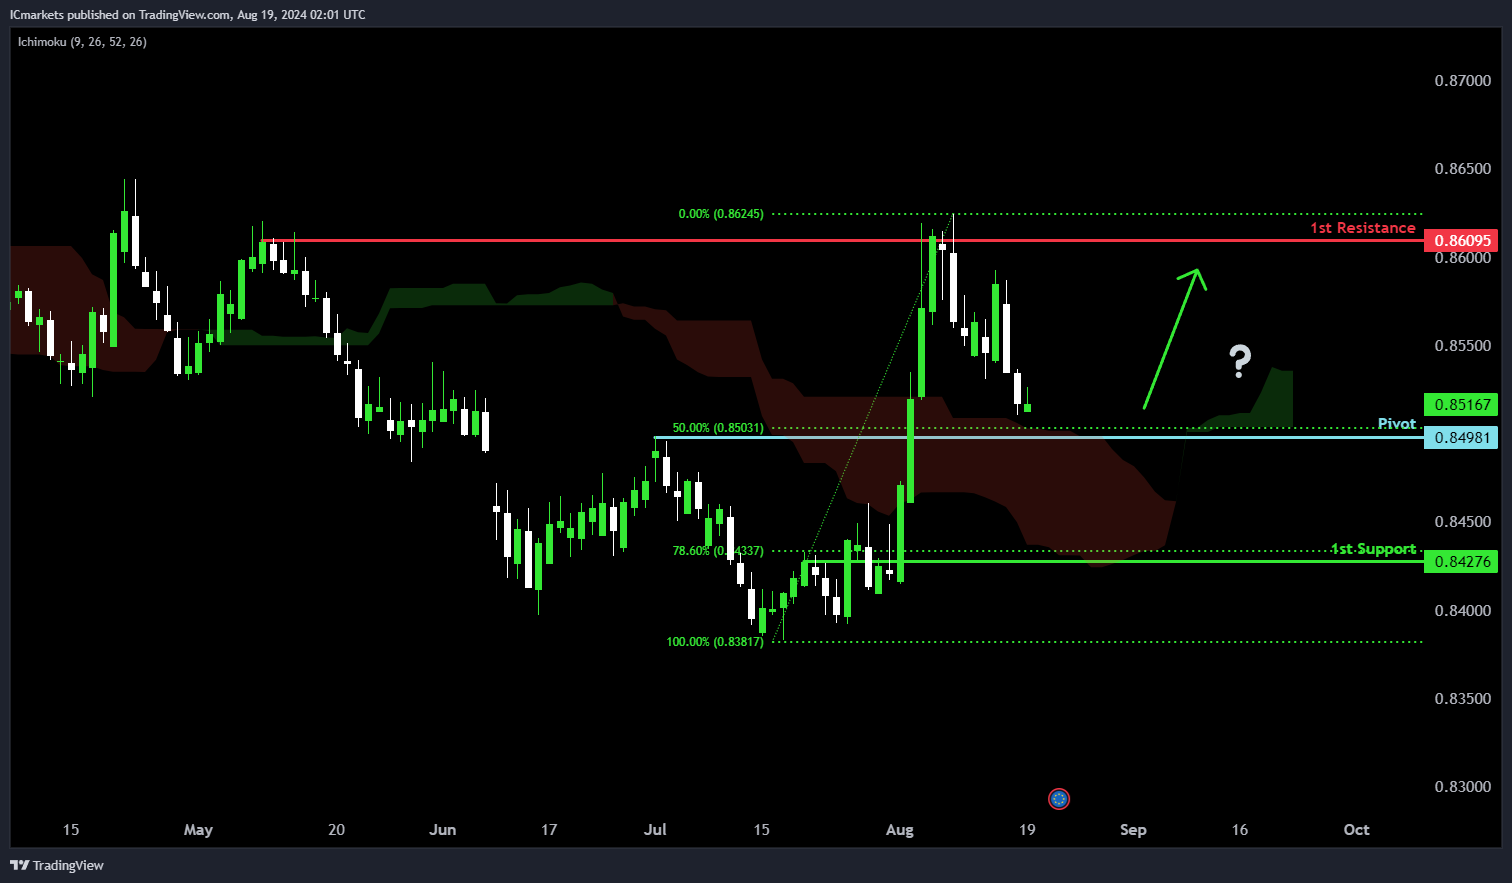
EUR/GBP:
Potential Direction: Bullish
Overall momentum of the chart: Bullish
Price could potentially make a bullish bounce off the pivot and head towards the 1st resistance.
Pivot: 0.8498
Supporting reasons: Identified as pullback support, reinforced by the 50% Fibonacci Retracement, suggesting a potential area for bullish momentum to resume.
1st support: 0.8427
Supporting reasons: Identified as pullback support, supported by the 78.60% Fibonacci Retracement, indicating a key level where the price could find strong support.
1st resistance: 0.8609
Supporting reasons: Identified as multi-swing high resistance, marking a significant area where bullish movements may encounter selling pressure.
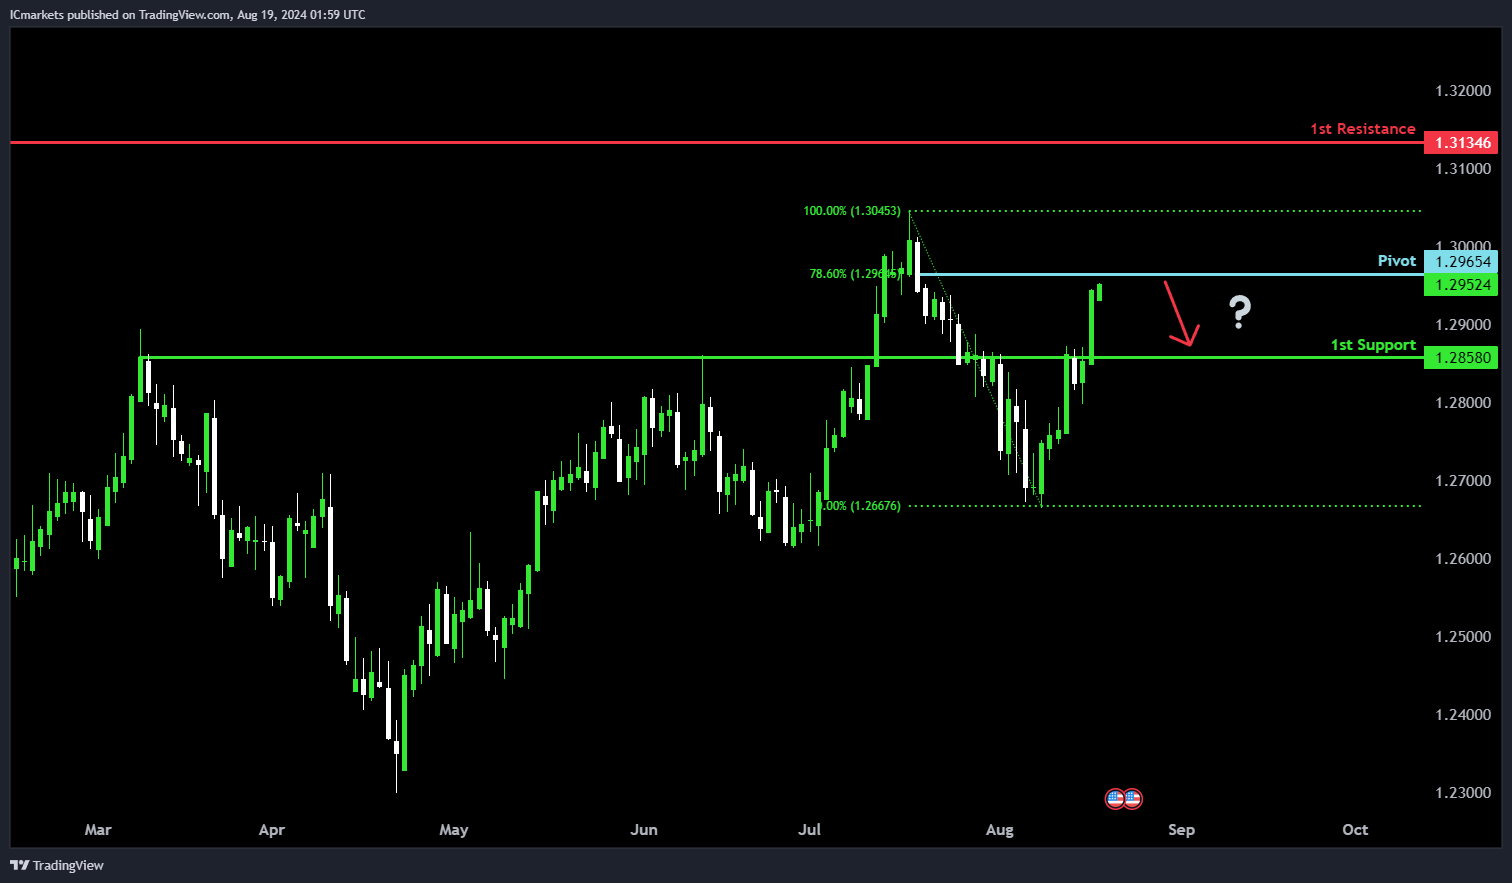
GBP/USD:
Potential Direction: Bearish
Overall momentum of the chart: Bullish
Price could potentially make a bearish reaction off the pivot and drop to the 1st support.
Pivot: 1.2965
Supporting reasons: Identified as pullback resistance, reinforced by the 78.60% Fibonacci Retracement, suggesting a potential area where bearish momentum may resume.
1st support: 1.2858
Supporting reasons: Identified as pullback support, indicating a significant area where price may find support after a decline.
1st resistance: 1.3134
Supporting reasons: Identified as swing high resistance, marking a level where bullish movements may encounter selling pressure.
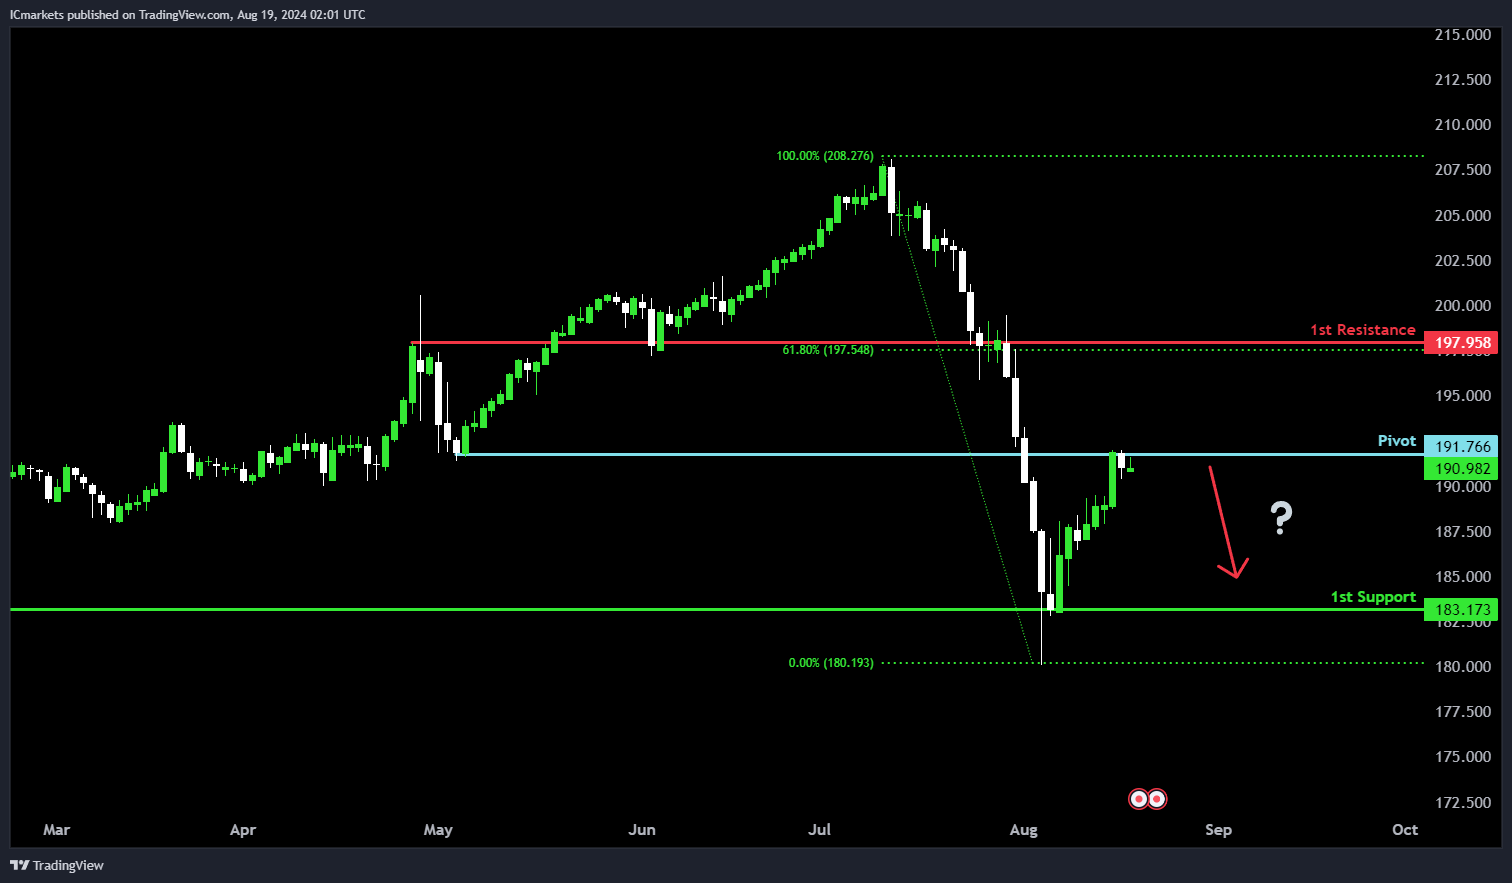
GBP/JPY:
Potential Direction: Bearish
Overall momentum of the chart: Bearish
Price could potentially make a bearish break off the pivot and drop towards the 1st support.
Pivot: 191.76
Supporting reasons: Identified as an overlap resistance, indicating a potential level where the price might face selling pressure.
1st support: 183.17
Supporting reasons: Identified as multi-swing low support, marking a significant area where previous declines have found support.
1st resistance: 197.95
Supporting reasons: Identified as pullback resistance, reinforced by the 61.80% Fibonacci Retracement, suggesting a potential reversal point where bullish attempts may falter.
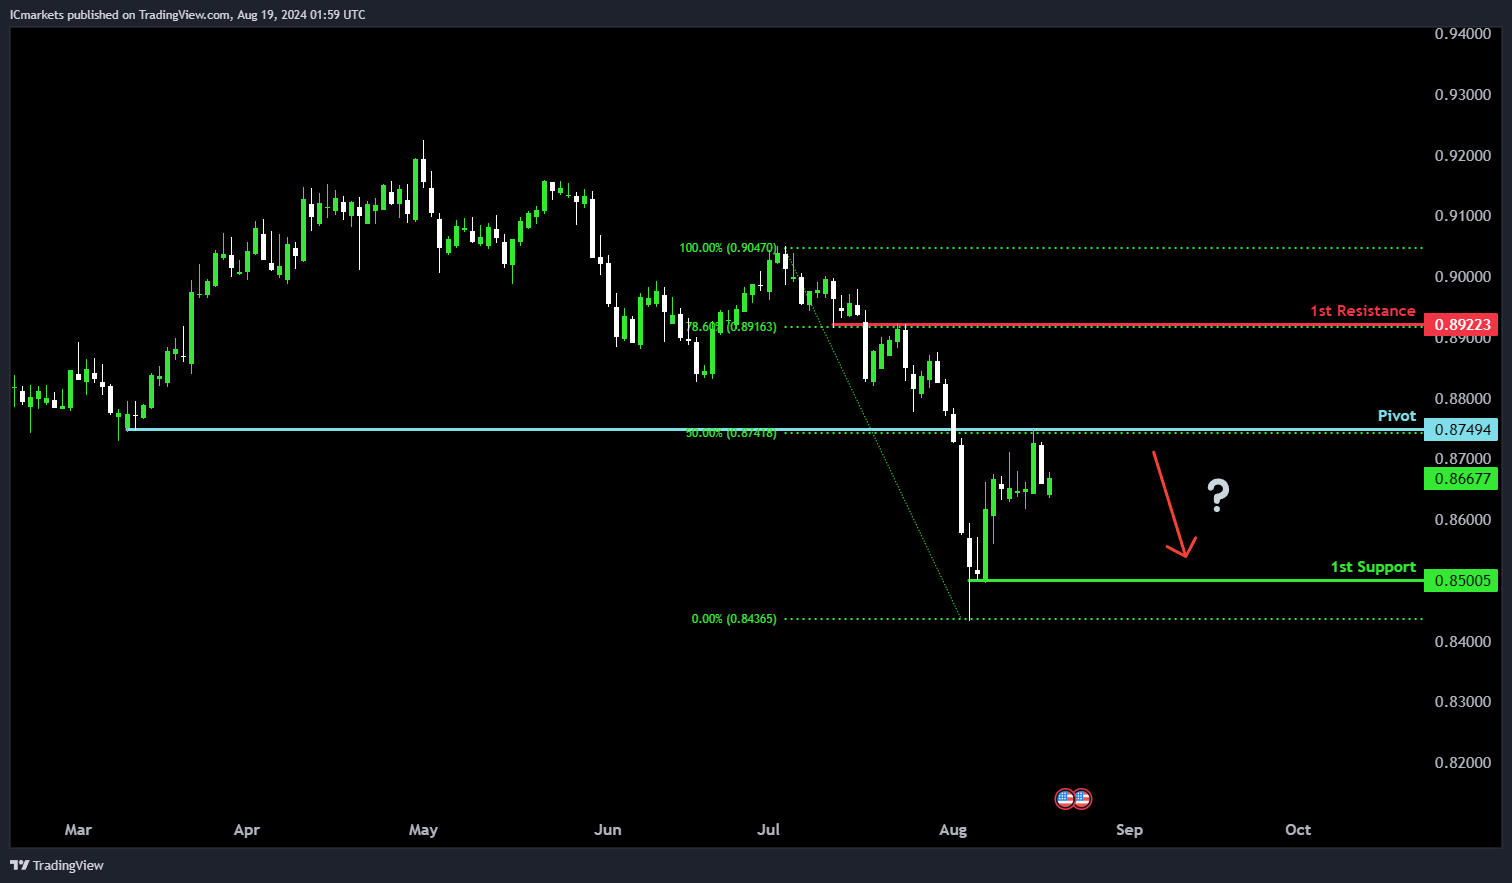
USD/CHF:
Potential Direction: Bearish
Overall momentum of the chart: Bearish
Price could potentially make a bearish continuation towards the 1st support.
Pivot: 0.8749
Supporting reasons: Identified as an overlap resistance, supported by the 50% Fibonacci Retracement, indicating a potential level where the price might encounter selling pressure.
1st support: 0.8500
Supporting reasons: Identified as swing low support, marking a significant area where previous declines have found support.
1st resistance: 0.8922
Supporting reasons: Identified as an overlap resistance, reinforced by the 78.60% Fibonacci Retracement, suggesting a potential reversal point where bullish attempts may struggle.
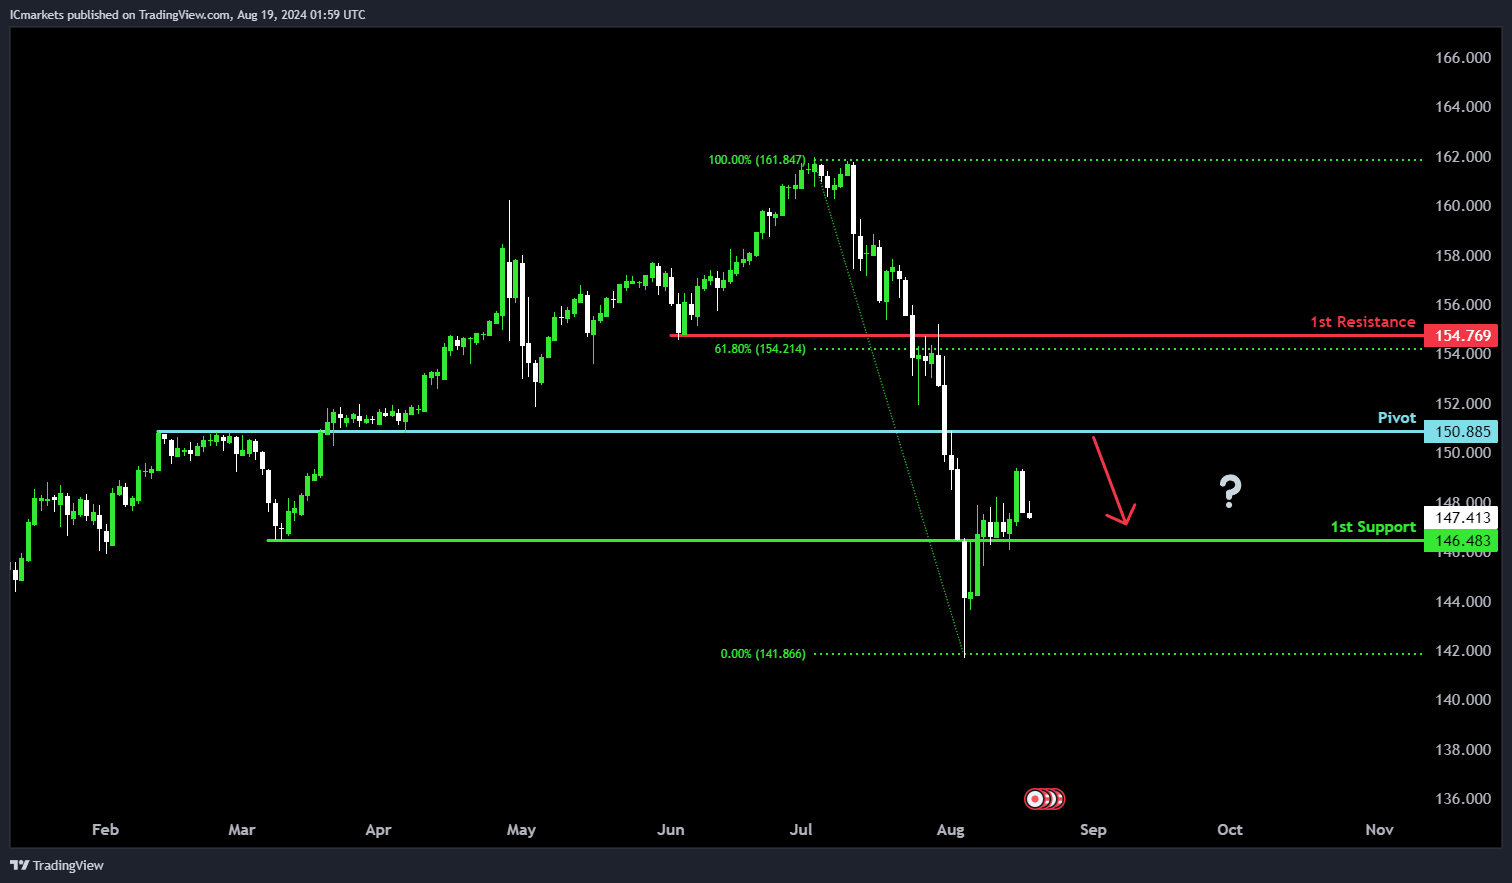
USD/JPY:
Potential Direction: Bearish
Overall momentum of the chart: Bearish
Price could potentially make a bearish reaction off the pivot and drop to the 1st support.
Pivot: 150.88
Supporting reasons: Identified as pullback support, indicating a potential level where a temporary rebound might occur before continuing the bearish trend.
1st support: 146.48
Supporting reasons: Identified as an overlap support, suggesting a significant area where previous price declines have found buying interest.
1st resistance: 154.76
Supporting reasons: Identified as an overlap resistance, reinforced by the 61.80% Fibonacci Retracement, marking a potential area where bullish attempts might face selling pressure
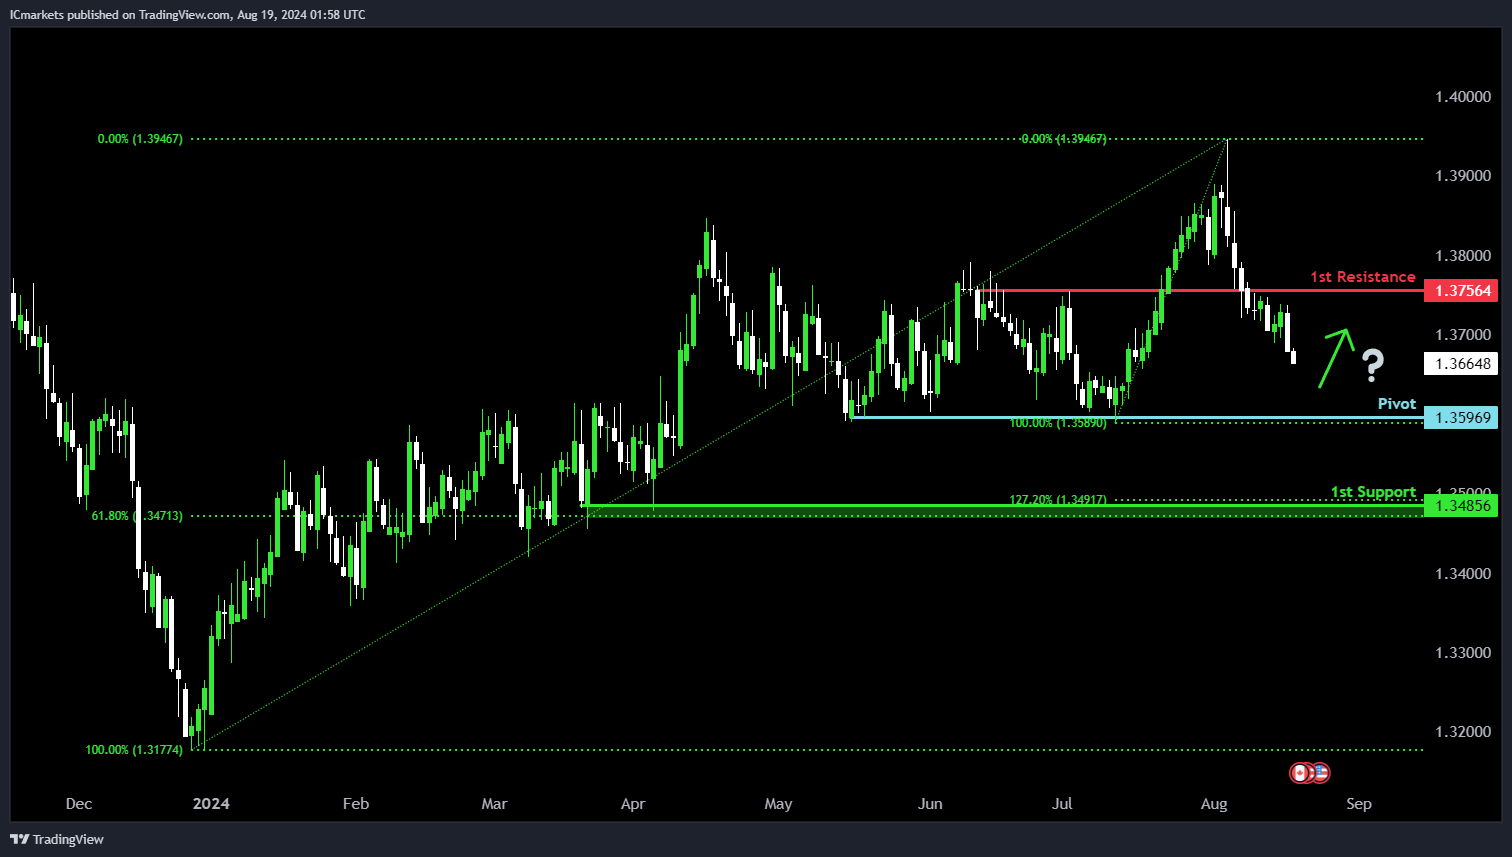
USD/CAD:
Potential Direction: Bullish
Overall momentum of the chart: Bearish
Price is falling towards the pivot and could potentially make a bullish bounce off this level to rise towards the 1st resistance.
Pivot: 1.3596
Supporting reasons: Identified as a pullback support, indicating a potential area where buying interests could pick up to stage a minor rebound.
1st support: 1.3485
Supporting reasons: Identified as a pullback support that aligns close to a 61.8% Fibonacci retracement level, indicating a potential area where price could find strong support.
1st resistance: 1.3756
Supporting reasons: Identified as a pullback resistance, indicating a potential area that could halt any further upward movement.
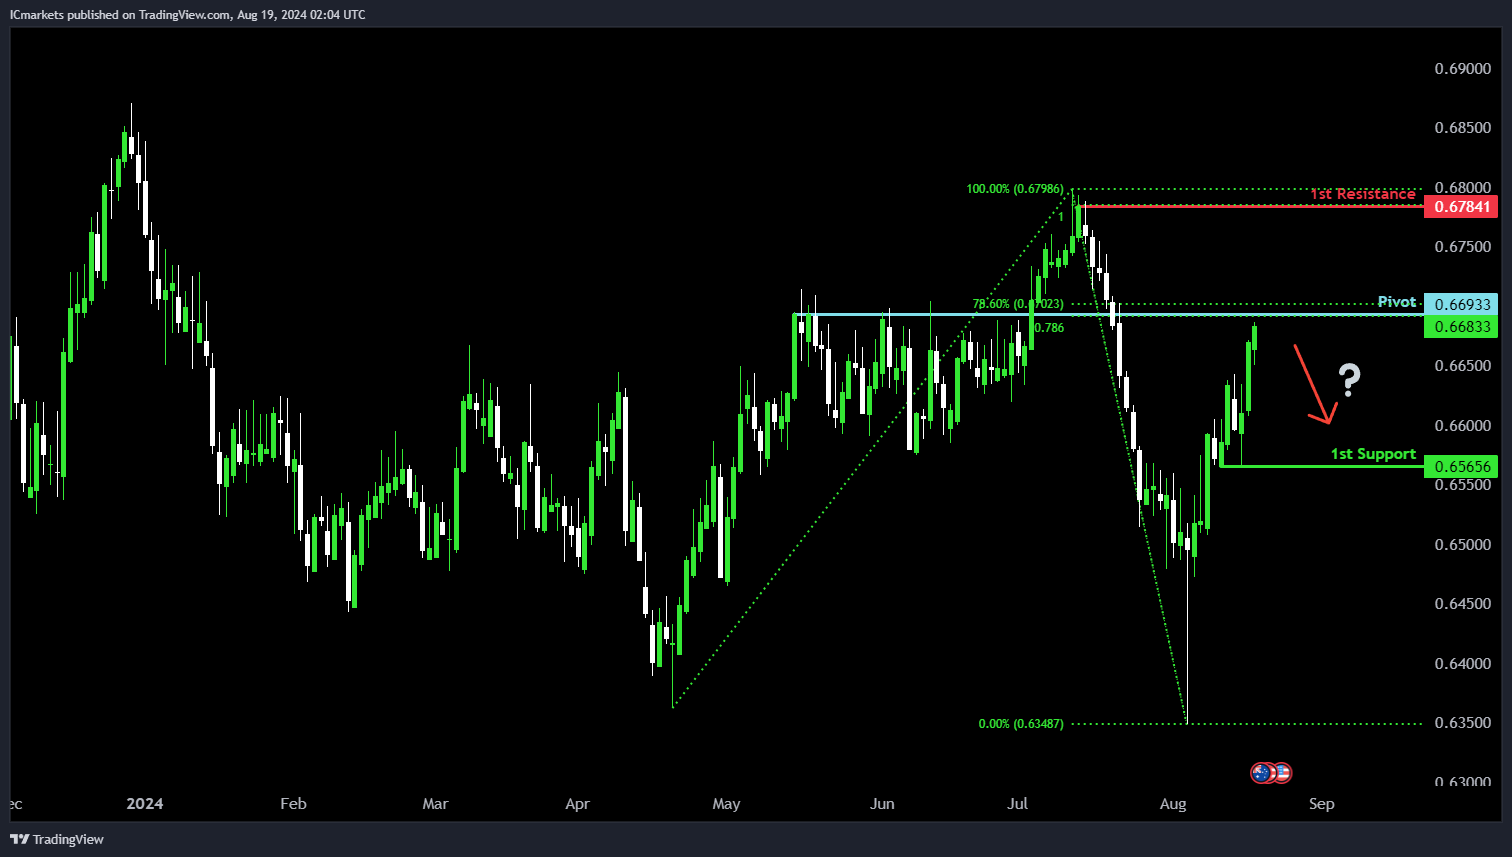
AUD/USD:
Potential Direction: Bearish
Overall momentum of the chart: Bullish
Price is rising towards the pivot and could potentially make a bearish reversal off this level to pull back towards the 1st support.
Pivot: 0.6693
Supporting reasons: Identified as a pullback resistance that aligns with a confluence of Fibonacci levels i.e. the 78.6% retracement and projection levels, indicating a potential area where selling pressures could intensify.
1st support: 0.6565
Supporting reasons: Identified as a pullback support, suggesting a significant area where price has recently found support.
1st resistance: 0.6784
Supporting reasons: Identified as a swing-high resistance that aligns with a 100% Fibonacci projection level, indicating a significant area that could halt further upward movement.
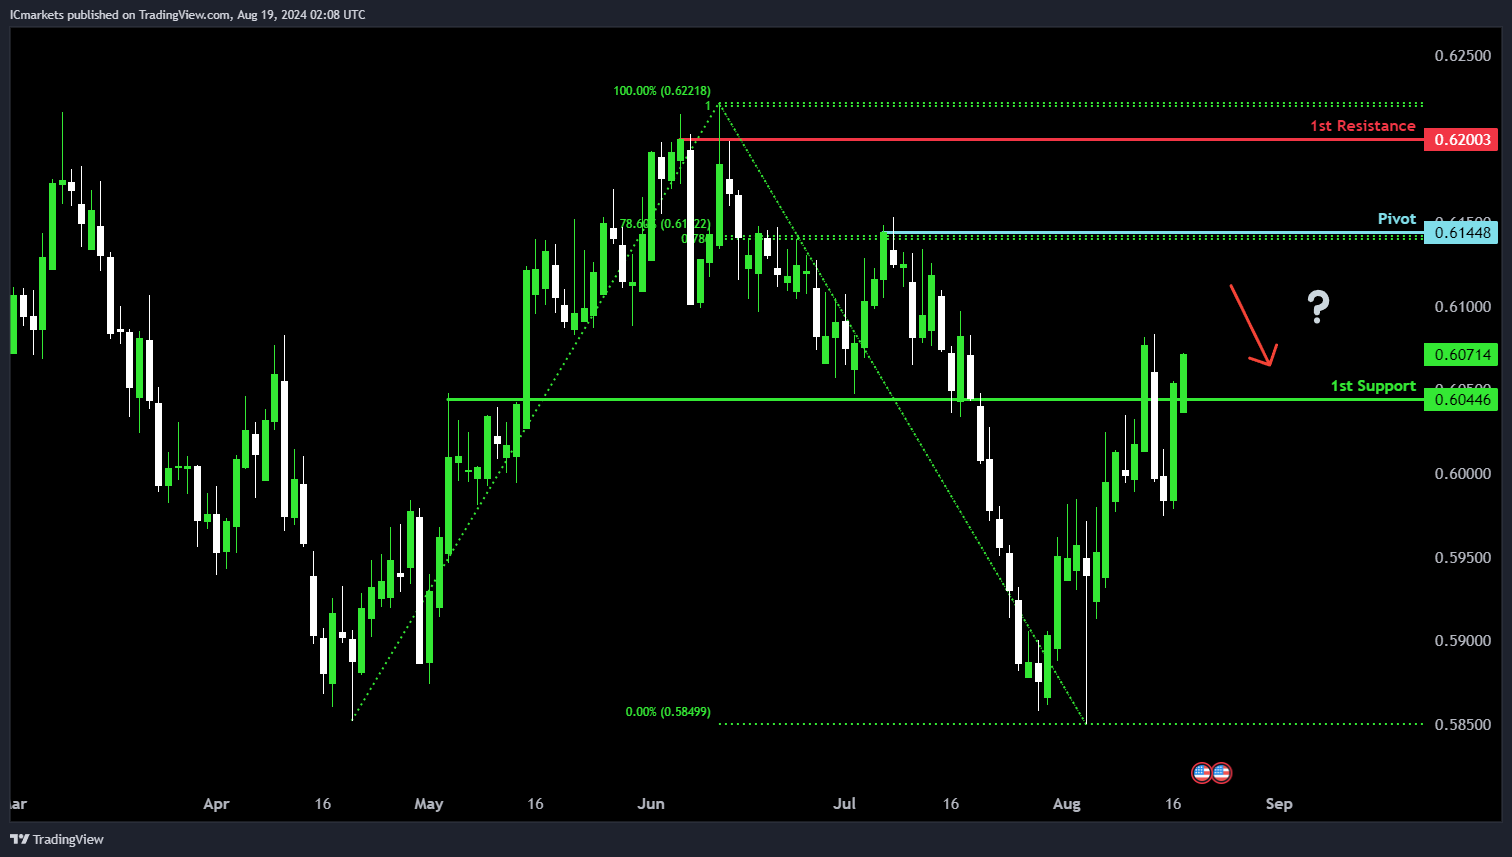
NZD/USD
Potential Direction: Bearish
Overall momentum of the chart: Bullish
Price is rising towards the pivot and could potentially make a bearish reversal off this level to pull back towards the 1st support.
Pivot: 0.6144
Supporting reasons: Identified as a pullback resistance that aligns with a confluence of Fibonacci levels i.e. the 78.6% retracement and projection levels, indicating a potential area where selling pressures could intensify.
1st support: 0.6044
Supporting reasons: Identified as an overlap support, suggesting a potential area where price could find strong support.
1st resistance: 0.6200
Supporting reasons: Identified as a swing-high resistance that aligns close to a 100% Fibonacci projection level, indicating a significant area that could halt further upward movement.
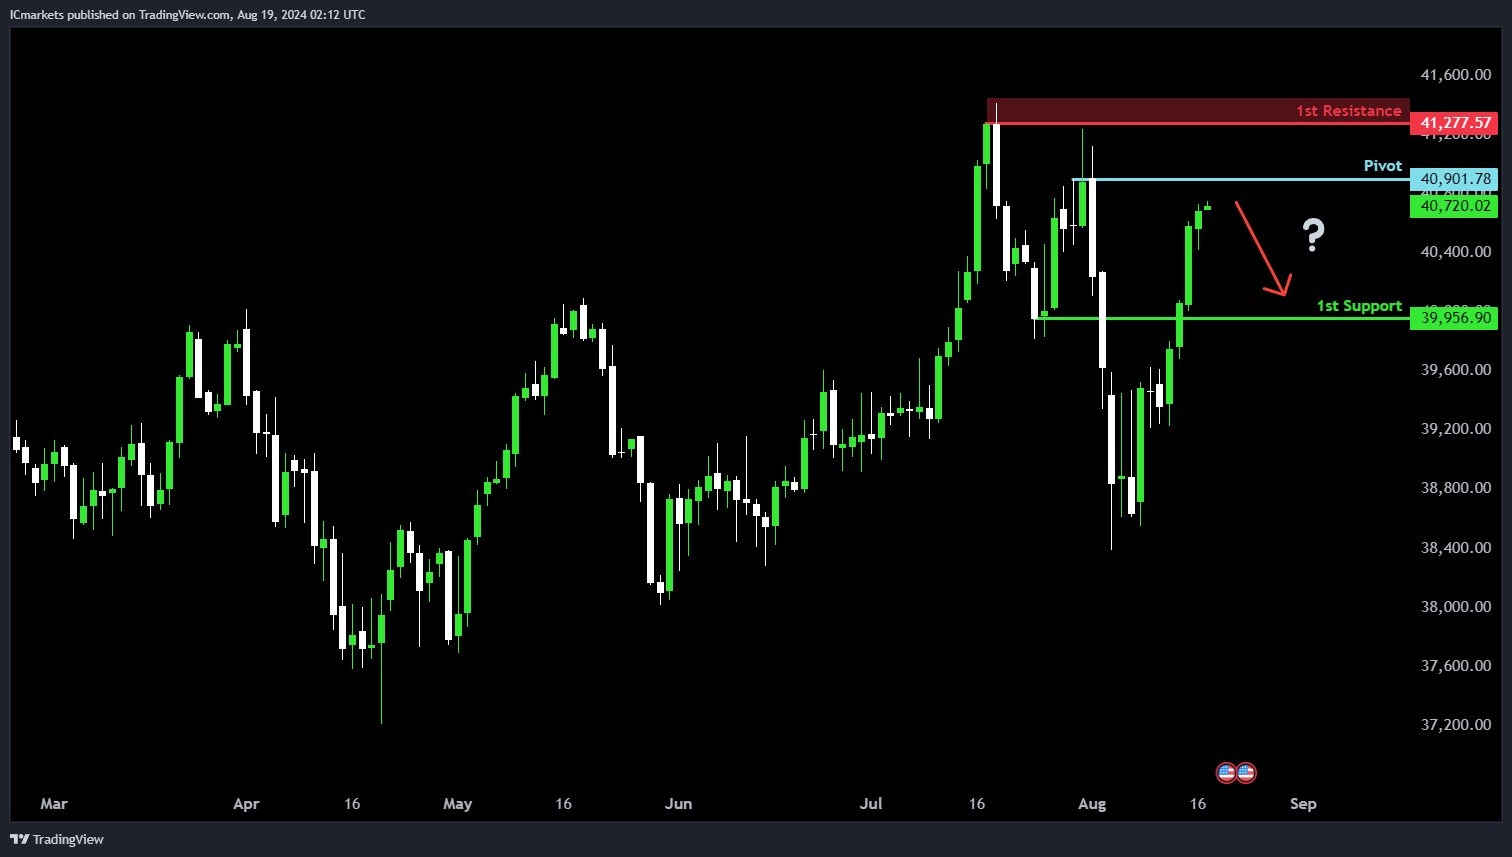
US30 (DJIA):
Potential Direction: Bearish
Overall Momentum of the Chart: Bullish
Price is rising towards the pivot and could potentially make a bearish reversal off this level to pull back towards the 1st support.
Pivot: 40,901.78
Supporting reasons: Identified as a pullback resistance, suggesting a potential area where selling pressures could intensify.
1st Support: 39,956.90
Supporting Reasons: Identified as a pullback support, suggesting a potential area where price could find support.
1st Resistance: 41,277.57
Supporting Reasons: Identified as a swing-high resistance that aligns close to the all-time high, indicating a significant area that could halt further upward movement.
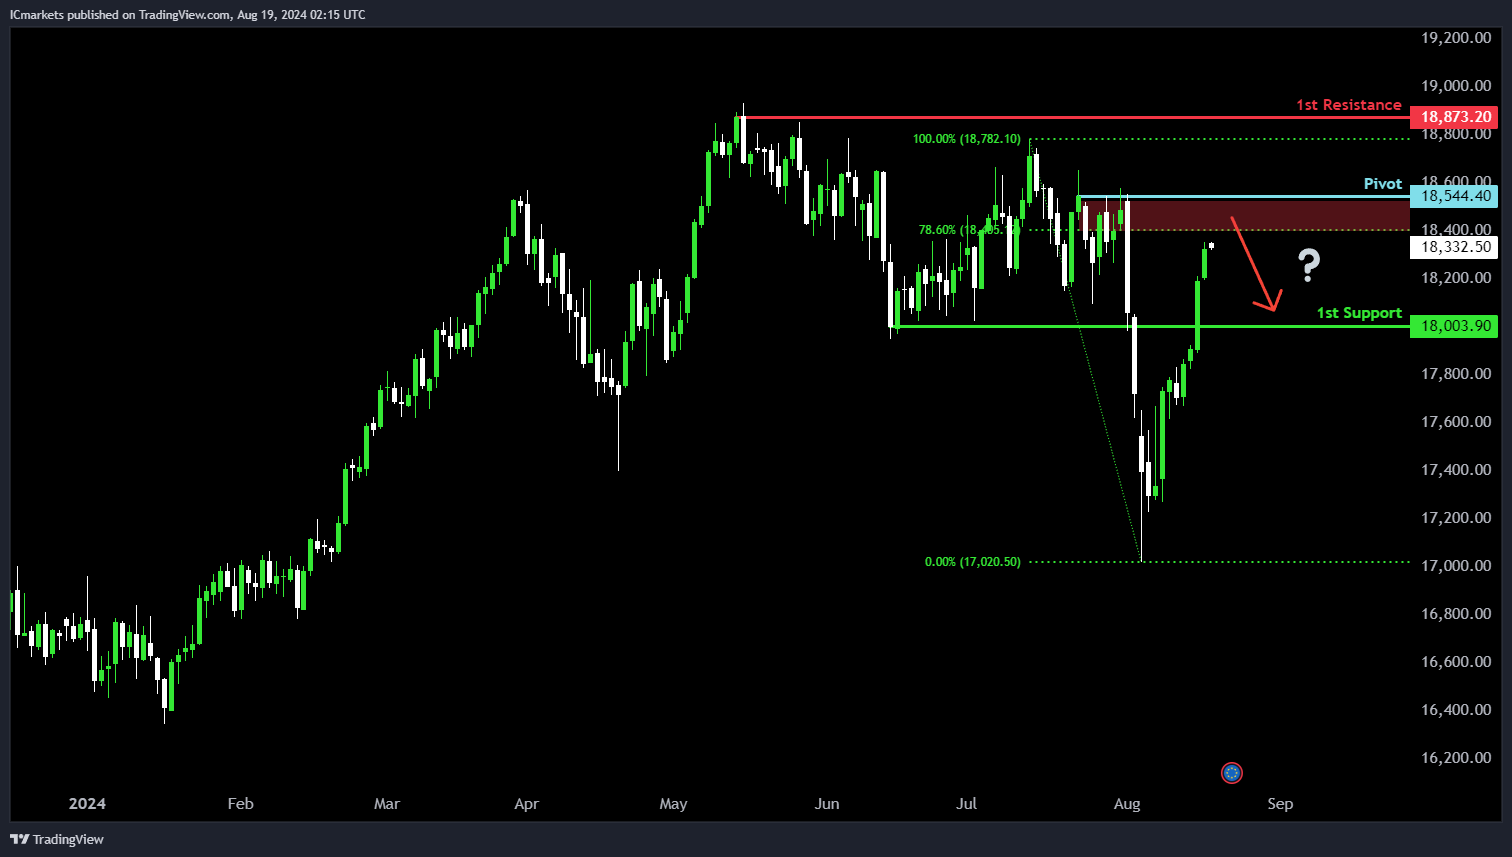
DE40 (DAX):
Potential Direction: Bearish
Overall Momentum of the Chart: Bullish
Price is rising towards the pivot and could potentially make a bearish reversal off this level to pull back towards the 1st support.
Pivot: 18,544.40
Supporting reasons: Identified as a pullback resistance that aligns close to a 78.6% Fibonacci retracement level, suggesting a potential area where selling pressures could intensify.
1st Support: 18,003.90
Supporting Reasons: Identified as a pullback support, indicating a potential area where price could find support.
1st Resistance: 18,873.20
Supporting Reasons: Identified as a swing-high resistance that aligns close to the all-time high, indicating a significant area that could halt further upward movement.
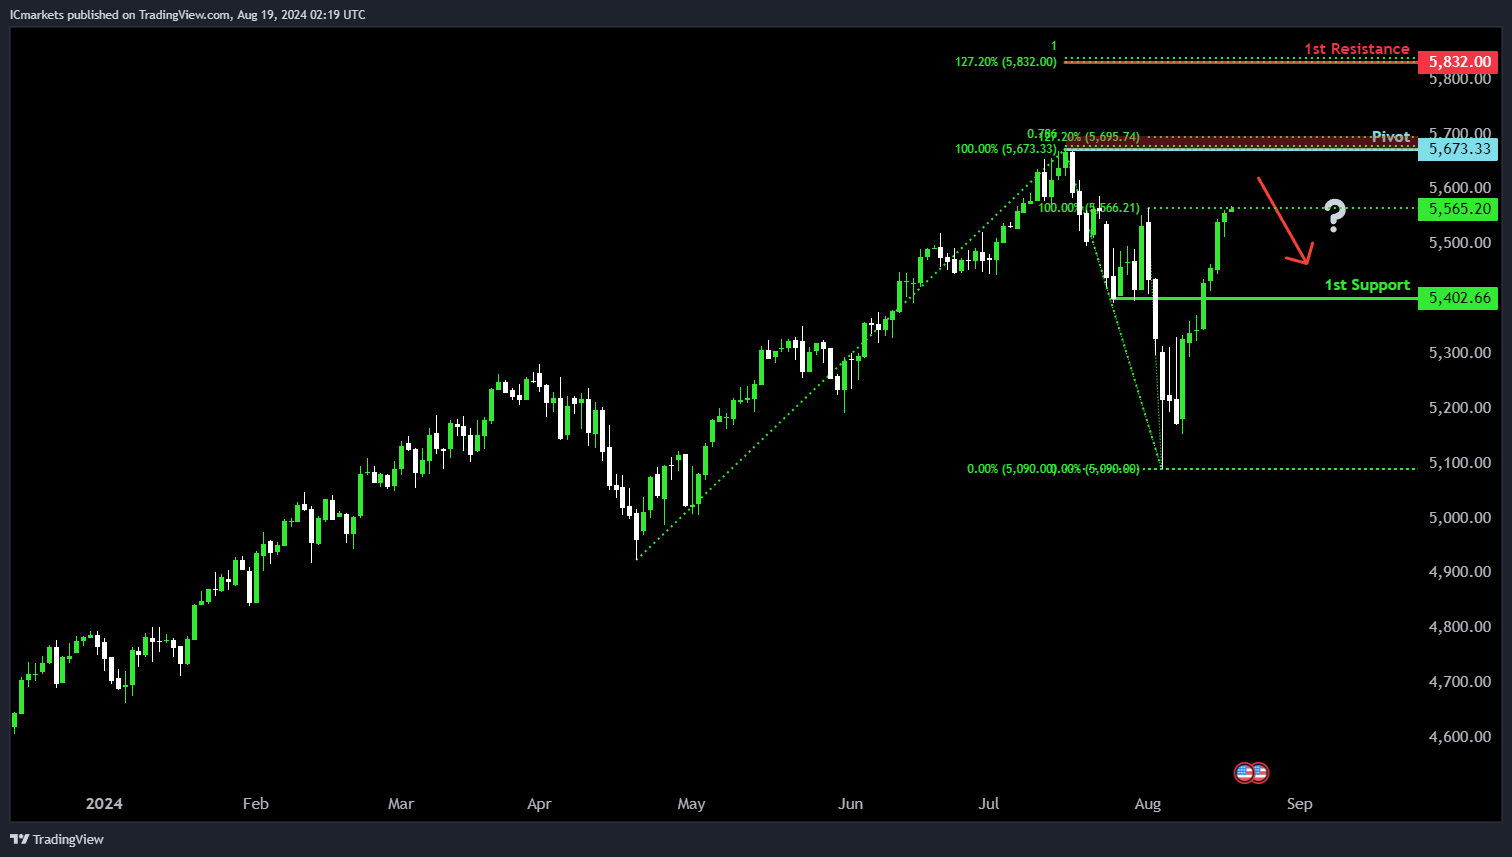
US500 (S&P 500):
Potential Direction: Bearish
Overall Momentum of the Chart: Bullish
Price is rising towards the pivot and could potentially make a bearish reversal off this level to pull back towards the 1st support.
Pivot: 5,673.33
Supporting reasons: Identified as a swing-high resistance that aligns with a confluence of Fibonacci levels i.e. the 78.6% projection and 127.2% extension levels, suggesting a potential area where selling pressures could intensify.
1st support: 5,402.66
Supporting reasons: Identified as a pullback support, suggesting a potential area where price could find support.
1st resistance: 5,832.00
Supporting reasons: Identified as a resistance that aligns with a confluence of Fibonacci levels i.e. the 100% projection and 127.2% extension levels, suggesting a critical area that could halt further upward movement.
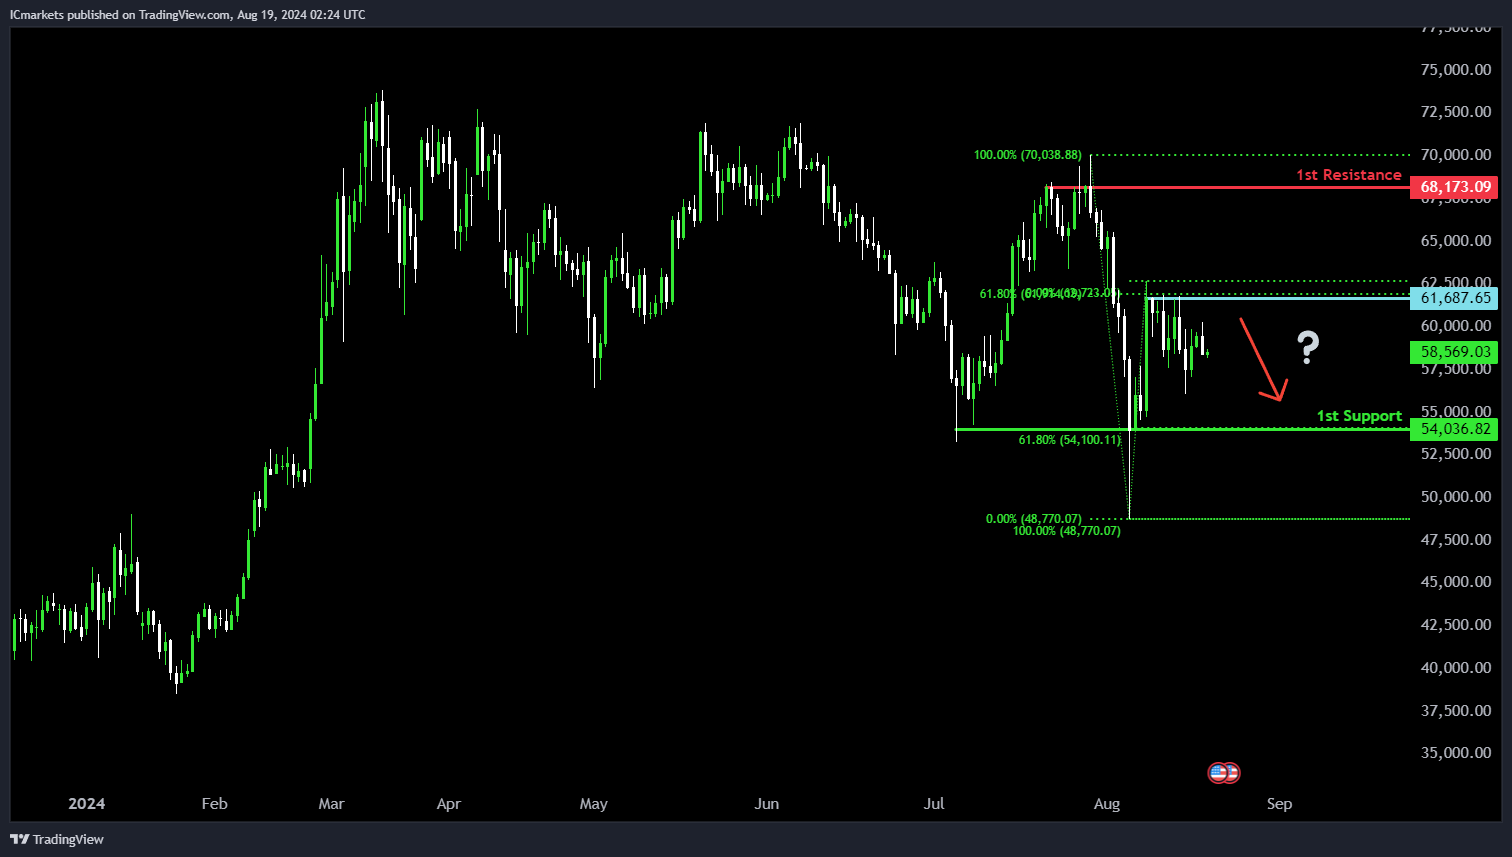
BTC/USD (Bitcoin):
Potential Direction: Bearish
Overall momentum of the chart: Neutral
Price is rising towards the pivot and could potentially make a bearish reversal off this level to fall towards the 1st support.
Pivot: 61,687.65
Supporting reasons: Identified as a pullback resistance that aligns with a 61.8% Fibonacci retracement level, indicating a potential area where selling pressures could intensify.
1st support: 54,036.82
Supporting reasons: Identified as a pullback support that aligns with a 61.8% Fibonacci retracement level, indicating a significant area where price has found support in the past.
1st resistance: 68,173.09
Supporting reasons: Identified as a swing-high resistance, indicating a potential barrier that could halt further upward movement.
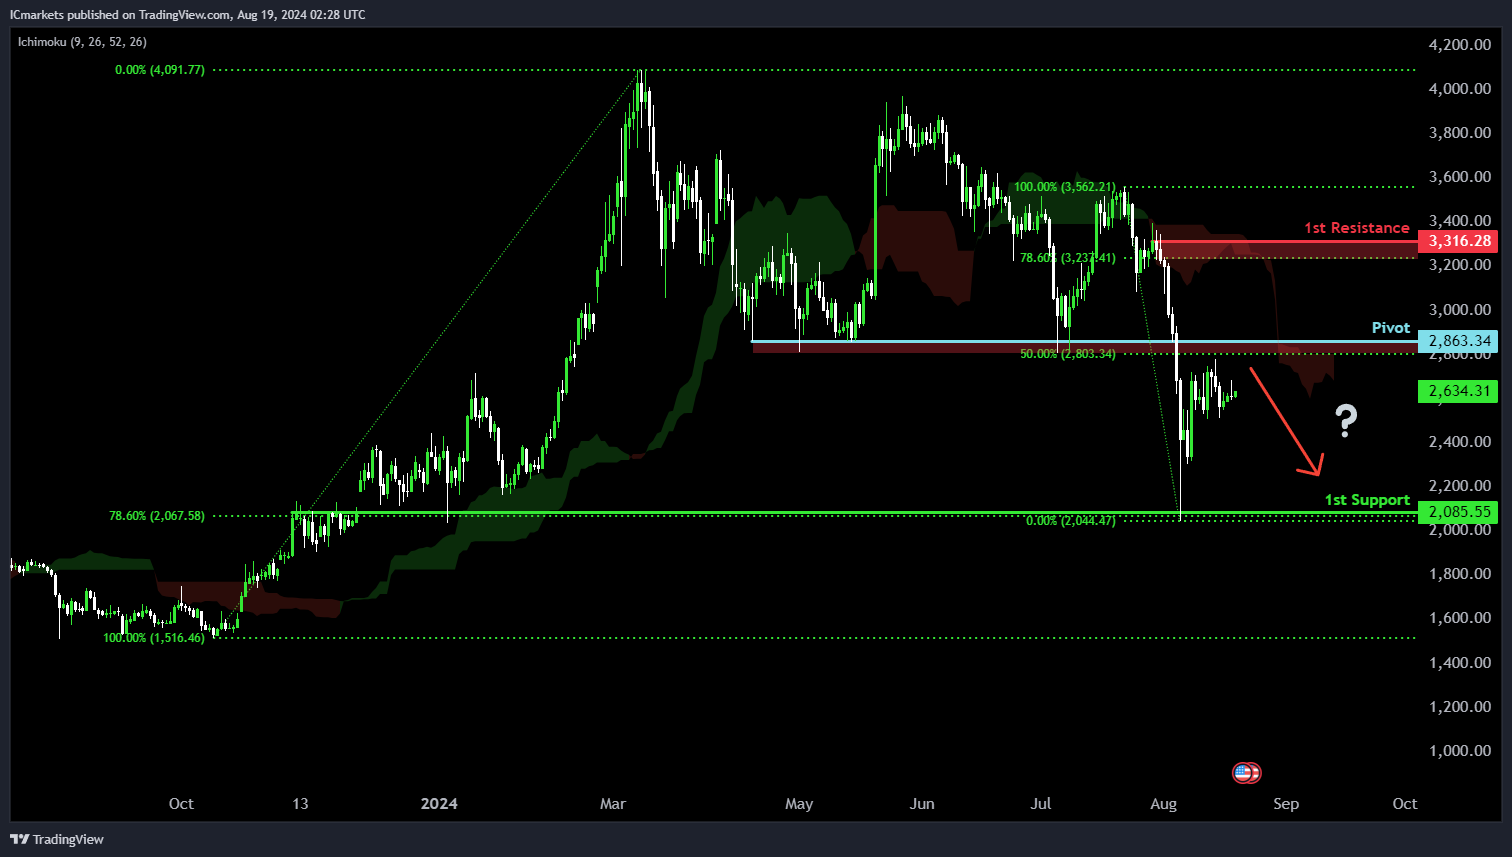
ETH/USD (Ethereum):
Potential Direction: Bearish
Overall momentum of the chart: Neutral
Price is rising towards the pivot and could potentially make a bearish reversal off this level to fall towards the 1st support.
Pivot: 2,863.34
Supporting reasons: Identified as a pullback resistance that aligns close to a 50% Fibonacci retracement level, indicating a potential area where selling pressures could intensify. The presence of a bearish Ichimoku Cloud adds further significance to the strength of this resistance zone.
1st Support: 2,085.55
Supporting Reasons: Identified as an overlap support that aligns with a 78.6% Fibonacci retracement level, indicating a potential area where price could find support.
1st Resistance: 3,316.28
Supporting Reasons: Identified as a pullback resistance that aligns close to a 78.6% Fibonacci retracement level, indicating a historical barrier where that could halt further upward movement.
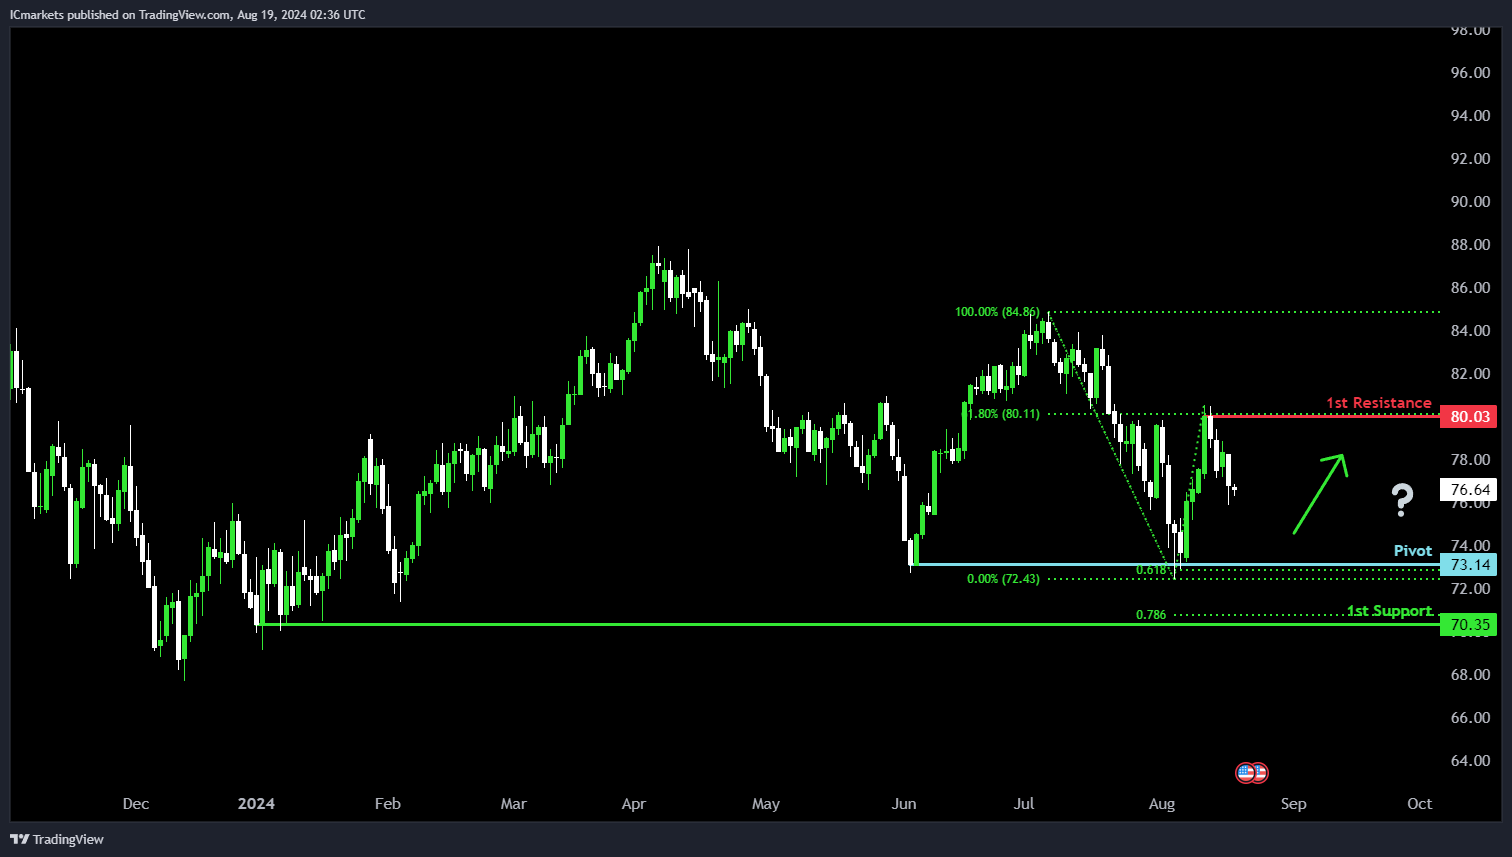
WTI/USD (Oil):
Potential Direction: Bullish
Overall Momentum of the Chart: Bearish
Price is falling towards the pivot and could potentially make a bullish bounce off this level to rise towards the 1st resistance.
Pivot: 73.14
Supporting Reasons: Identified as a multi-swing-low support that aligns with a 61.8% Fibonacci projection level, indicating a potential area where buying interests could pick up to stage a minor rebound.
1st Support: 70.35
Supporting Reasons: Identified as a pullback support that aligns with a 78.6% Fibonacci projection level, indicating a significant area where price has found support in the past.
1st Resistance: 80.03
Supporting Reasons: Identified as a pullback resistance that aligns with a 61.8% Fibonacci retracement level, indicating a potential barrier that could halt further upward movement.
XAU/USD (GOLD):
Potential Direction: Bearish
Overall momentum of the chart: Bullish
Price could potentially make a bearish continuation towards the 1st support.
Pivot: 2510.97
Supporting reasons: Identified as pullback resistance, indicating a level where a reversal could occur as sellers potentially regain control.
1st support: 2469.28
Supporting reasons: Identified as pullback support, suggesting an area where the price might find temporary support before continuing the downward move.
1st resistance: 2550.10
Supporting reasons: Supported by the 100% Fibonacci Projection, indicating a significant level where the price could encounter strong resistance.

The accuracy, completeness and timeliness of the information contained on this site cannot be guaranteed. IC Trading does not warranty, guarantee or make any representations, or assume any liability regarding financial results based on the use of the information in the site.
News, views, opinions, recommendations and other information obtained from sources outside of www.ictrading.com, used in this site are believed to be reliable, but we cannot guarantee their accuracy or completeness. All such information is subject to change at any time without notice. IC Trading assumes no responsibility for the content of any linked site.
The fact that such links may exist does not indicate approval or endorsement of any material contained on any linked site. IC Trading is not liable for any harm caused by the transmission, through accessing the services or information on this site, of a computer virus, or other computer code or programming device that might be used to access, delete, damage, disable, disrupt or otherwise impede in any manner, the operation of the site or of any user’s software, hardware, data or property.