
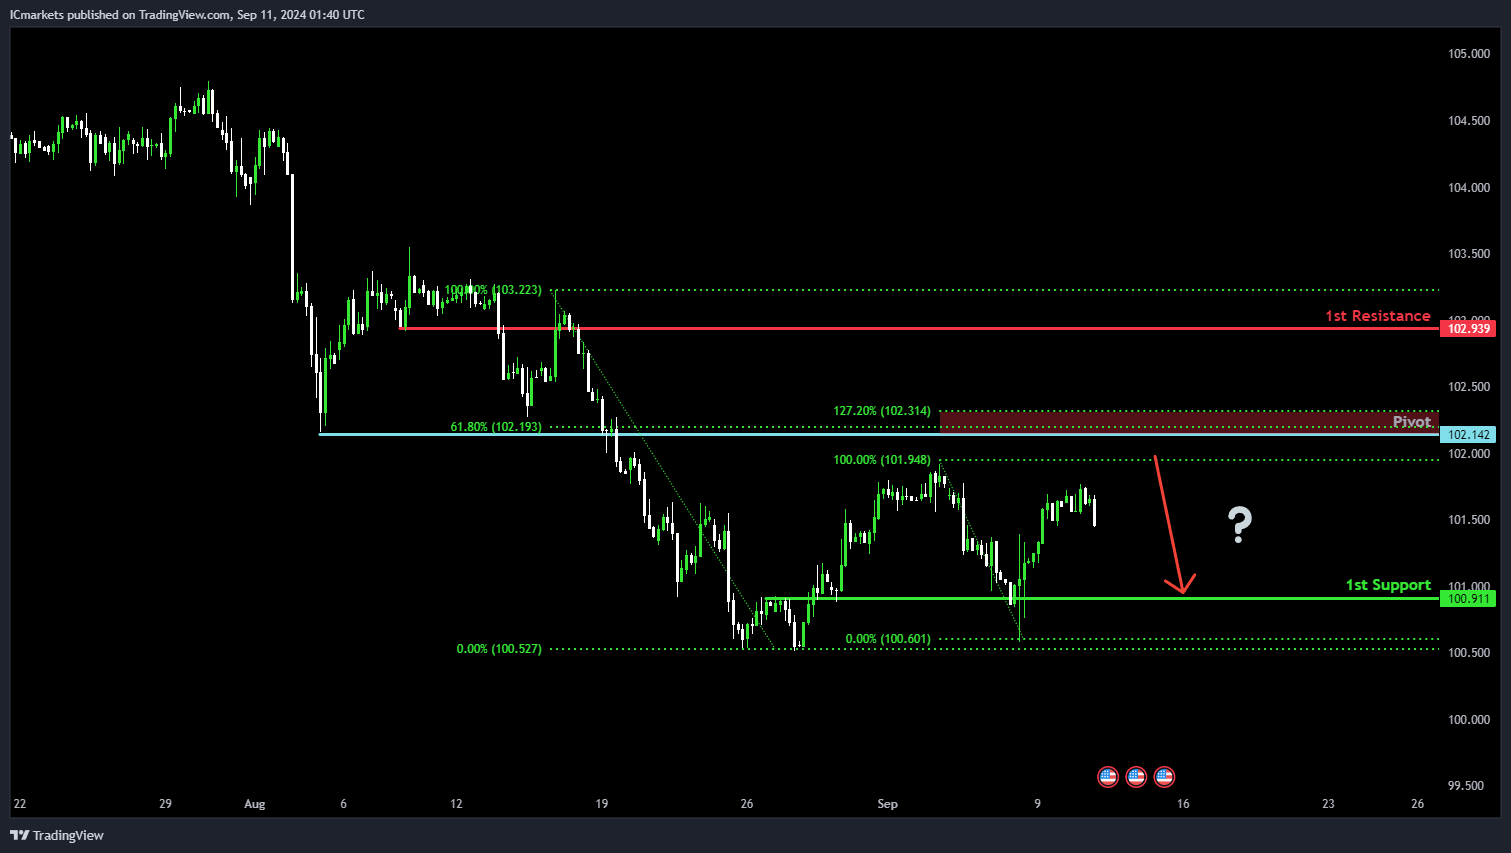
DXY (US Dollar Index):
Potential Direction: Bearish
Overall momentum of the chart: Bearish
Price could potentially make a bearish reaction off the pivot and drop to 1st support.
Pivot: 102.14
Supporting reasons: Pullback support, aligned with the 61.80% Fibonacci Retracement and 127.20% Fibonacci Extension, indicating Fibonacci confluence where price might face selling pressure.
1st support: 100.91Supporting reasons: An overlap support, suggesting a potential level where price might find buying interest to prevent further declines.
1st resistance: 102.93
Supporting reasons: Pullback resistance, indicating a level where price may encounter resistance during a potential upward move.
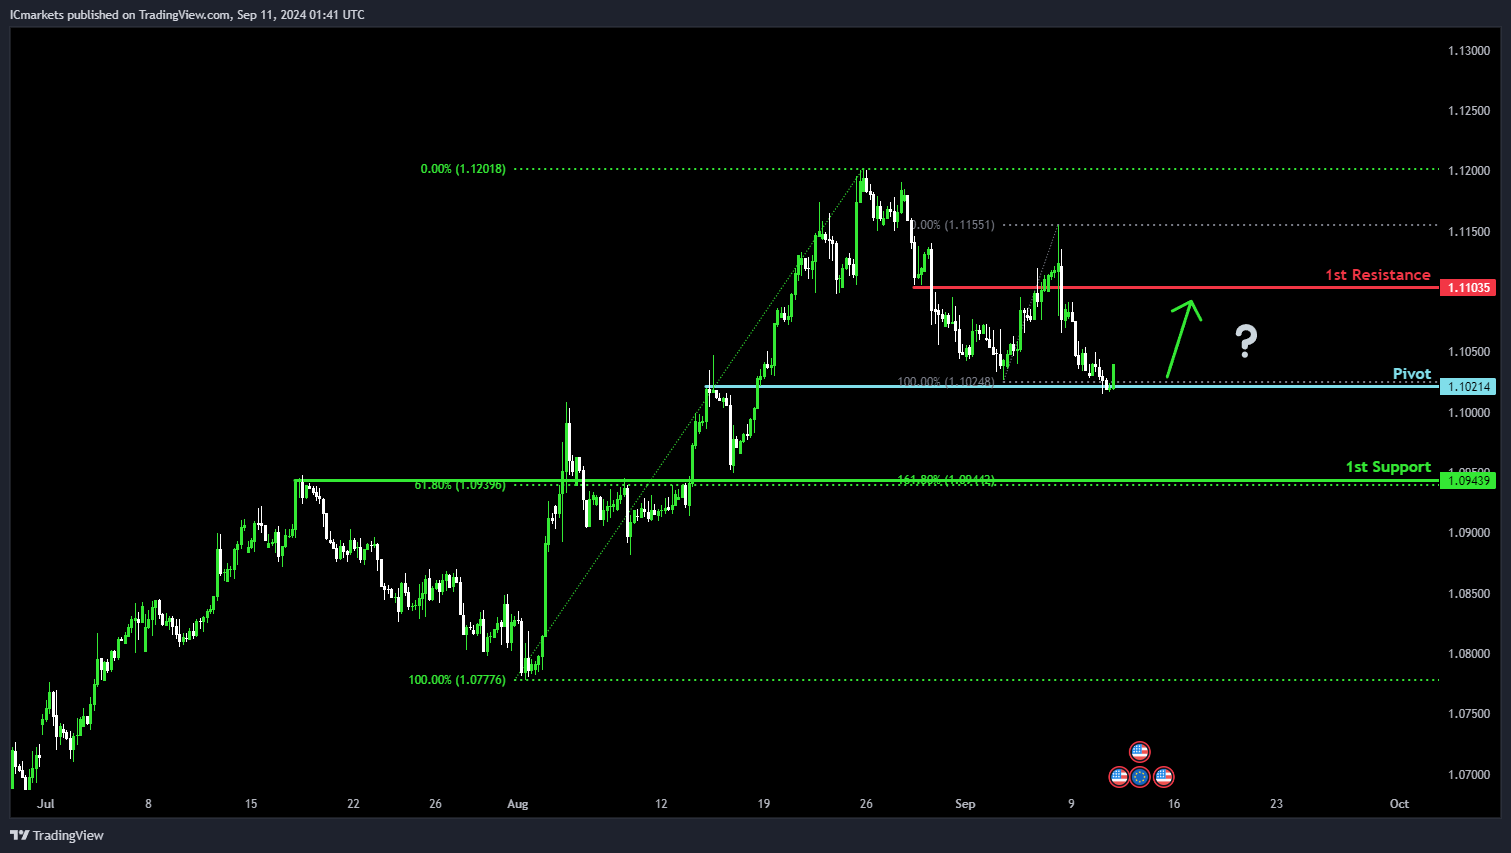
EUR/USD:
Potential Direction: Bullish
Overall momentum of the chart: Bullish
Price could potentially make a bullish bounce off the pivot and head towards 1st resistance.
Pivot: 1.1021
Supporting reasons: An overlap support, suggesting a key level where price might find support and bounce back.
1st support: 1.0943
Supporting reasons: An overlap support, aligned with the 61.80% Fibonacci Retracement and 161.80% Fibonacci Extension, indicating Fibonacci confluence where price might find strong support.
1st resistance: 1.1103
Supporting reasons: Pullback resistance, indicating a potential level where price may face selling pressure during an upward move.
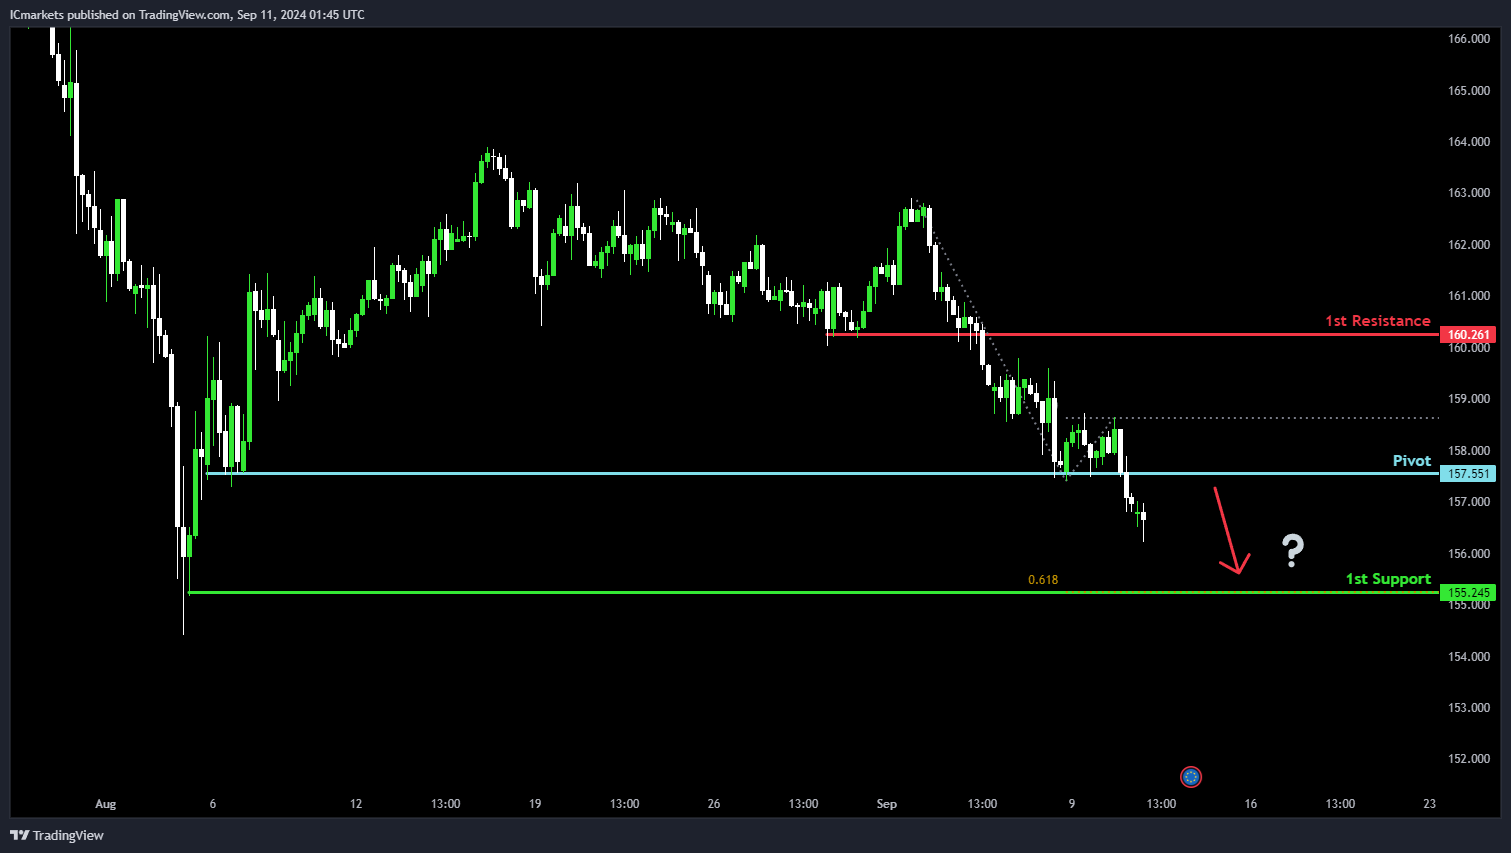
EUR/JPY:
Potential Direction: Bearish
Overall momentum of the chart: Bearish
Price could potentially make a bearish continuation towards 1st support.
Pivot: 157.55
Supporting reasons: Pullback resistance, indicating a key level where price might face selling pressure.
1st support: 155.24
Supporting reasons: Swing low support, aligned with the 61.80% Fibonacci Projection, suggesting a potential level where price may find support and prevent further declines.
1st resistance: 160.26
Supporting reasons: Pullback resistance, indicating a level where price might encounter resistance during an upward move.
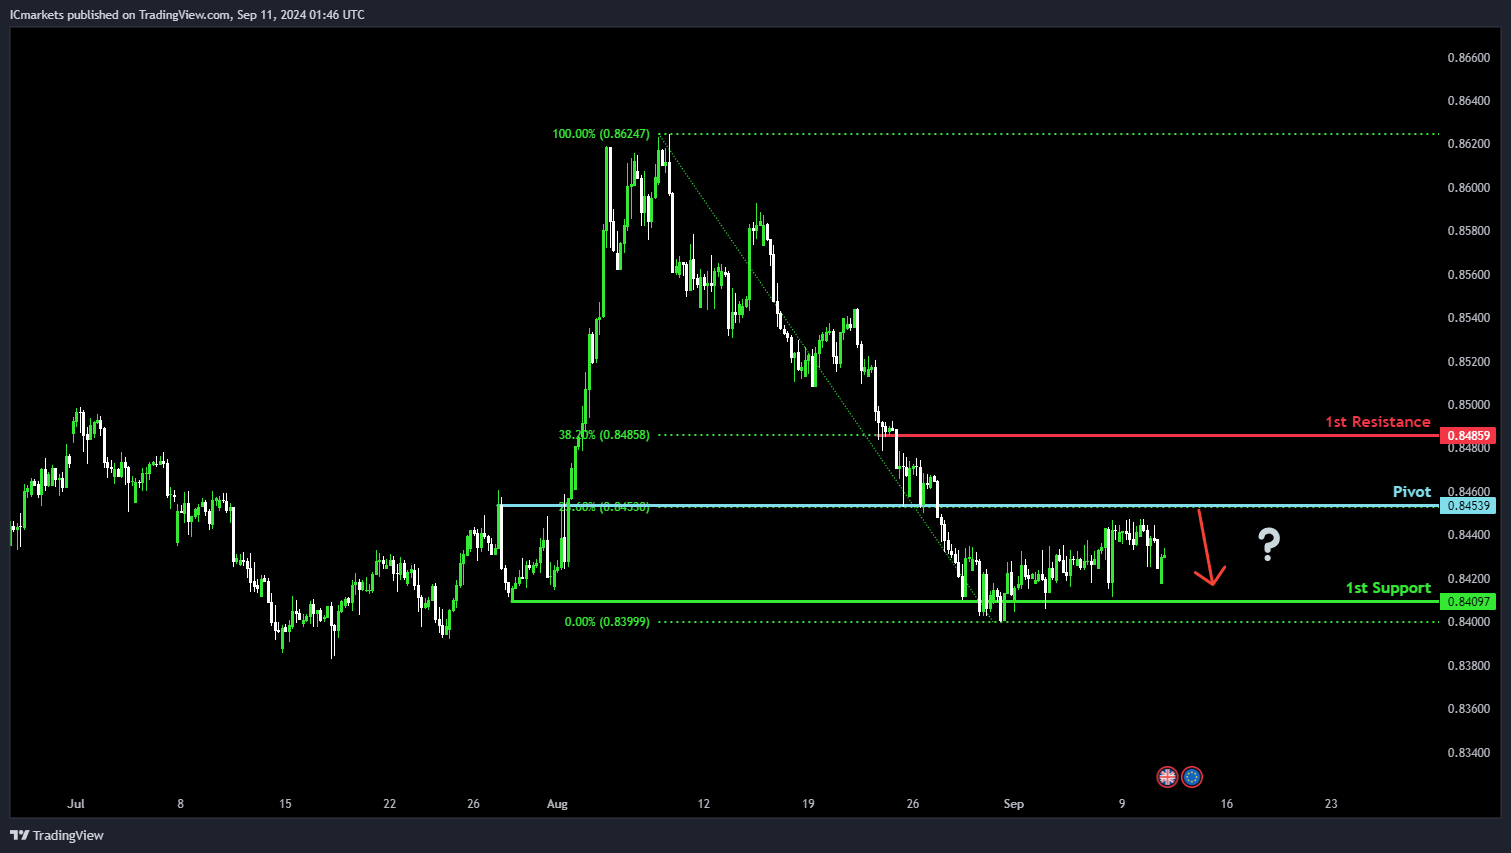
EUR/GBP:
Potential Direction: Bearish
Overall momentum of the chart: Bearish
Price could potentially make a bearish reaction off the pivot and drop to 1st support.
Pivot: 0.8453
Supporting reasons: Identified as pullback support, reinforced by the 23.6% Fibonacci Retracement, indicating a potential area where the price might stall before continuing downward.
1st support: 0.8409
Supporting reasons: Marked as a multi swing low support, suggesting a significant area where previous declines have found a buying interest.
1st resistance: 0.8485
Supporting reasons: Recognized as pullback resistance, supported by the 38.2% Fibonacci Retracement, indicating a potential level where the price may face selling pressure if it retraces upward.
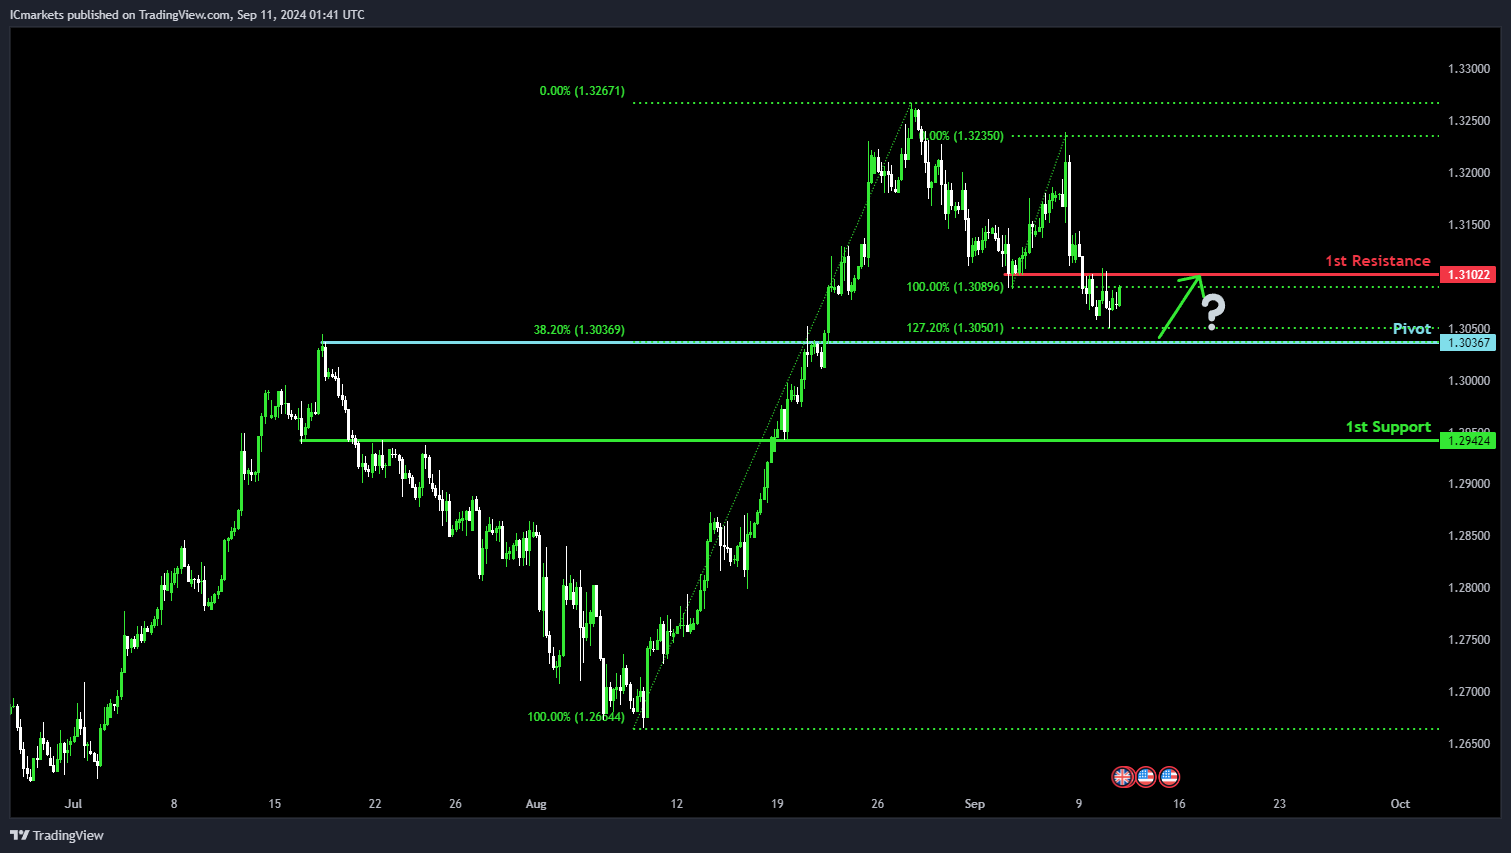
GBP/USD:
Potential Direction: Bullish
Overall momentum of the chart: Bullish
Price could potentially make a bullish bounce off the pivot and head towards 1st resistance.
Pivot: 1.30236
Supporting reasons: Pullback support, aligned with the 38.20% Fibonacci Retracement, suggesting a key level where price may find buying interest.
1st support: 1.2942
Supporting reasons: Pullback support, indicating a potential level where price might prevent further declines.
1st resistance: 1.3102
Supporting reasons: an overlap resistance, suggesting a key level where price may face selling pressure during an upward move.
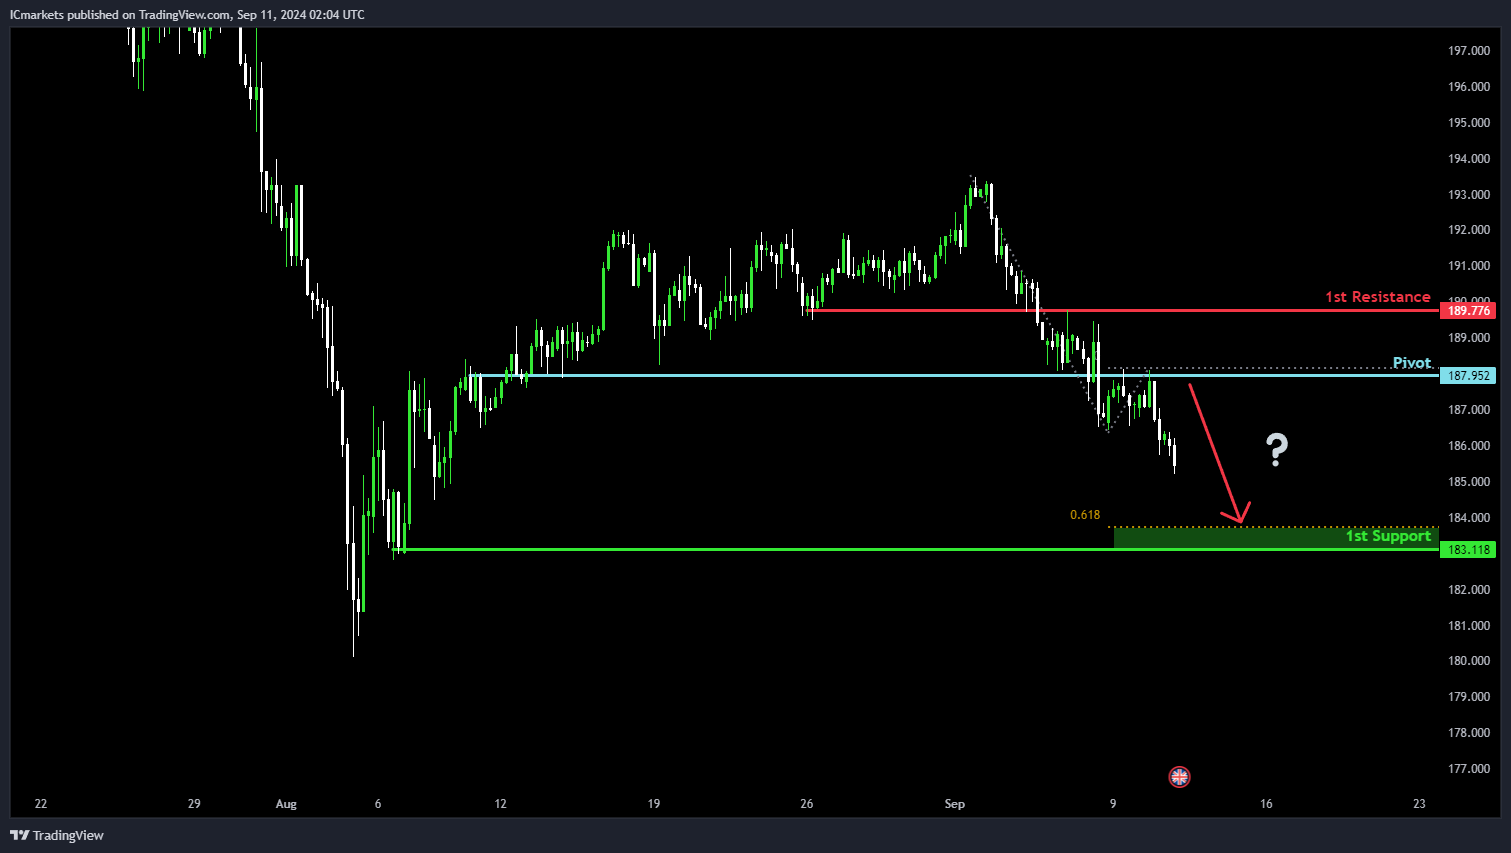
GBP/JPY:
Potential Direction: Bearish
Overall momentum of the chart: Bearish
Price could potentially make a bearish continuation towards 1st support.
Pivot: 187.95
Supporting reasons: an overlap resistance, aligned with the 23.60% Fibonacci Retracement, indicating a key level where price might face selling pressure.
1st support: 183.11
Supporting reasons: swing low support, indicating a potential level where price might find buying interest to prevent further declines.
1st resistance: 189.77
Supporting reasons: An overlap resistance, aligned with the 50% Fibonacci Retracement, suggesting a potential area where price may face resistance during an upward move.
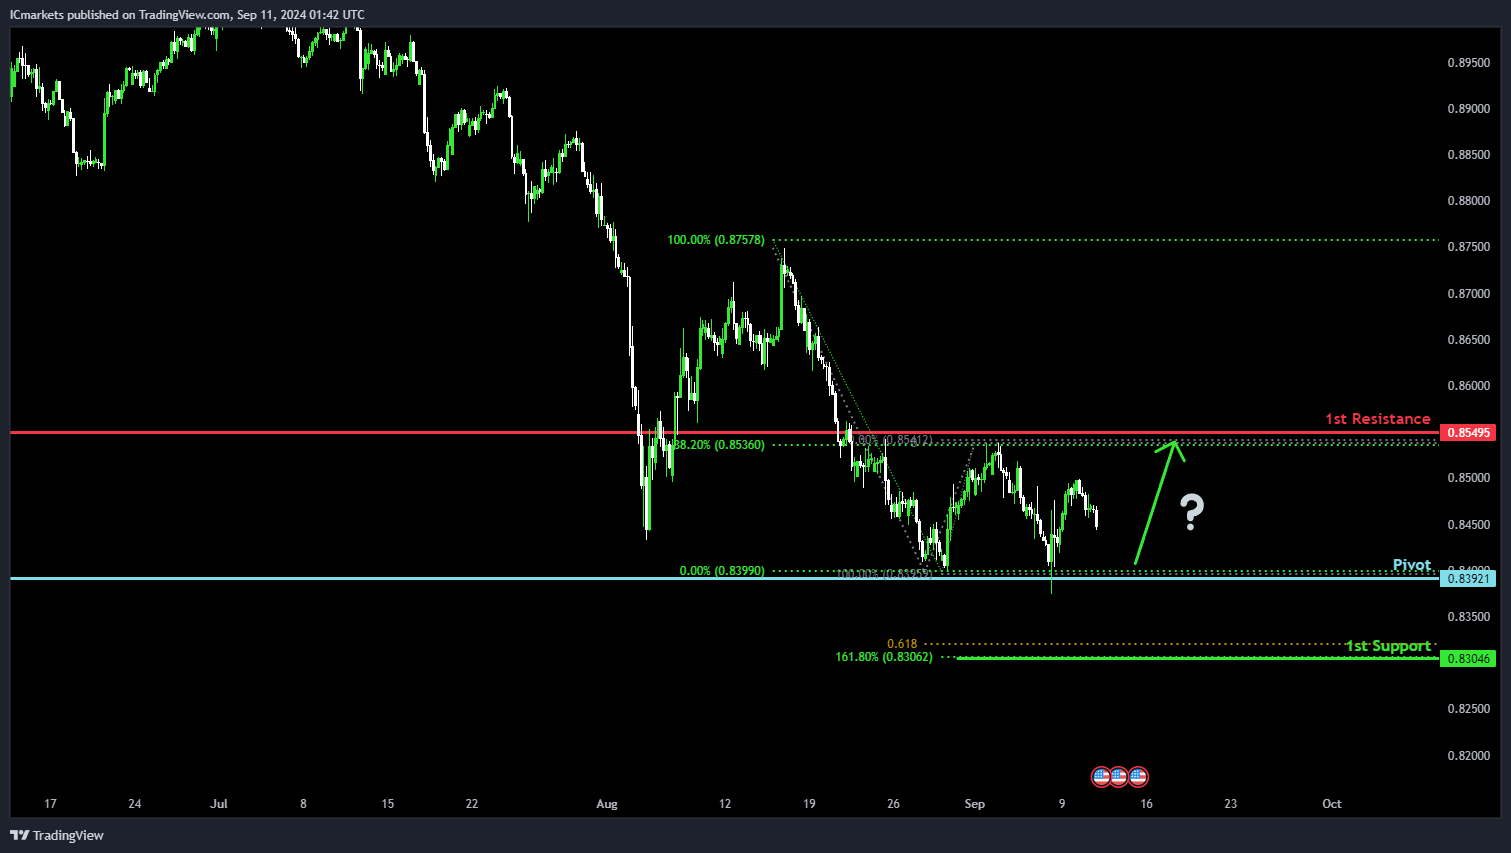
USD/CHF:
Potential Direction: Bullish
Overall momentum of the chart: Bearish
Price could potentially make a bullish bounce off the pivot and head towards 1st resistance.
Pivot: 0.8392
Supporting reasons: Multi-swing low support, suggesting a key level where price might bounce back.
1st support: 0.8304
Supporting reasons: Aligned with the 61.80% Fibonacci Projection and 161.80% Fibonacci Extension, indicating Fibonacci confluence where price might find support.
1st resistance: 0.8549
Supporting reasons: An overlap resistance, aligned with the 38.20% Fibonacci Retracement, suggesting a key level where price may face selling pressure during an upward move.
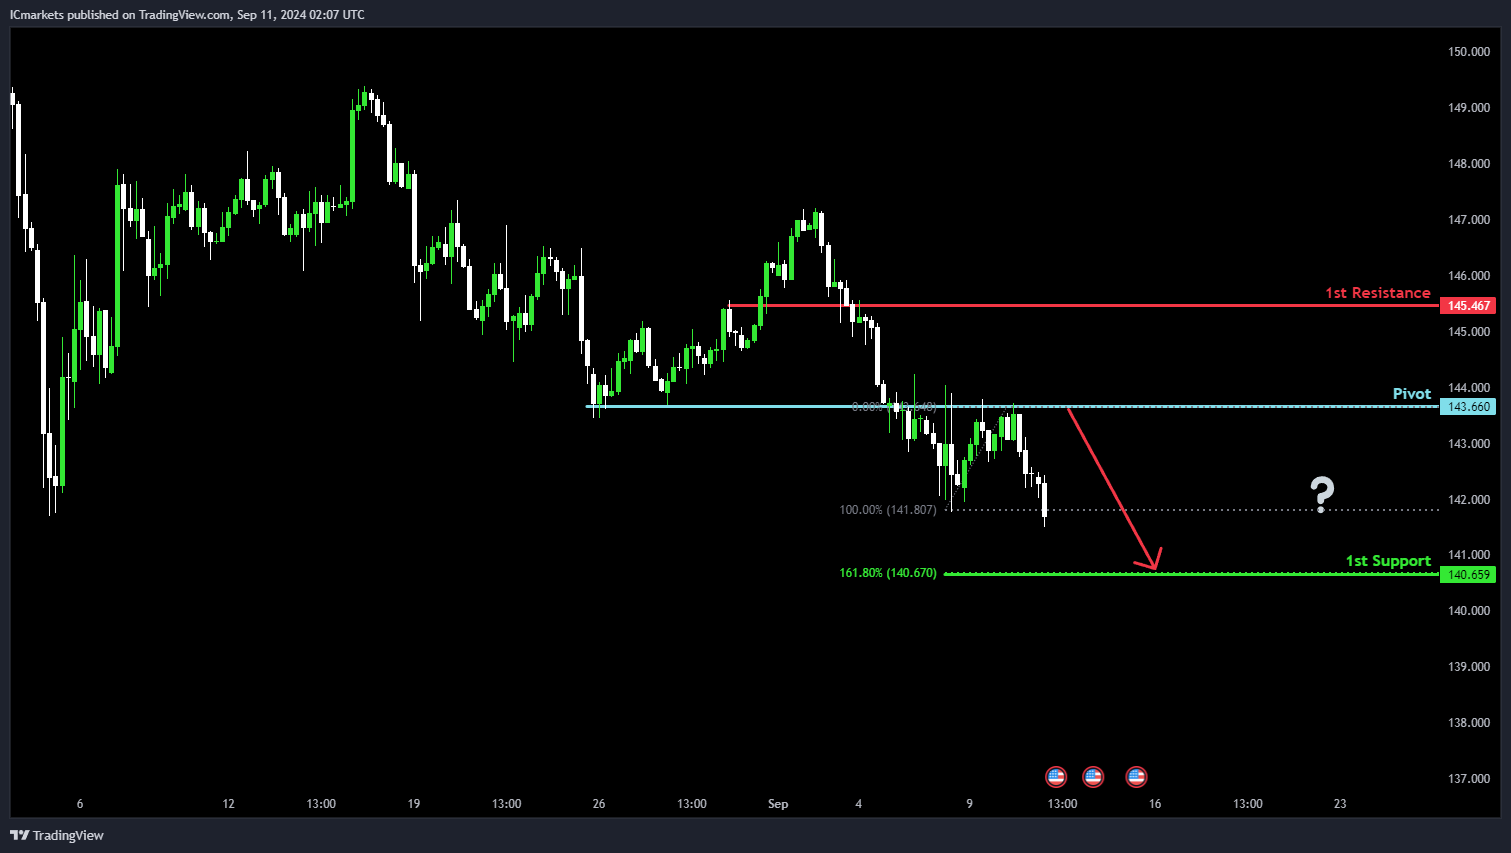
USD/JPY:
Potential Direction: Bearish
Overall momentum of the chart: Bearish
Price could potentially make a bearish continuation towards 1st support.
Pivot: 143.66
Supporting reasons: An overlap resistance, indicating a level where price might face resistance and potentially reverse.
1st support: 140.65
Supporting reasons: Aligned with the 161.80% Fibonacci Extension, suggesting a potential level where price might find strong support.
1st resistance: 145.46
Supporting reasons: An overlap resistance, indicating a potential level where price may encounter resistance during an upward move.
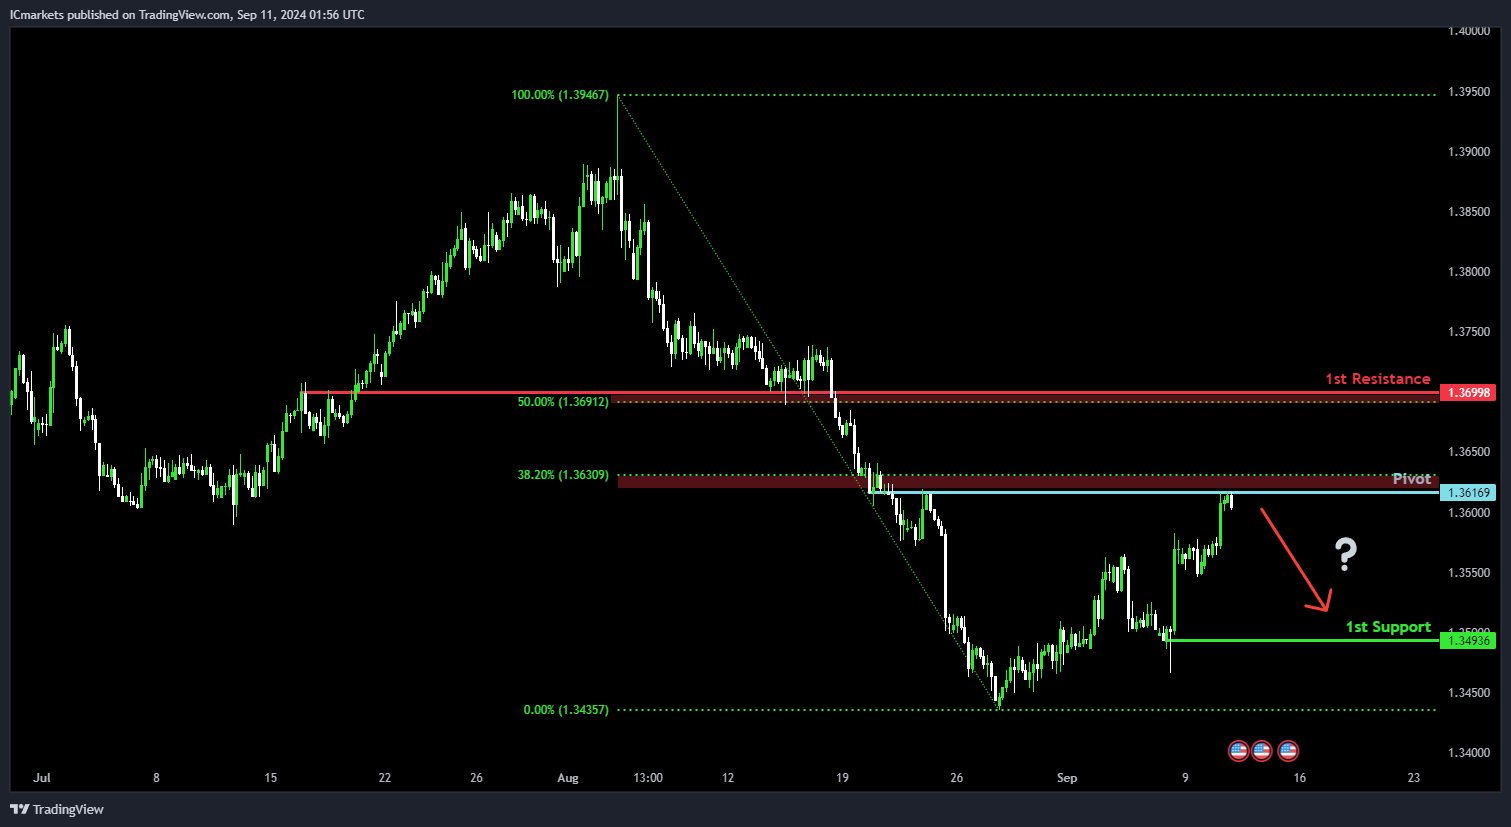
USD/CAD:
Potential Direction: Bearish
Overall momentum of the chart: Neutral
Price has made a bearish reversal off the pivot and could potentially fall towards the 1st support.
Pivot: 1.3616
Supporting reasons: Identified as an overlap resistance that aligns close to a 38.2% Fibonacci retracement, suggesting a potential area where selling pressures could intensify.
1st support: 1.3493
Supporting reasons: Identified as a swing-low support, indicating a key level where price has found support recently.
1st resistance: 1.3699
Supporting reasons: Identified as an overlap resistance that aligns close to a 50% Fibonacci retracement, indicating a potential area that could halt any further upward movement.
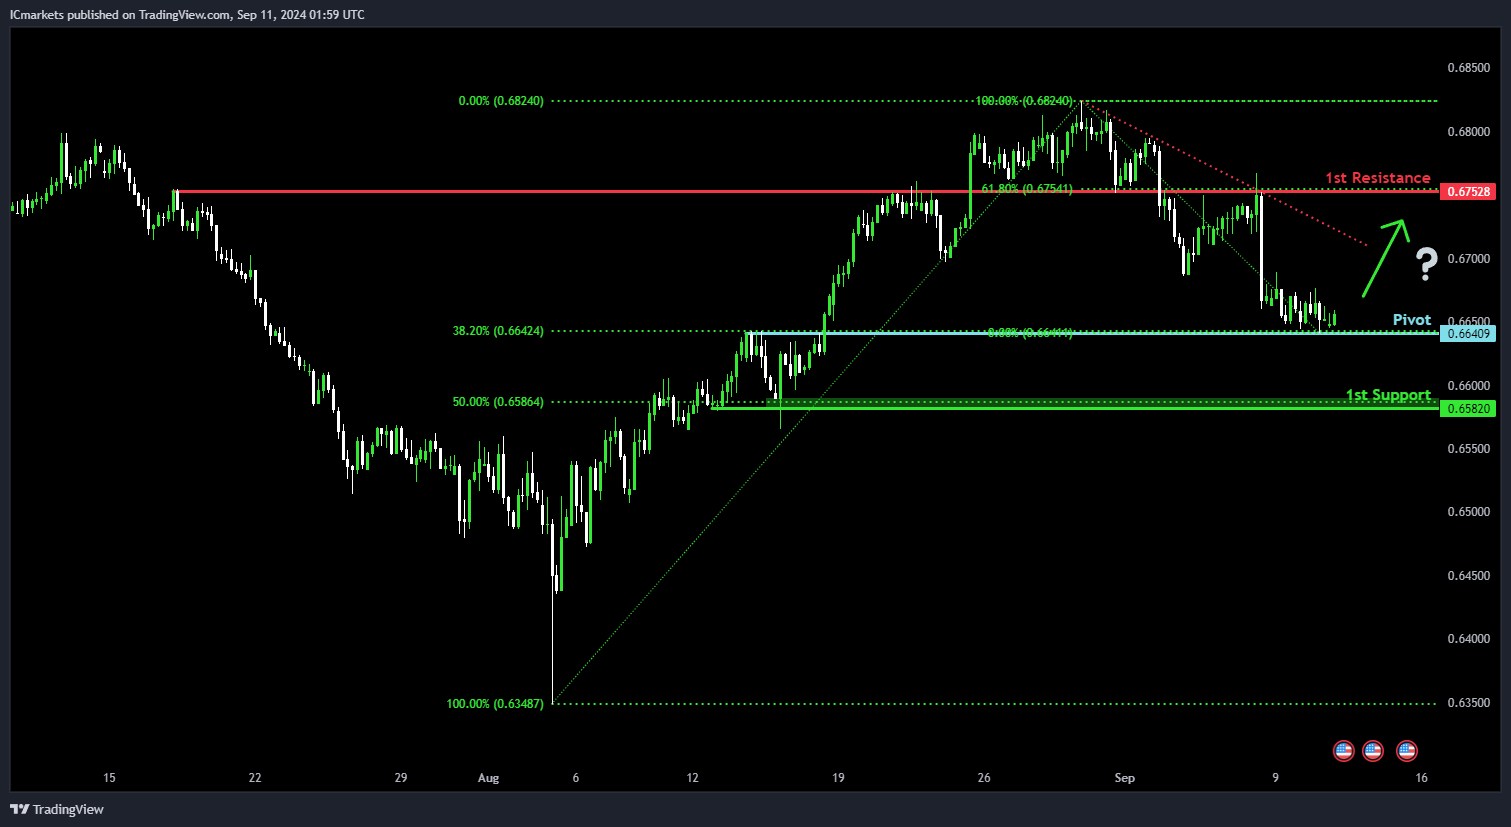
AUD/USD:
Potential Direction: Bullish
Overall momentum of the chart: Bearish
Price has made a bullish bounce off the pivot and could potentially rise towards the 1st resistance.
Pivot: 0.6640
Supporting reasons: Identified as an overlap support that aligns with a 38.2% Fibonacci retracement, suggesting a potential level where buying interests could pick up to stage a minor rebound.
1st support: 0.6582
Supporting reasons: Identified as a pullback support that aligns close to a 50% Fibonacci retracement, indicating a key level where price has found support in the past.
1st resistance: 0.6752
Supporting reasons: Identified as an overlap resistance that aligns with a 61.8% Fibonacci retracement, indicating a potential area that could halt any further upward movement.
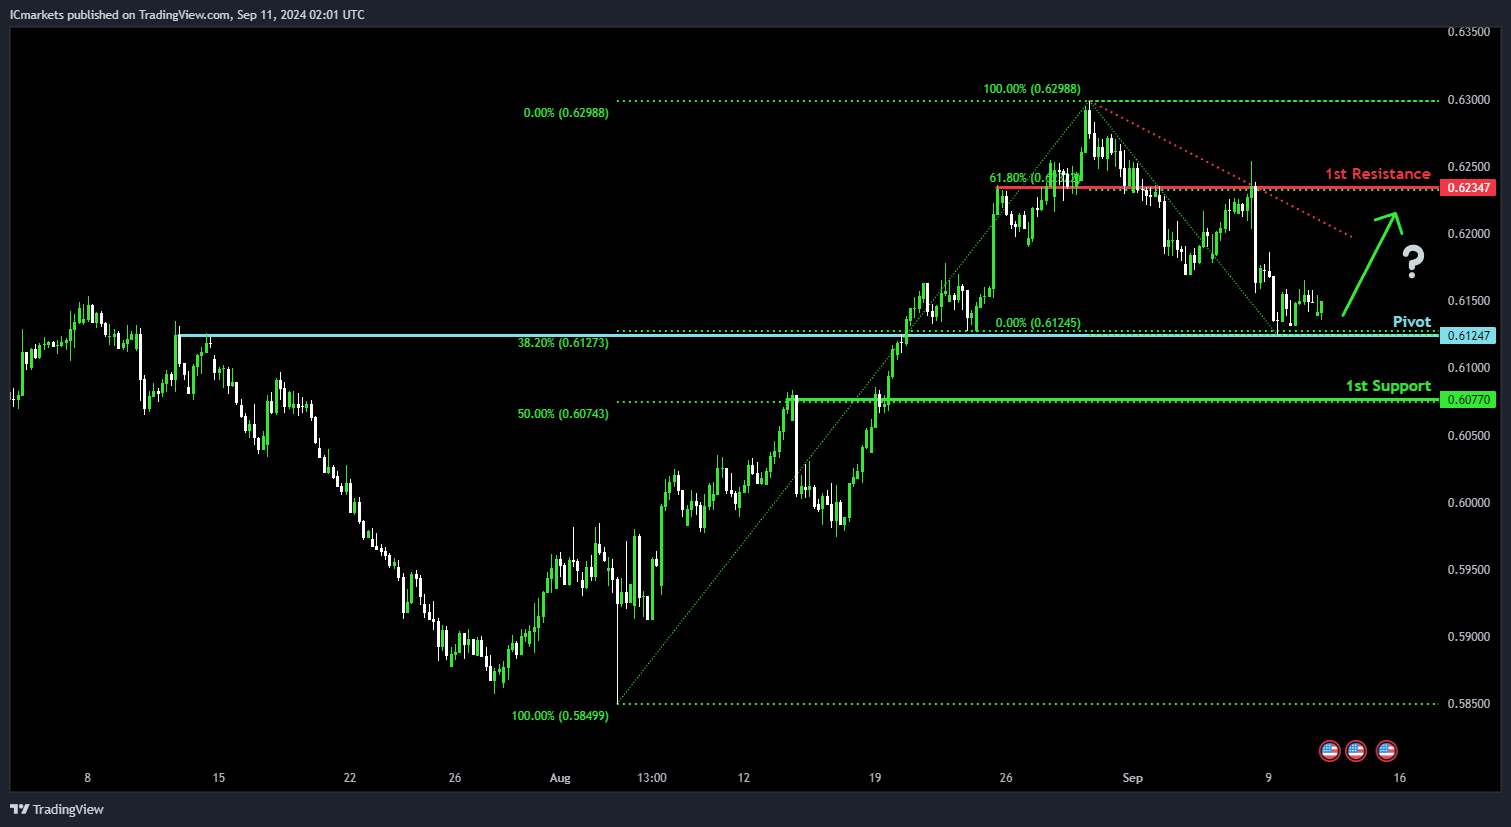
NZD/USD
Potential Direction: Bullish
Overall momentum of the chart: Bearish
Price has made a bullish bounce off the pivot and could potentially rise towards the 1st resistance.
Pivot: 0.6124
Supporting reasons: Identified as an overlap support that aligns with a 38.2% Fibonacci retracement, suggesting a potential level where buying interests could pick up to stage a minor rebound.
1st support: 0.6077
Supporting reasons: Identified as an overlap support that aligns with a 50% Fibonacci retracement, indicating a potential level where price has found support in the past.
1st resistance: 0.6234
Supporting reasons: Identified as an overlap resistance that aligns with a 61.8% Fibonacci retracement, indicating a potential area that could halt any further upward movement.
US30 (DJIA):
Potential Direction: Bullish
Overall momentum of the chart: Bearish
Price could fall towards the pivot and potentially make a bullish bounce off this level to rise towards the 1st resistance.
Pivot: 40,202.56
Supporting reasons: Identified as a swing-low support, suggesting a potential level where buying interests could pick up to stage a minor rebound.
1st support: 39,944.51
Supporting reasons: Identified as a pullback support that aligns close to a 50% Fibonacci retracement, indicating a potential level where price could find support.
1st resistance: 41,056.42
Supporting reasons: Identified as a pullback resistance that aligns with a 61.8% Fibonacci retracement, indicating a potential area that could halt any further upward movement. The presence of a descending trendline and the bearish Ichimoku Cloud add further significance to the strength of this resistance zone.

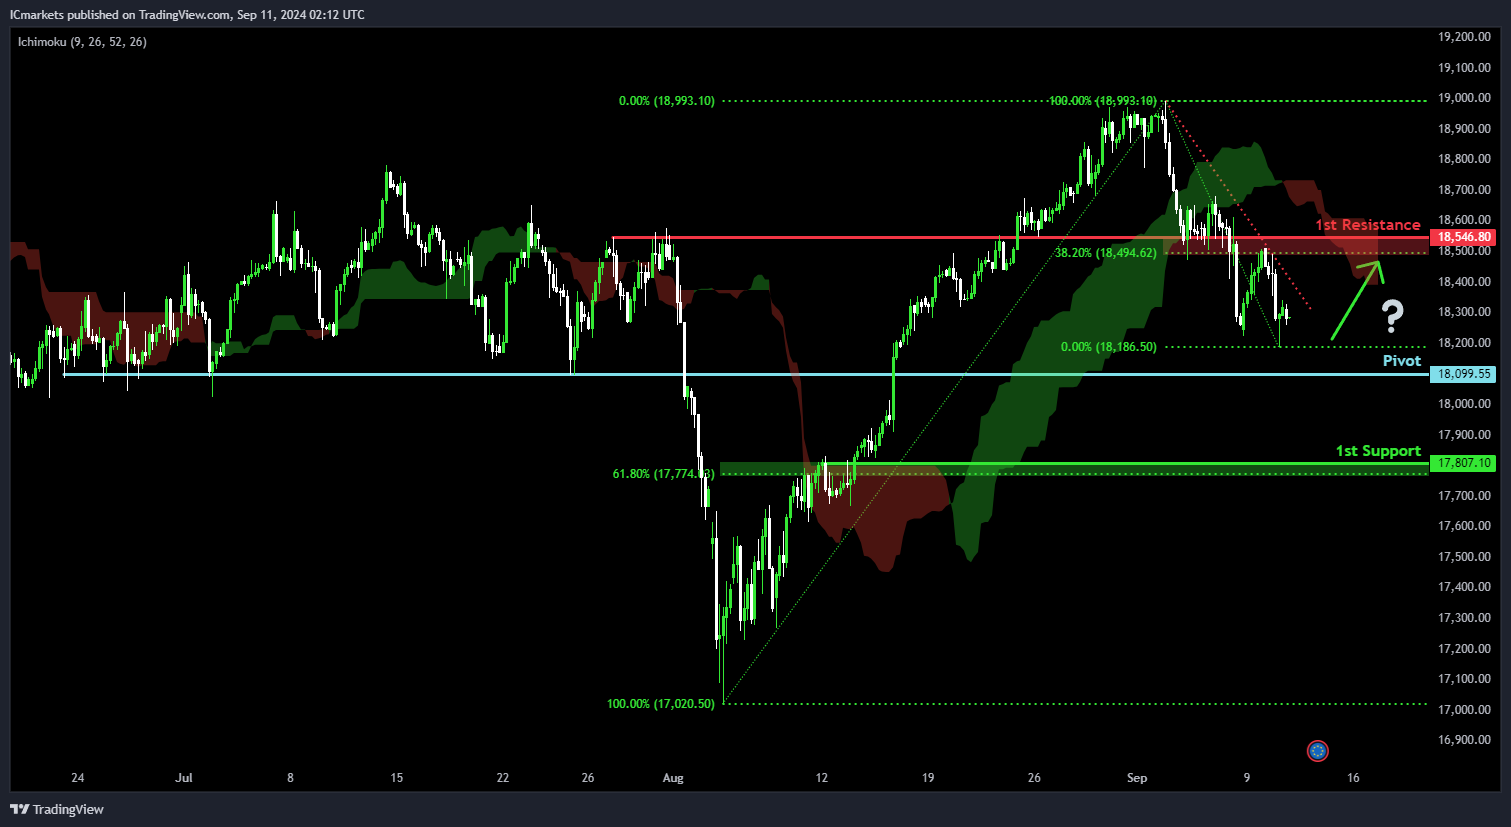
DE40 (DAX):
Potential Direction: Bullish
Overall momentum of the chart: Bearish
Price could fall towards the pivot and potentially make a bullish bounce off this level to rise towards the 1st resistance.
Pivot: 18,099.55
Supporting reasons: Identified as a multi-swing-low support, suggesting a potential level where buying interests could pick up to stage a minor rebound.
1st support: 17,801.10
Supporting reasons: Identified as an overlap support that aligns close to a 61.8% Fibonacci retracement, indicating a key level where price could find support.
1st resistance: 18,546.80
Supporting reasons: Identified as an overlap resistance that aligns close to a 38.2% Fibonacci retracement, indicating a potential area that could halt any further upward movement. The presence of a descending trendline and the bearish Ichimoku Cloud add further significance to the strength of this resistance zone.
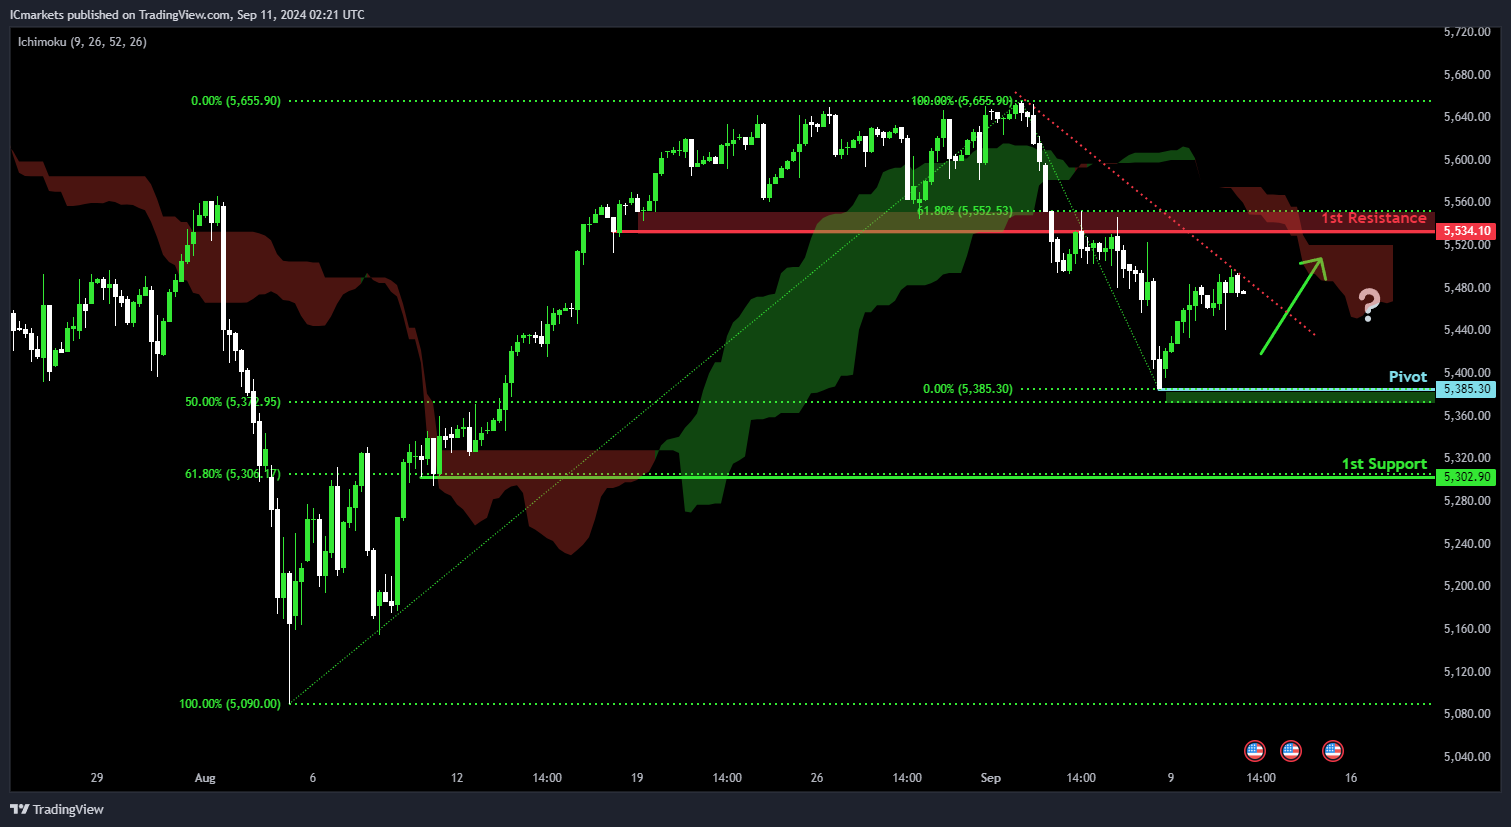
US500 (S&P 500):
Potential Direction: Bullish
Overall momentum of the chart: Bearish
Price could fall towards the pivot and potentially make a bullish bounce off this level to rise towards the 1st resistance.
Pivot: 5,385.30
Supporting reasons: Identified as a swing-low support that aligns close to a 50% Fibonacci retracement, suggesting a potential level where buying interests could pick up to stage a minor rebound.
1st support: 5,302.90
Supporting reasons: Identified as a pullback support that aligns with a 61.8% Fibonacci retracement, indicating a key level where price has found support in the past.
1st resistance: 5,534.10
Supporting reasons: Identified as an overlap resistance that aligns close to a 61.8% Fibonacci retracement, indicating a potential area that could halt any further upward movement. The presence of a descending trendline and the bearish Ichimoku Cloud add further significance to the strength of this resistance zone.
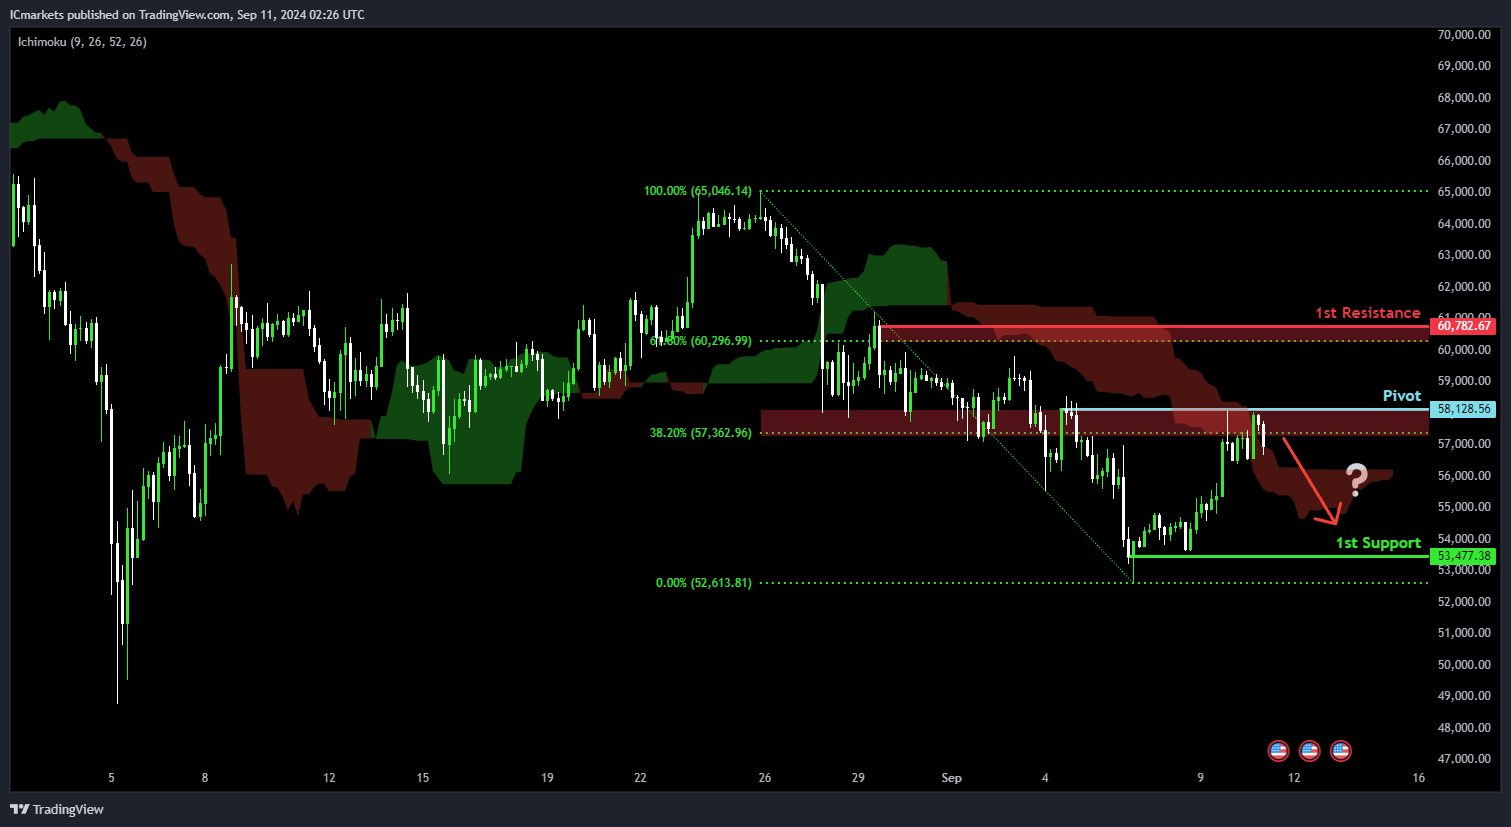
BTC/USD (Bitcoin):
Potential Direction: Bearish
Overall momentum of the chart: Bearish
Price has made a bearish reversal off the pivot and could potentially fall towards 1st support.
Pivot: 58,128.56
Supporting reasons: Identified as a pullback resistance that aligns close to a 38.2% Fibonacci retracement, suggesting a potential level where selling pressures could intensify. The presence of the bearish Ichimoku Cloud adds further significance to the strength of this resistance zone.
1st support: 53,477.38
Supporting reasons: Identified as a swing-low support, indicating a key level where price has found strong support recently.
1st resistance: 60,782.67
Supporting reasons: Identified as a swing-high resistance that aligns close to a 61.8% Fibonacci retracement, indicating a potential area that could halt any further upward movement.
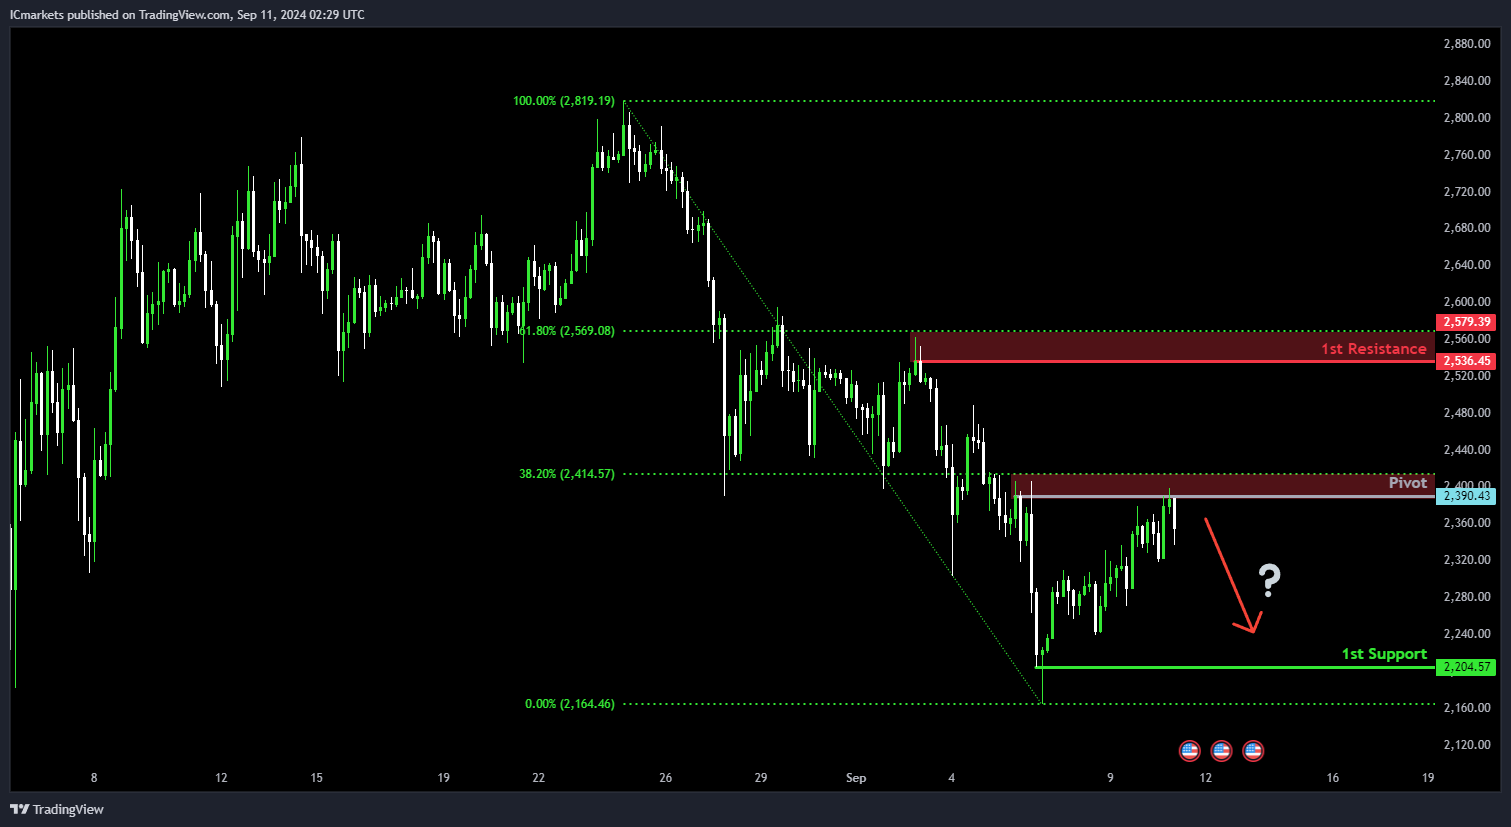
ETH/USD (Ethereum):
Potential Direction: Bearish
Overall momentum of the chart: Bearish
Price has made a bearish reversal off the pivot and could potentially fall towards 1st support.
Pivot: 2,390.43
Supporting reasons:Identified as a pullback resistance that aligns close to a 38.2% Fibonacci retracement, suggesting a potential level where selling pressures could intensify.
1st support: 2,204.57
Supporting reasons: Identified as a swing-low support, indicating a key level where price has found strong support recently.
1st resistance: 2,536.45
Supporting reasons: Identified as a swing-high resistance that aligns close to a 61.8% Fibonacci retracement, indicating a potential area that could halt any further upward movement.
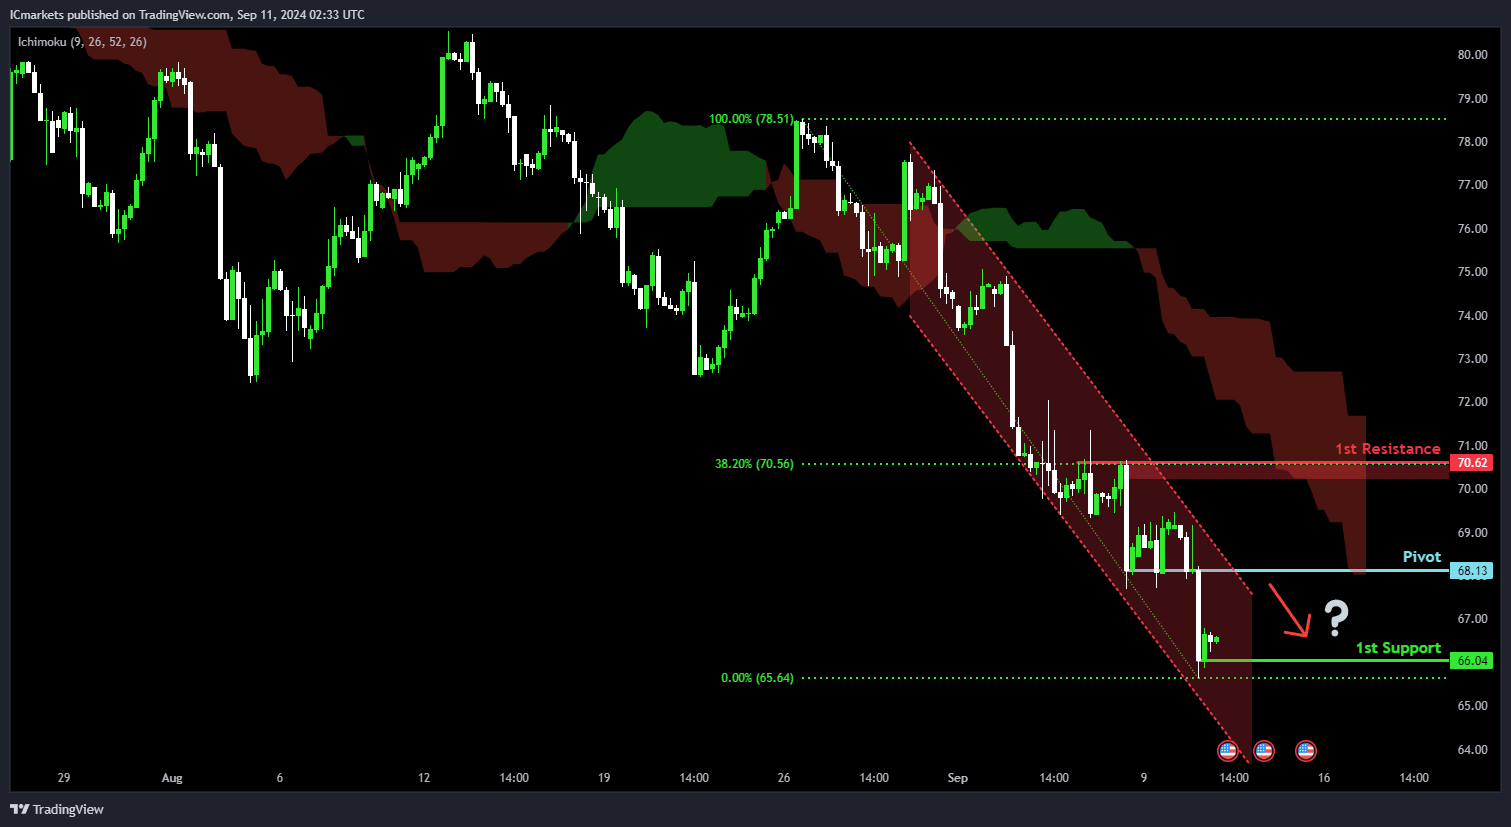
WTI/USD (Oil):
Potential Direction: Bearish
Overall momentum of the chart: Bearish
Price could rise towards the pivot and potentially make a bearish reversal off this level to drop towards the 1st support.
Pivot: 68.13
Supporting reasons: Identified as a pullback resistance, suggesting a potential level where selling pressures could intensify. The presence of the bearish channel and the bearish Ichimoku Cloud add further significance to the strength of this downtrend.
1st support: 66.04
Supporting reasons: Identified as a swing-low support, indicating a key level where price has found strong support recently.
1st resistance: 70.62
Supporting reasons: Identified as a pullback resistance that aligns with a 38.2% Fibonacci retracement, indicating a potential area that could halt any further upward movement.
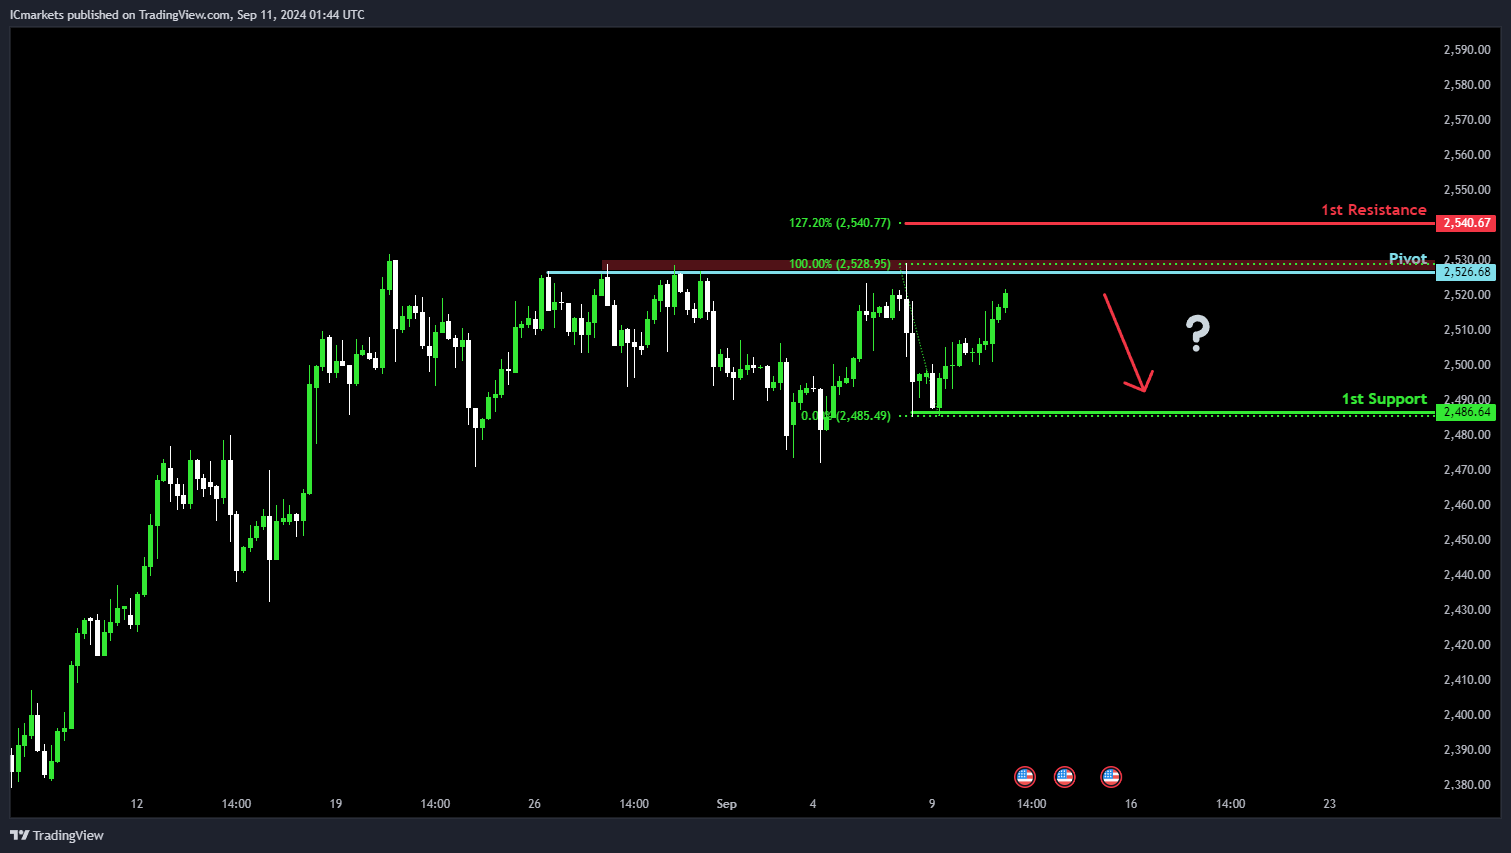
XAU/USD (GOLD):
Potential Direction: Bearish
Overall momentum of the chart: Bearish
Price could potentially make a bearish reaction off pivot and drop to 1st support.
Pivot: 2526.68
Supporting reasons: Multi-swing high resistance, suggesting a key level where price might face selling pressure.
1st support: 2486.64
Supporting reasons: Swing low support, indicating a level where price might find buying interest to prevent further declines.
1st resistance: 2540.67
Supporting reasons: Aligned with the 127.20% Fibonacci Extension, suggesting a potential level where price may encounter resistance during an upward move.
The accuracy, completeness and timeliness of the information contained on this site cannot be guaranteed. IC Trading does not warranty, guarantee or make any representations, or assume any liability regarding financial results based on the use of the information in the site.
News, views, opinions, recommendations and other information obtained from sources outside of www.ictrading.com, used in this site are believed to be reliable, but we cannot guarantee their accuracy or completeness. All such information is subject to change at any time without notice. IC Trading assumes no responsibility for the content of any linked site.
The fact that such links may exist does not indicate approval or endorsement of any material contained on any linked site. IC Trading is not liable for any harm caused by the transmission, through accessing the services or information on this site, of a computer virus, or other computer code or programming device that might be used to access, delete, damage, disable, disrupt or otherwise impede in any manner, the operation of the site or of any user’s software, hardware, data or property.