Without rules of engagement, you essentially operate on emotion instead of a well-ordered approach. This is what a trading strategy provides.
Countless Forex trading strategies are available, therefore choosing a suitable approach can be a challenge.
What’s a Trading Strategy?
You may have heard maintaining discipline is key to becoming a successful trader. Equally as important, though, is having a well-reasoned and back-tested trading strategy.
A trading strategy is an organisation of rules, covering all aspects of entering and exiting the market. However, this is all but one section of an overall trading plan. A complete plan includes things such as a money-management strategy, a detailed list of currency pairs to focus on, times to trade and risk-management measures.
Trading strategies are based on either technical analysis or fundamental analysis, or a mixture of the two, usually verified through rigorous historical and forward testing. For the purpose of this article, the spotlight will be on the technical side of the market.
Trading Style
Personality and time constraints play a key role in determining which style a trader should explore.
Four main trading styles exist:
- The scalper
- The day trader
- The swing trader
- The position trader
The scalper seeks multiple brief, profitable, opportunities in a day.
If you’re more comfortable predicting the direction a currency pair is headed in the next 10 minutes than you are forecasting direction in the next 10 days, you are perhaps a scalper. Scalping often involves lengthy periods of screen time, difficult for those who have full-time jobs.
Scalpers look to capture, in short timeframes, the first stage of a move or pattern. Further adding to this, scalpers typically have a healthy account size in order to generate worthwhile profits in small moves. As such, the scalper style may not be a suitable approach for every type of trader.
The day trader is a watered-down version of a scalper. Positions are opened during the trading day and are usually liquidated before the market close. The main objective of a day trader is to take advantage of small price movements in highly-liquid markets. The more volatile the market, the more favourable the conditions generally are for a day trader.
Comparing the scalper, who can initiate 10 or more trades in a day, Forex day trading activity may only consist of one or two trades each day, using timeframes ranging from the 5-minute up to a 15-minute scale (a scalper will likely be focused on the 1/3-minute timeframes). Day trading requires healthy patience and generally long periods at the screen in order not to miss favourable trading patterns or potential breakouts. Again, not a style one should be looking at if you have full-time obligations.
Both the scalper and day trader tend to be driven by daily results.
The swing trader is considered a patient individual, content that trades may last for several hours, a few days or even a few weeks. Unlike scalping or day trading, this style suits those who have full-time jobs and those who dislike the idea of several hours behind the screen.
Most swing traders think long term, focusing on quarterly results. According to swing traders we’ve interviewed, swing trading alleviates the pressure to make money on a daily or weekly basis.
Swing traders also tend to enjoy the analytical side of trading on slower timeframes (H1 charts and higher), using a mix of high-probability patterns and indicators.
The position trader, on the other hand, thinks long term, similar to an investor. If you’re a position trader you may look at the screen once a day. Most, however, will open their platforms only a couple of times a week to check on current trades, or execute fresh positions.
Trades in this category tend to last long periods of time (months or even years in some cases if the conviction is strong). Short-term movement carries little weight in the eyes of a position trader.
Trend Following Trading Strategies
On most price charts, it is clear price action trends.
It is trending movement trend followers look to identify and exploit.
Numerous methods exist in this category, with some standing the test of time.
Moving averages are one of the more commonly used indicators in the trend-following community. In the right hands, these tools are powerful.
The two most popular moving averages are the simple moving average (SMA) and the exponential moving average (EMA). The simple moving average is calculated by adding the closing prices of an instrument, and dividing this total by the number of time periods. This is the mean value. The exponential moving average, although similar to the simple moving average, houses a subtle difference: more weight is given to the latest data in the calculation. Accounting for this, exponential moving averages tend to react faster to price movement.
Moving averages provide a simple, yet effective, way of measuring trend. At its most basic, should the instrument trade beneath a selected moving average, this signals the primary uptrend may be weakening and an opportunity to join a downtrend could be on the cards. The same applies to a price shift above a moving average, only here we’d be looking to join a possible uptrend, as opposed to a downtrend.
Below are typical settings traders use to engage with the market:
- 10/15-SMAs are popular with scalpers and day traders to identify short-term trends.
- 50-SMAs are typically used to gauge mid-term trends. Think the swing trader here, H1 and H4 timeframes.
- The 200-SMA is favoured among longer-term traders. Think position trader here.
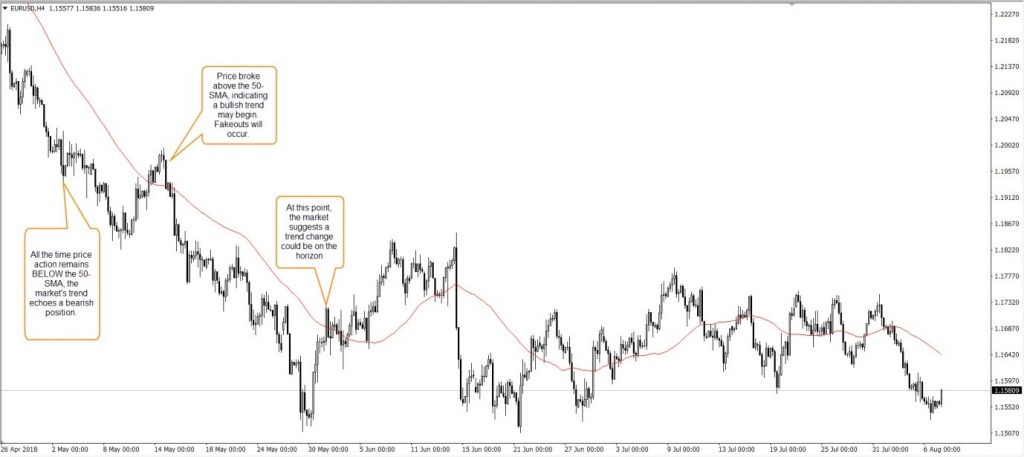
Figure A demonstrates how traders track price movement using a simple moving average on the H4 timeframe (EUR/USD), resulting in possible opportunities to trend trade. In this instance, we used the 50-SMA to gauge mid-term direction. As you can see, things quickly become tricky when the market enters a consolidation phase (right-hand side of the chart), therefore best to try and avoid these types of markets.
Figure A
Alongside trend identification, moving averages are also used as a means of entry confirmation. Having two moving averages crossover can provide reliable buy and sell signals.
Long-term traders tend to opt for a 200/50 period setting, while shorter/medium-term traders target lower settings in the range of 50/20. When the shorter-term moving average crosses above/below its longer-term counterpart; a signal to engage is presented.
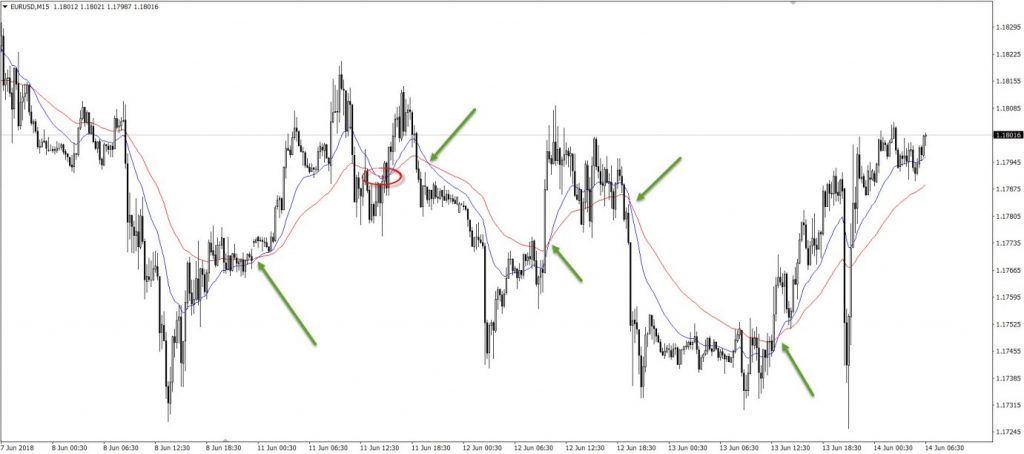
Figure B, on the EUR/USD M15 timeframe, shows a (50) simple moving average (red) along with a (20) simple moving average (blue). The green arrows denote potential entry signals where the (20) moving average crosses its longer-term equivalent. However, like all things technical in the trading domain, nothing is guaranteed to work 100% of the time. Note the fake signal to sell short, circled in red. It can get particularly frustrating when multiple back-to-back false signals are generated, normally seen in a ranging environment.
Another aspect to bear in mind is the spread between moving averages: the further apart they are, the stronger the trend is likely to be.
Figure B
Price action trend following techniques have also become popular over the years. As an uptrend progresses, resistance levels are consumed and often become active support once retested (the same for a downtrend, only support levels are consumed and used as resistances). Just to be clear, identifying key support and resistance levels takes time to master.
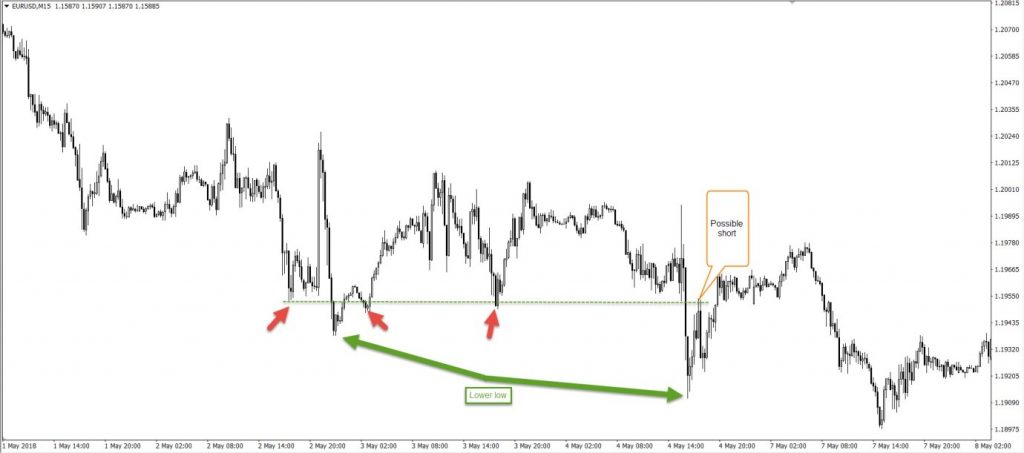
As in figure C, price respects the support-turned resistance level but failed to continue lower. Instead, the unit responded from nearby demand. This will happen at times. You have to learn to roll with it and trust your trade-management approach.
Figure C
Not a Standalone Strategy – Confluence
Trading based solely on a moving average crossover is unlikely to work in the long term. Using them with additional tools is recommended, referred to as trading confluence.
For example, imagine a scenario where you’ve managed to pin down a strong support level that boasts historical significance. Now imagine a firm break of this level taking shape that’s shortly after followed up with a retest. This, combined with price trading below your selected moving average or together with a moving average crossover, could be a strategy by and of itself. Two components are effectively working together to validate shorting opportunities – remember keeping it simple is key. Don’t make the mistake of overloading charts with indicators, this is likely to lead to analysis paralysis.
As for stop-loss placement, either beyond the support/resistance level, or beyond the moving average, are popular options. Another use a moving average offers is determining where to take profit when trailing a position. As the trade progresses and the moving average alters course, you can adjust your stop position behind the moving average as price moves in favour (a trailing stop).
The accuracy, completeness and timeliness of the information contained on this site cannot be guaranteed. IC Trading does not warranty, guarantee or make any representations, or assume any liability regarding financial results based on the use of the information in the site.
News, views, opinions, recommendations and other information obtained from sources outside of www.ictrading.com.au, used in this site are believed to be reliable, but we cannot guarantee their accuracy or completeness. All such information is subject to change at any time without notice. IC Trading assumes no responsibility for the content of any linked site.
The fact that such links may exist does not indicate approval or endorsement of any material contained on any linked site. IC Trading is not liable for any harm caused by the transmission, through accessing the services or information on this site, of a computer virus, or other computer code or programming device that might be used to access, delete, damage, disable, disrupt or otherwise impede in any manner, the operation of the site or of any user’s software, hardware, data or property.


