
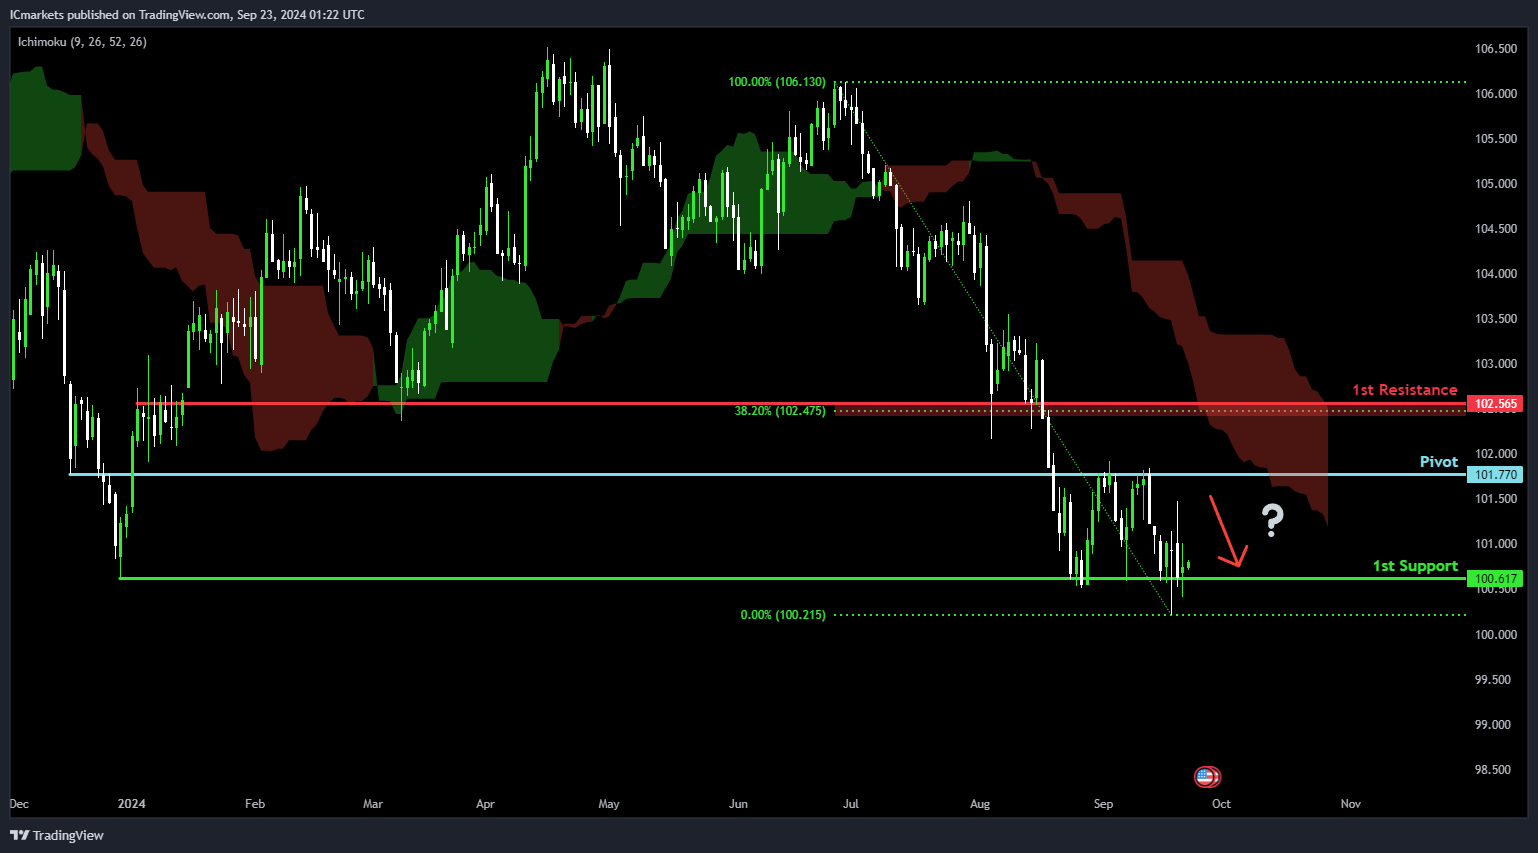
DXY (US Dollar Index):
Potential Direction: Bearish
Overall momentum of the chart: Bearish
Price could potentially make a: Bearish reaction off the pivot and drop to the 1st support.
Pivot: 101.77
Supporting reasons: An overlap resistance, suggesting this level may act as resistance where the price could face selling pressure.
1st support: 100.61
Supporting reasons: Multi-swing low support, indicating this level might provide strong support if the price moves lower.
1st resistance: 102.56
Supporting reasons: Pullback resistance with 38.20% Fibonacci Retracement, suggesting this level could act as resistance if the price attempts to rise.
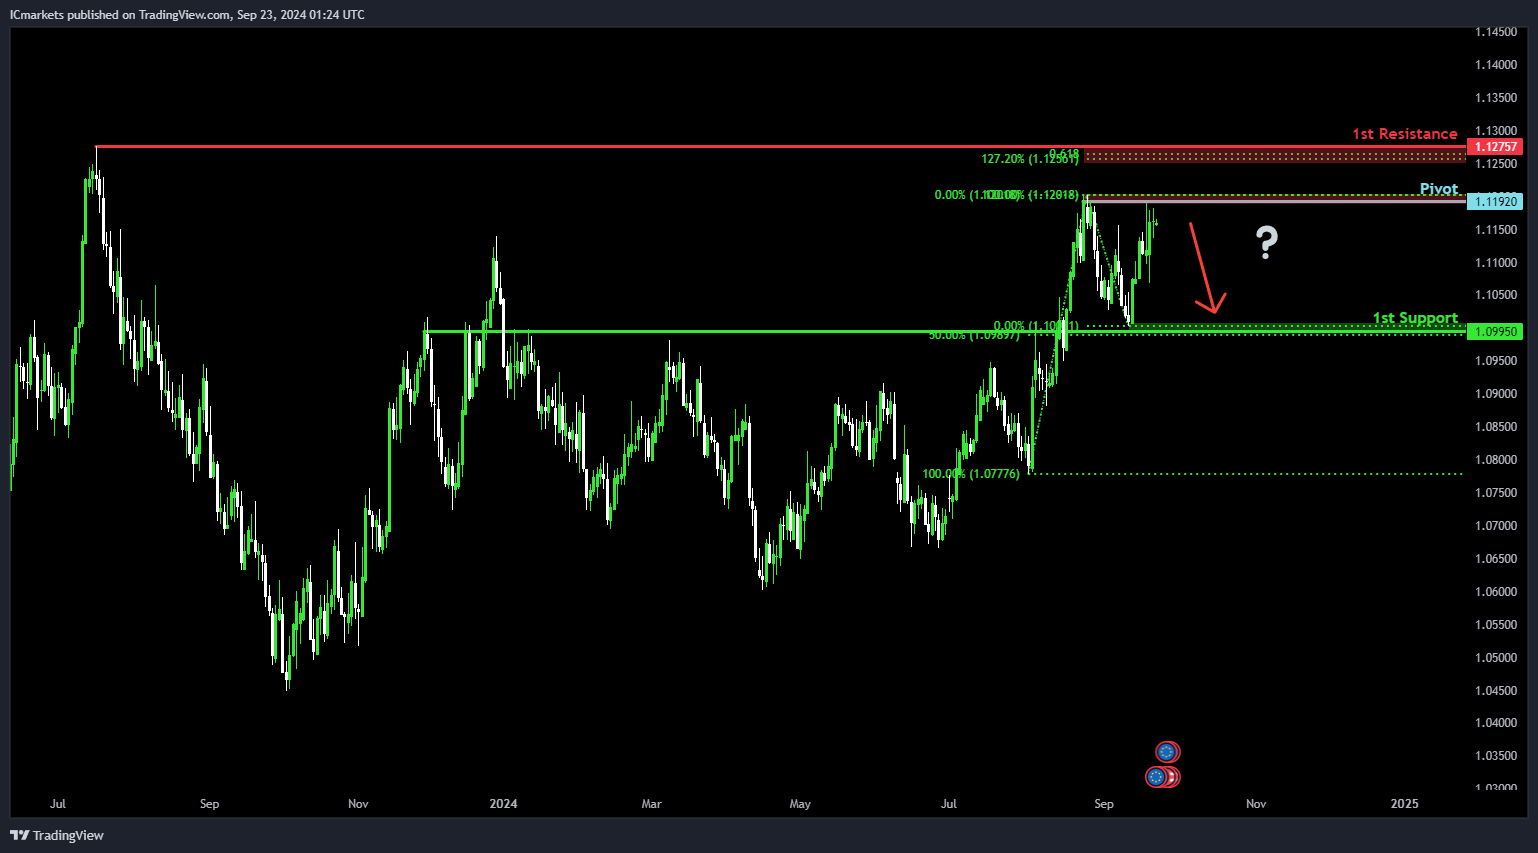
EUR/USD:
Potential Direction: Bearish
Overall momentum of the chart: Bullish
Price could potentially make a: Bearish reaction off the pivot and drop to 1st support.
Pivot: 1.1192
Supporting reasons: Multi-swing high resistance, suggesting this level could act as significant resistance if the price moves lower.
1st support: 1.1000
Supporting reasons: An overlap support with 50% Fibonacci Retracement, indicating this level may provide a point of support if the price declines.
1st resistance: 1.1275
Supporting reasons: Swing high resistance with 127.20% Fibonacci Extension and 61.80% Fibonacci Retracement, suggesting this level may face strong resistance with Fibonacci confluence.
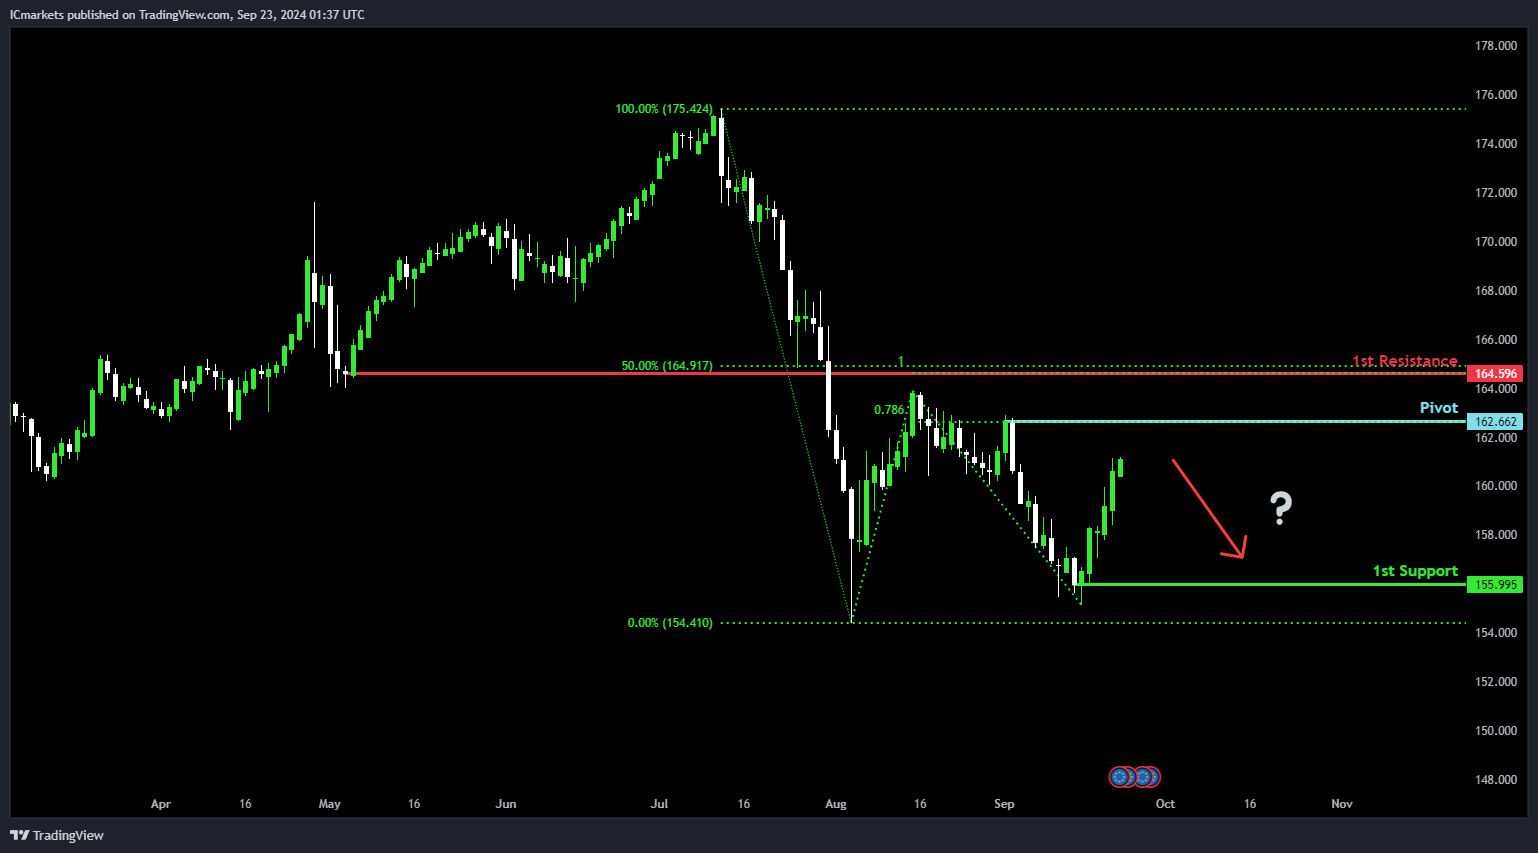
EUR/JPY:
Potential Direction: Bearish
Overall momentum of the chart: Bearish
Price could potentially make a: Bearish reaction off the pivot and drop to 1st support.
Pivot: 162.66
Supporting reasons: Swing high resistance with 78.60% Fibonacci Projection, indicating this level could act as a significant resistance point.
1st support: 155.99
Supporting reasons: Swing low support, suggesting this level may provide a strong point of support if the price declines.
1st resistance: 164.59
Supporting reasons: Pullback resistance with 50% Fibonacci Retracement and 100% Fibonacci Projection, indicating strong resistance with Fibonacci confluence.
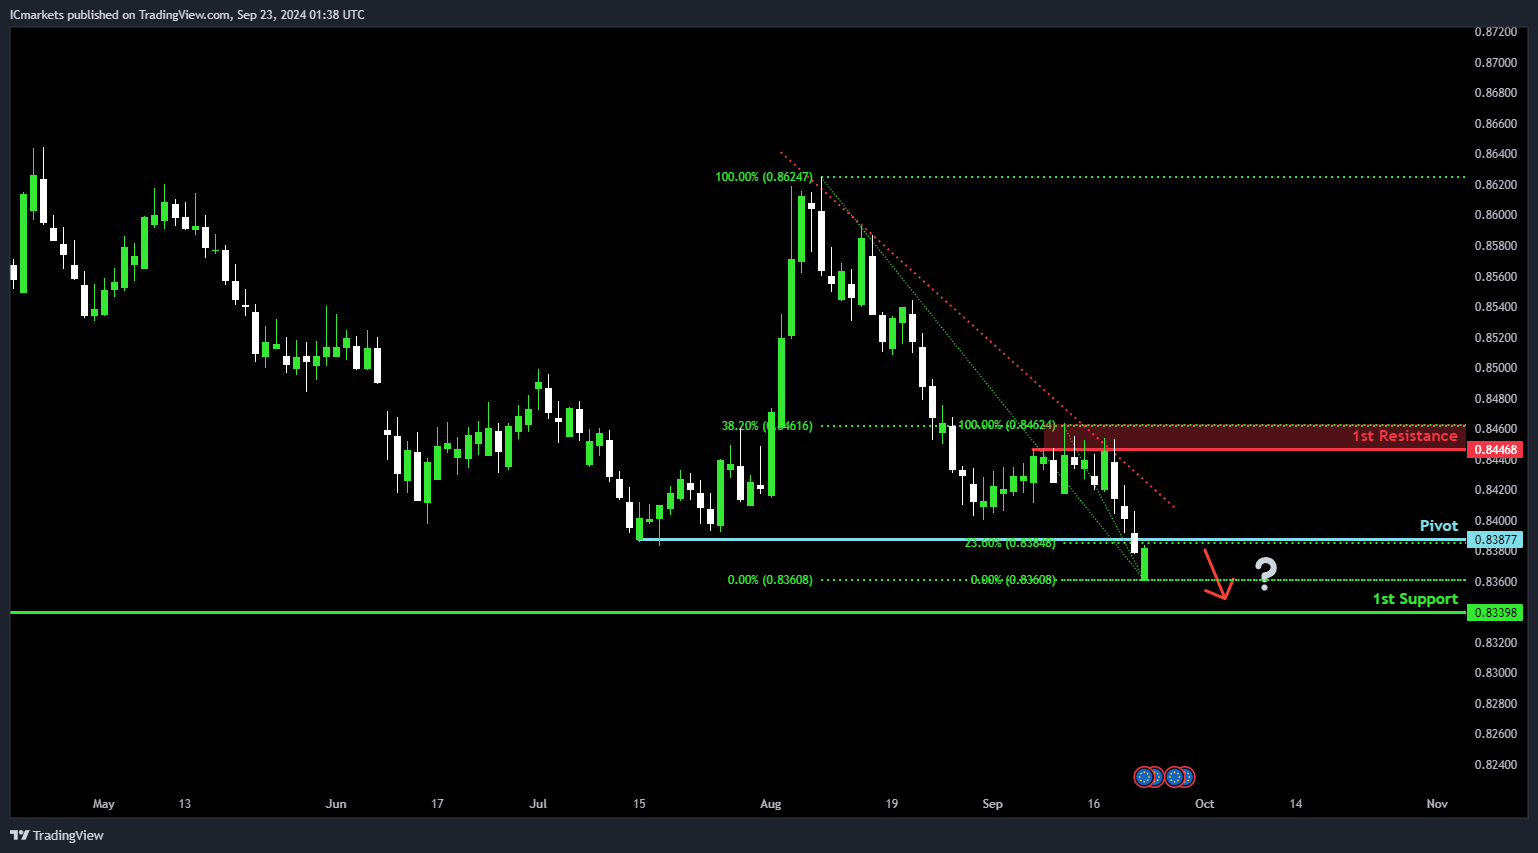
EUR/GBP:
Potential Direction: Bearish
Overall momentum of the chart: Bearish
Price could potentially make a: Bearish continuation towards 1st support.
Pivot: 0.8387
Supporting reasons: Pullback resistance, indicating this level could act as a strong resistance point.
1st support: 0.8339
Supporting reasons: Swing low support, suggesting this level might provide significant support if the price continues to decline.
1st resistance: 0.8446
Supporting reasons: Multi-swing high resistance with 38.20% Fibonacci Retracement, indicating a level where the price might face resistance if it attempts to rise.
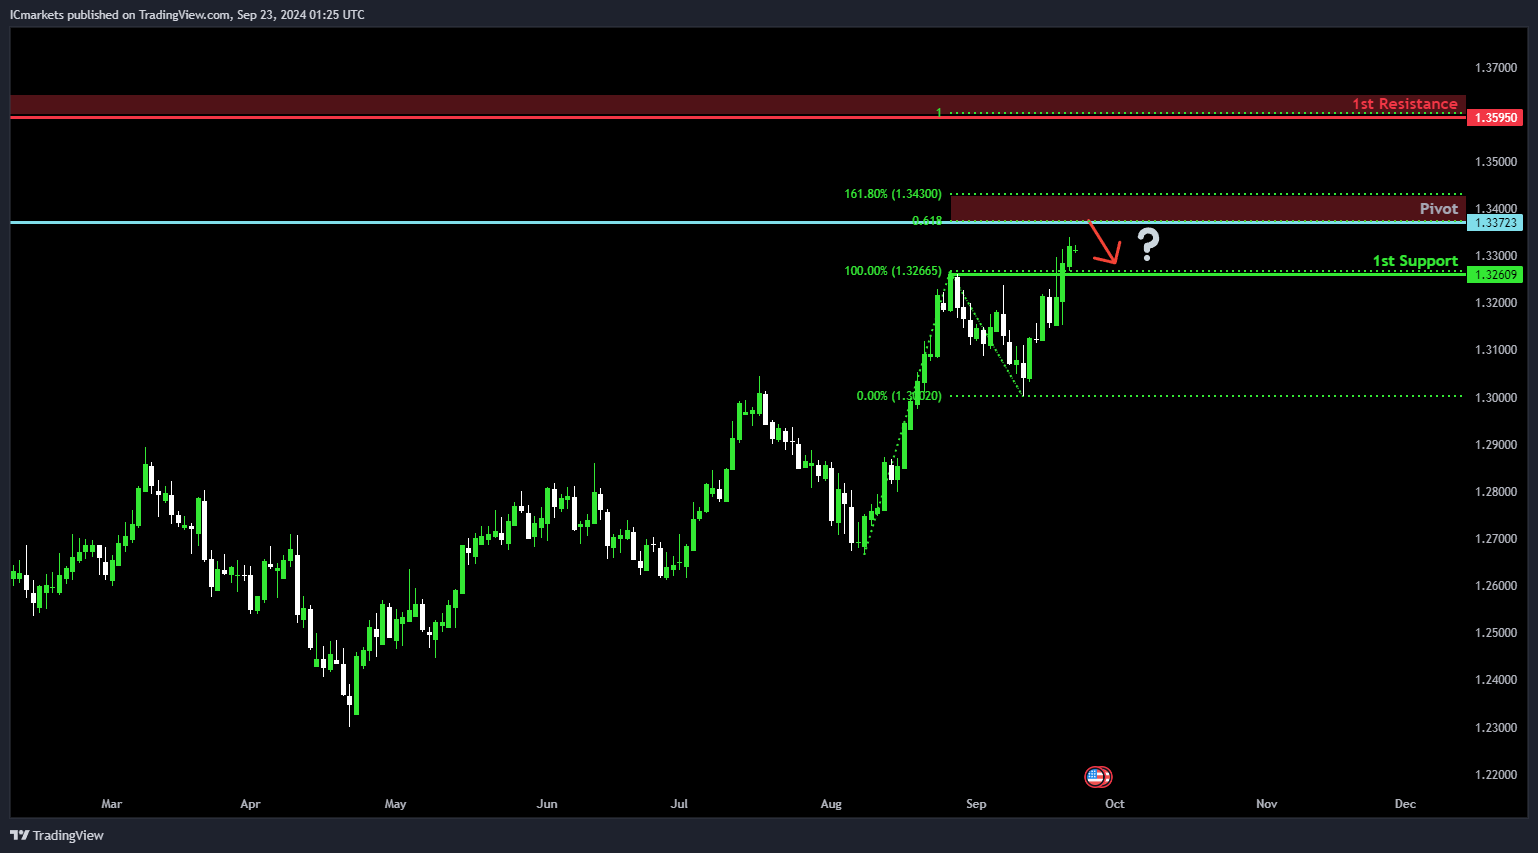
GBP/USD:
Potential Direction: Bearish
Overall momentum of the chart: Bullish
Price could potentially make a: Bearish reaction off pivot and drop to 1st support.
Pivot: 1.3372
Supporting reasons: An overlap resistance with 61.80% Fibonacci Projection and 161.80% Fibonacci Extension, indicating Fibonacci confluence at this level.
1st support: 1.3260
Supporting reasons: Pullback support, suggesting this level might provide significant support if the price declines.
1st resistance: 1.3595
Supporting reasons: Swing high resistance with 100% Fibonacci Projection, indicating a key resistance level if the price attempts to rise.
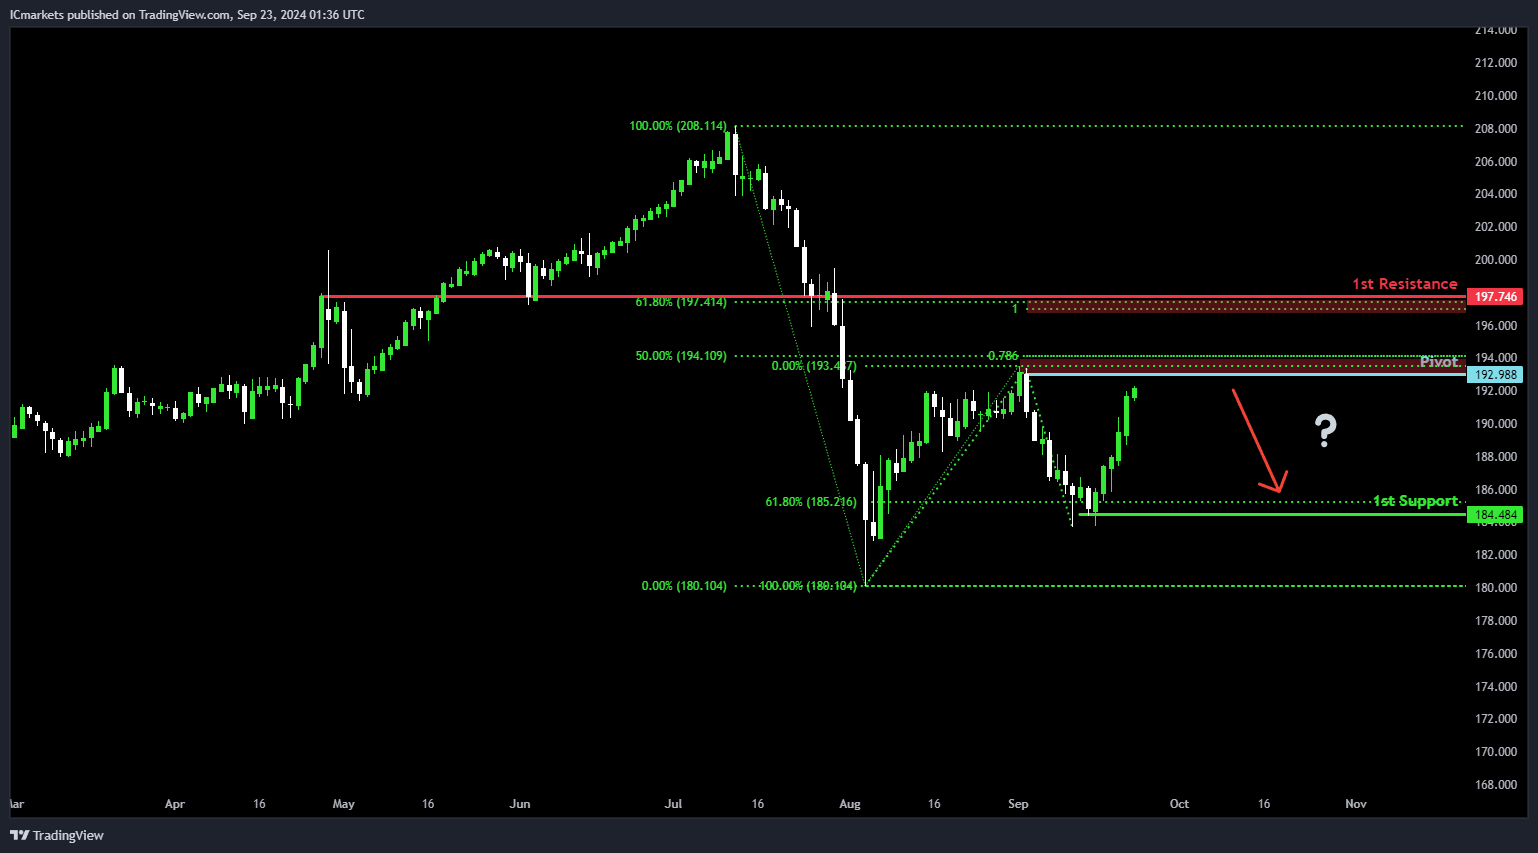
GBP/JPY:
Potential Direction: Bearish
Overall momentum of the chart: Bearish
Price could potentially make a: Bearish reaction off pivot and drop to 1st support.
Pivot: 192.98
Supporting reasons: Swing high resistance with 50% Fibonacci Retracement and 78.60% Fibonacci Projection, indicating Fibonacci confluence at this level.
1st support: 184.48
Supporting reasons: Swing low support with 61.80% Fibonacci Retracement, suggesting this level might act as significant support if the price declines.
1st resistance: 197.74
Supporting reasons: Pullback resistance with 50% Fibonacci Retracement and 100% Fibonacci Projection, indicating a strong resistance level if the price rises.
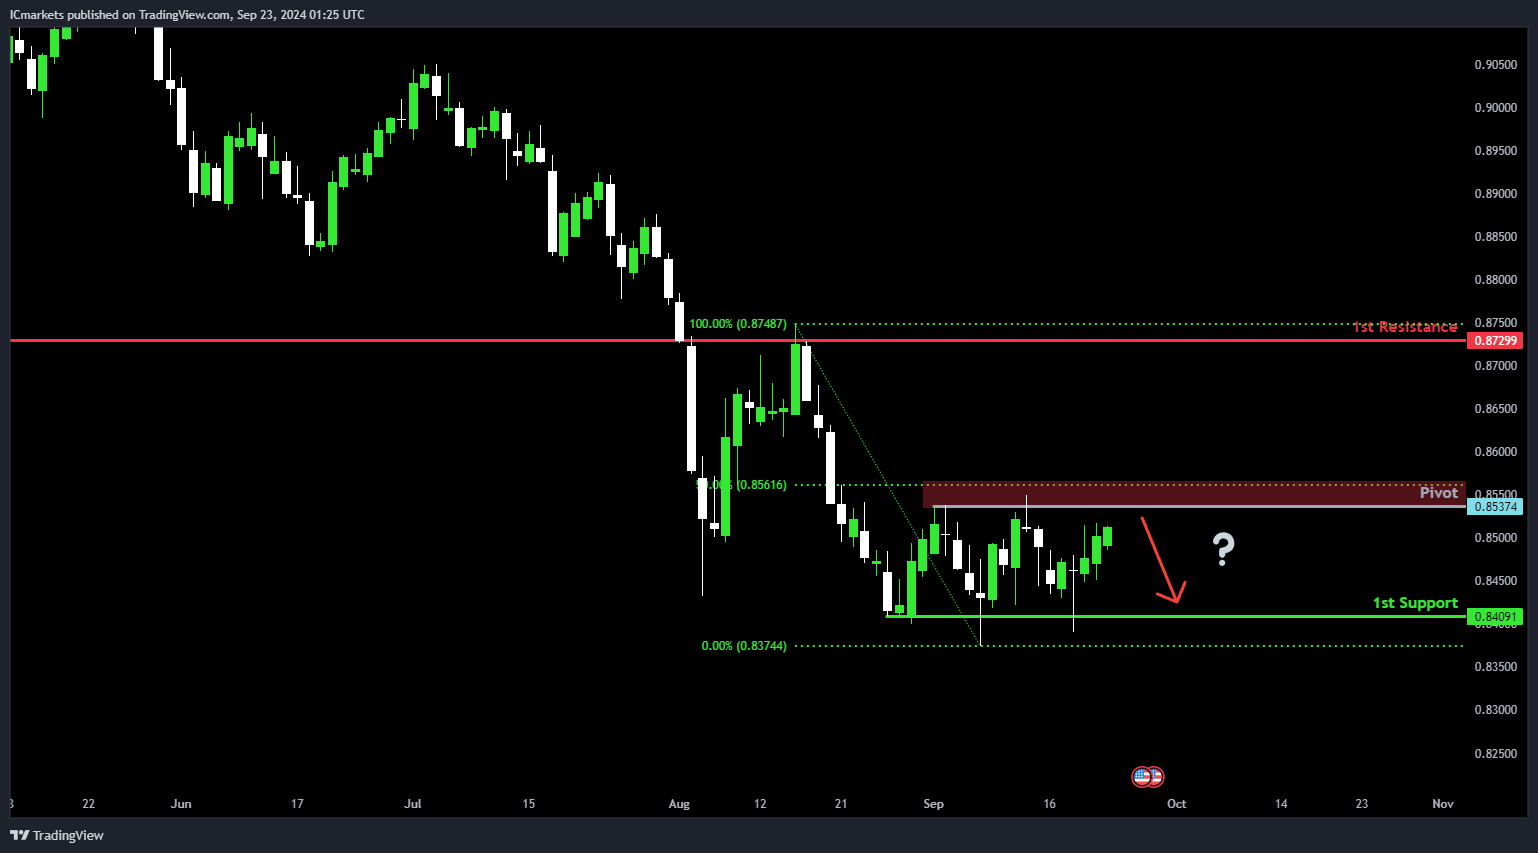
USD/CHF:
Potential Direction: Bearish
Overall momentum of the chart: Bearish
Price could potentially make a: Bearish reaction off pivot and drop to 1st support.
Pivot: 0.8537
Supporting reasons: Multi-swing high resistance, indicating this level could act as a strong resistance where the price might face selling pressure.
1st support: 0.8409
Supporting reasons: Multi-swing low support, suggesting this level might provide a significant point of support if the price moves downward.
1st resistance: 0.8729
Supporting reasons: An overlap resistance, which could act as a significant barrier if the price attempts to rise.
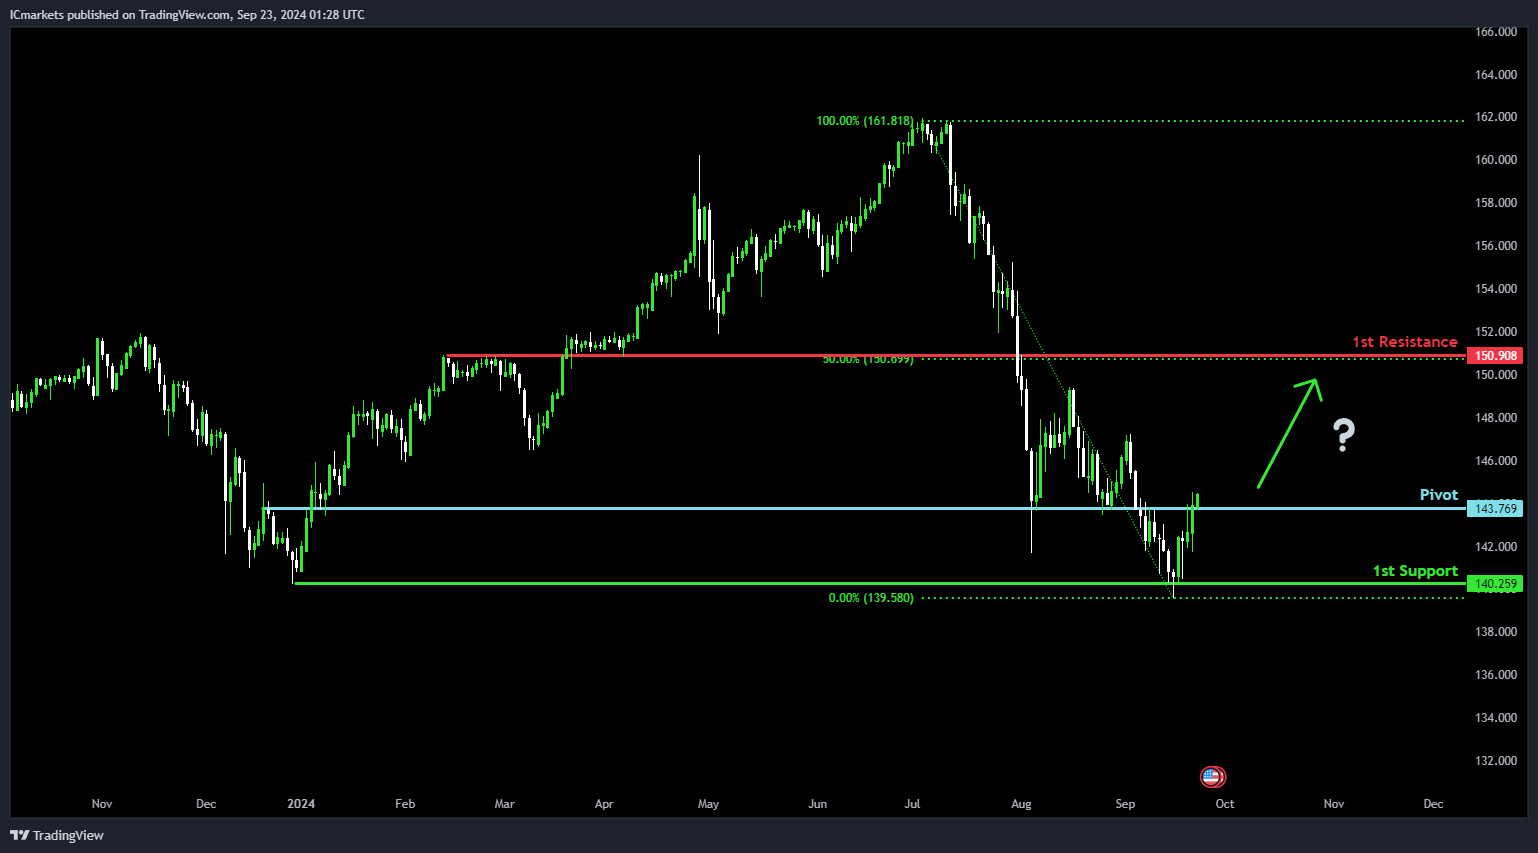
USD/JPY:
Potential Direction: Bullish
Overall momentum of the chart: Bullish
Price could potentially make a bullish break through the pivot and rise to 1st resistance.
Pivot: 143.76
Supporting reasons: Pullback support, suggesting that the price may find support at this level and potentially continue upward.
1st support: 140.25
Supporting reasons: Multi-swing low support, indicating this level might act as a significant support point if the price moves downward.
1st resistance: 150.90
Supporting reasons: Pullback resistance, which could be a key resistance level if the price continues to rise.
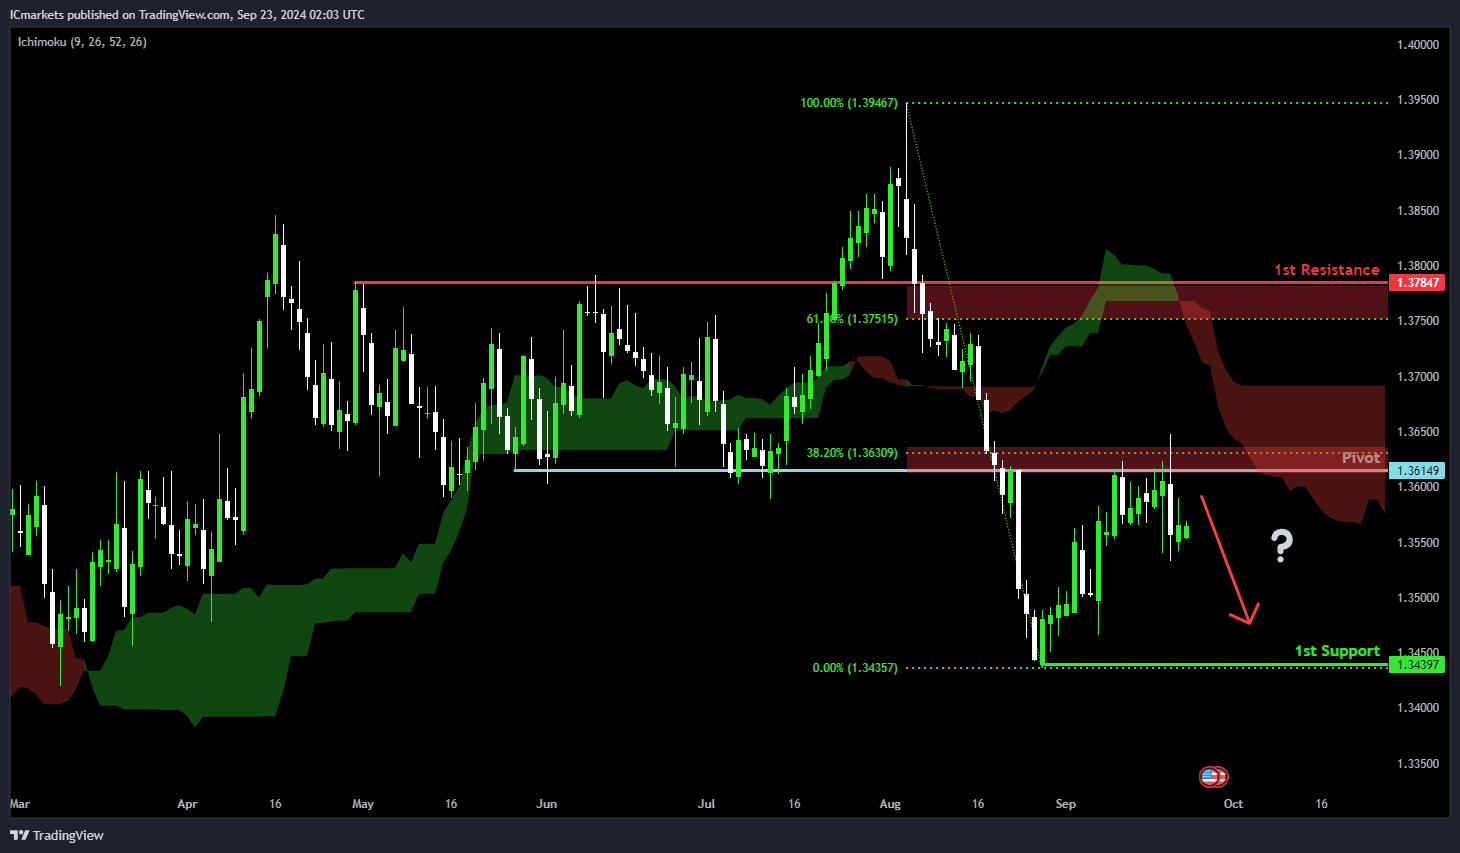
USD/CAD:
Potential Direction: Bearish
Overall momentum of the chart: Neutral
Price could rise towards the pivot and potentially make a bearish reversal off this level to fall towards the 1st support.
Pivot: 1.3614
Supporting reasons: Identified as an overlap resistance that aligns close to a 38.2% Fibonacci retracement, suggesting a potential area where selling pressures could intensify. The presence of a bearish Ichimoku Cloud adds further significance to the strength of this resistance zone.
1st support: 1.3439
Supporting reasons: Identified as a swing-low support, indicating a key level where price has found strong support at the end of August.
1st resistance: 1.3784
Supporting reasons: Identified as an overlap resistance that aligns close to a 61.8% Fibonacci retracement, indicating a potential area that could halt any further upward movement.
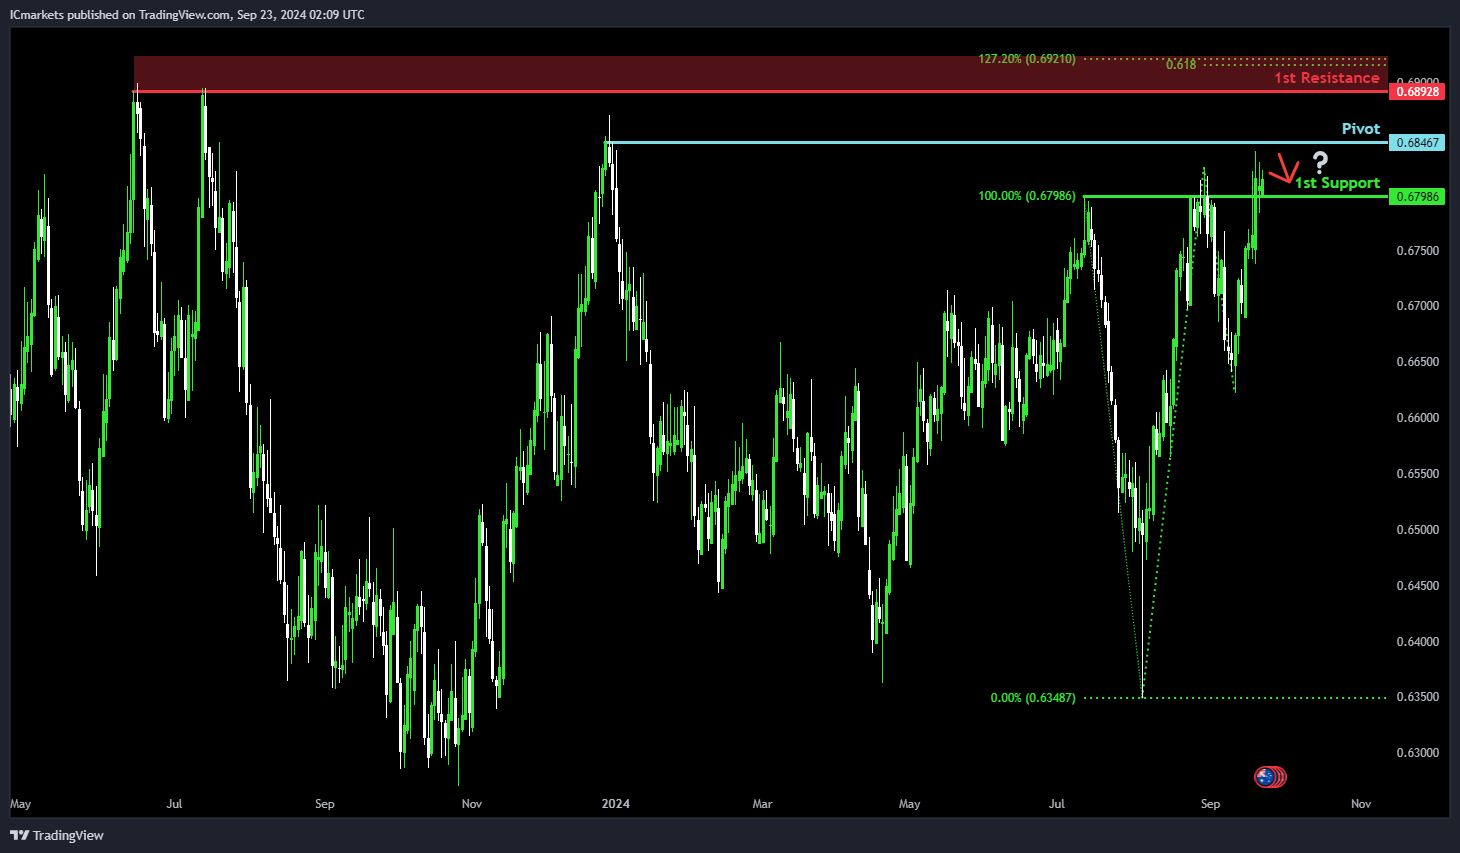
AUD/USD:
Potential Direction: Bearish
Overall momentum of the chart: Bullish
Price could rise towards the pivot and potentially make a bearish reversal off this level to pull back towards the 1st support.
Pivot: 0.6846
Supporting reasons: Identified as a swing-high resistance, suggesting a potential area where selling pressures could intensify.
1st support: 0.6798
Supporting reasons: Identified as a pullback support, indicating a key level where price could find support.
1st resistance: 0.6892
Supporting reasons: Identified as a multi-swing-high resistance that aligns close to a confluence of Fibonacci levels i.e. the 61.8% projection and the 127.2% extension, indicating a potential area that could halt any further upward movement.
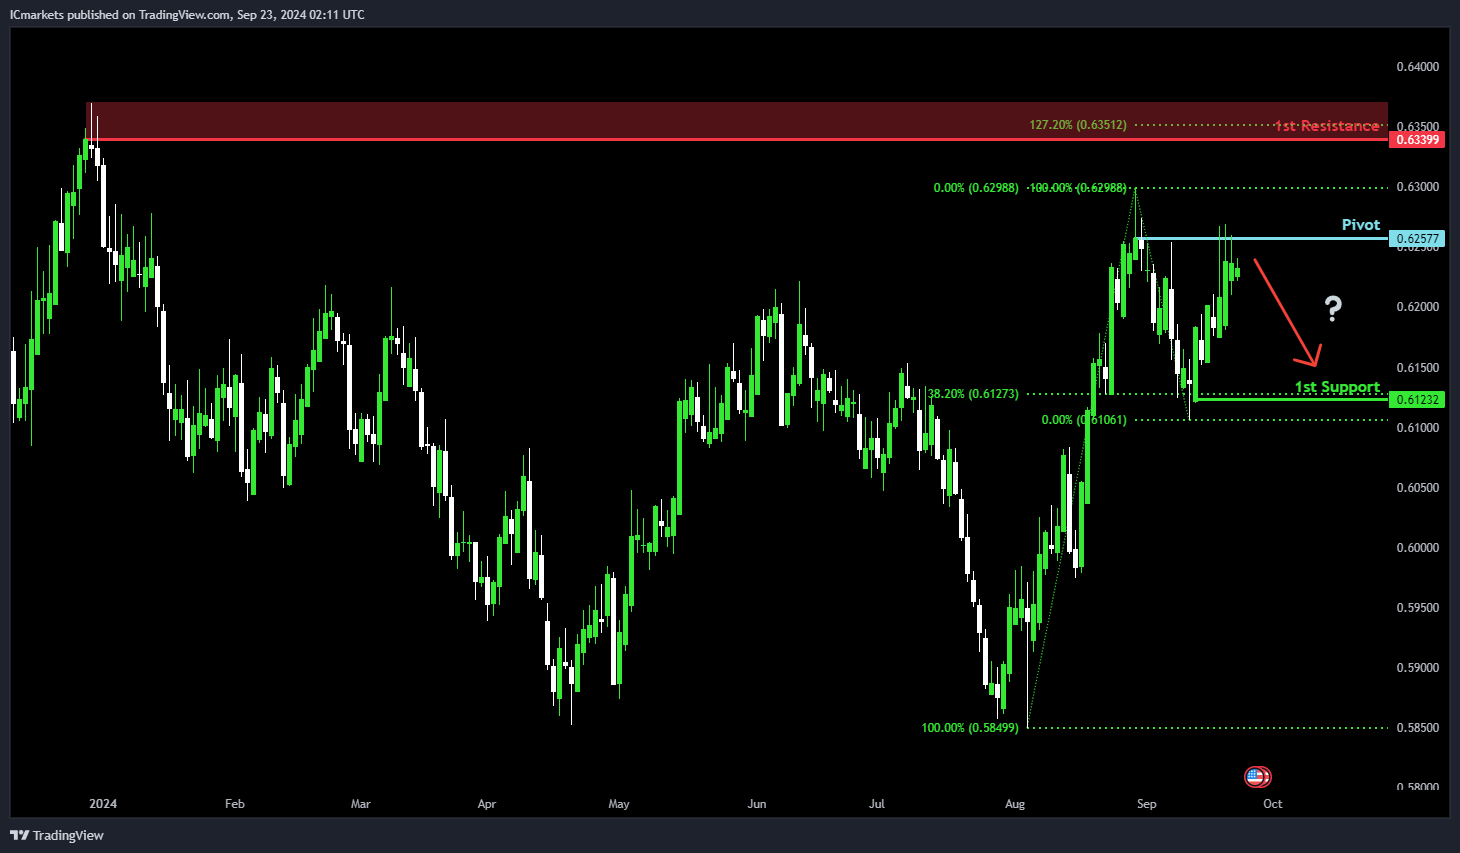
NZD/USD
Potential Direction: Bearish
Overall momentum of the chart: Bullish
Price could rise towards the pivot and potentially make a bearish reversal off this level to pull back towards the 1st support.
Pivot: 0.6257
Supporting reasons: Identified as a swing-high resistance, suggesting a potential area where selling pressures could intensify.
1st support: 0.6123
Supporting reasons: Identified as a swing-low support that aligns with a 38.2% Fibonacci retracement, indicating a potential level where price has found support in mid-September.
1st resistance: 0.6339
Supporting reasons: Identified as a swing-high resistance that aligns close to a 127.2% Fibonacci extension, indicating a potential area that could halt any further upward movement.
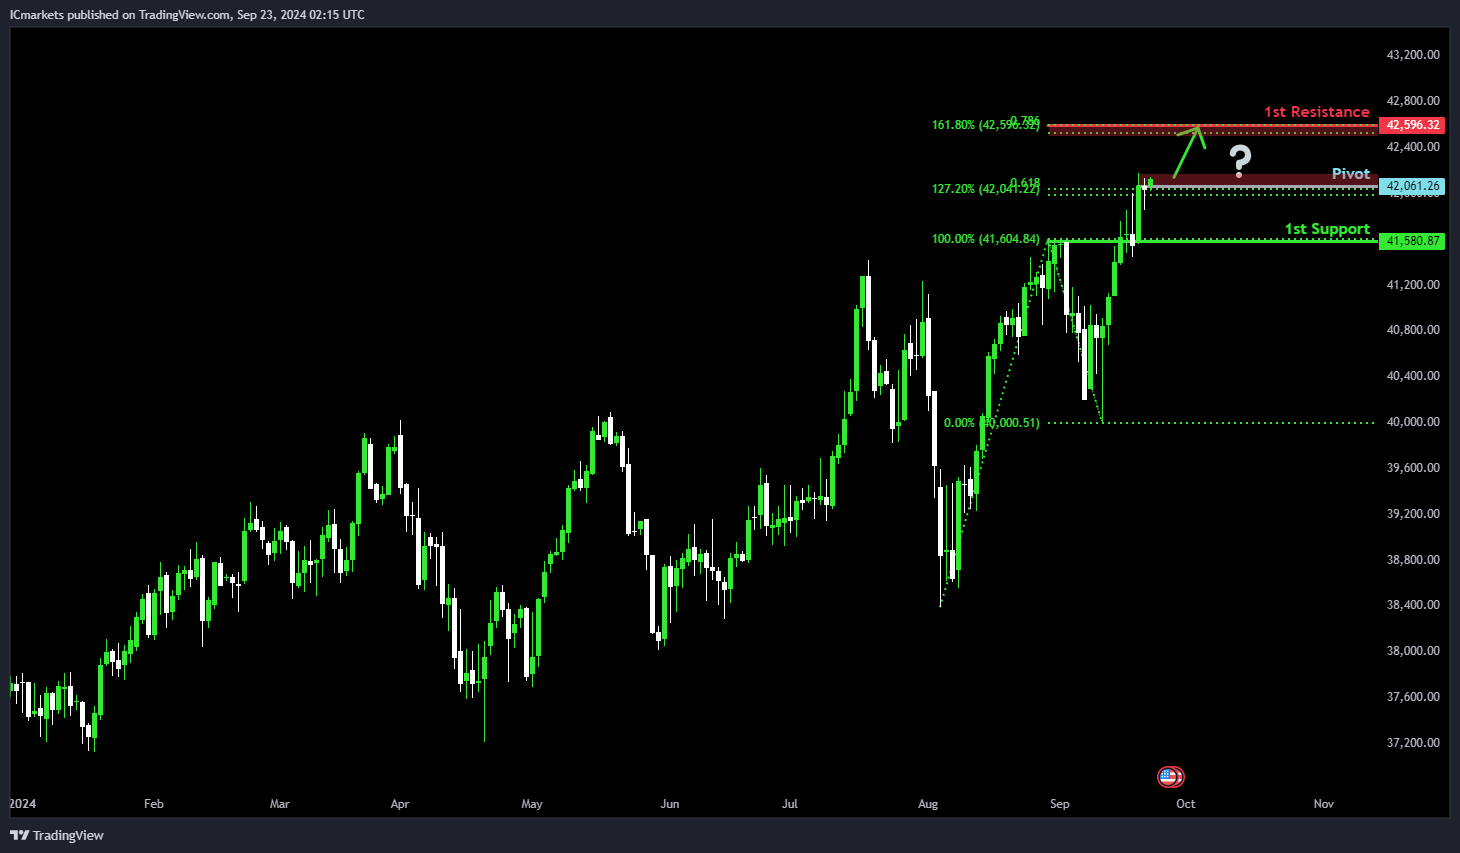
US30 (DJIA):
Potential Direction: Bullish
Overall momentum of the chart: Bullish
Price is rising towards the pivot and could potentially make a bullish break above this level to rise towards the 1st resistance.
Pivot: 42,061.26
Supporting reasons: Identified as a resistance area that aligns close to a confluence of Fibonacci levels i.e. the 61.8% projection and the 127.2% extension, but the strong bullish momentum is suggesting a bullish break above this resistance zone.
1st support: 41,580.87
Supporting reasons: Identified as an overlap support, indicating a potential level where price could find support.
1st resistance: 42,596.32
Supporting reasons: Identified as a resistance that aligns with a confluence of Fibonacci levels i.e. the 78.6% projection and the 161.8% extension, indicating a potential area that could halt any further upward movement.
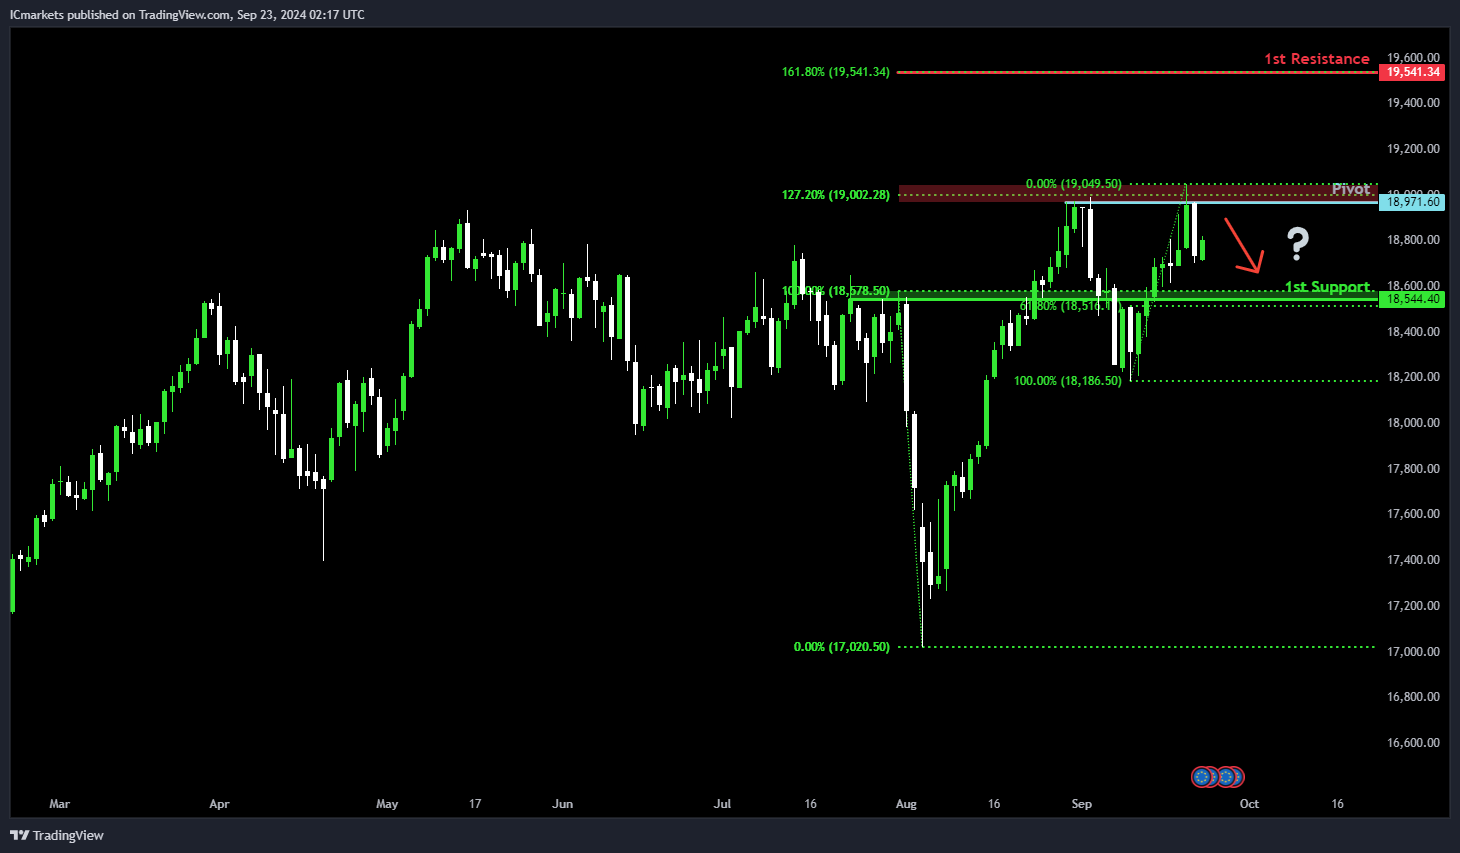
DE40 (DAX):
Potential Direction: Bearish
Overall momentum of the chart: Neutral
Price is rising towards the pivot and could potentially make a bearish reversal off this level to pull back towards the 1st support.
Pivot: 18,971.60
Supporting reasons: Identified as a multi-swing–high resistance that aligns close to a 127.2% Fibonacci extension, suggesting a potential area where selling pressures could intensify.
1st support: 18,544.40
Supporting reasons: Identified as an overlap support that aligns close to a 61.8% Fibonacci retracement, indicating a key level where price could find support once more.
1st resistance: 19,541.34
Supporting reasons: Identified as a resistance that aligns with a 161.80% Fibonacci extension, indicating a potential area that could halt any further upward movement.
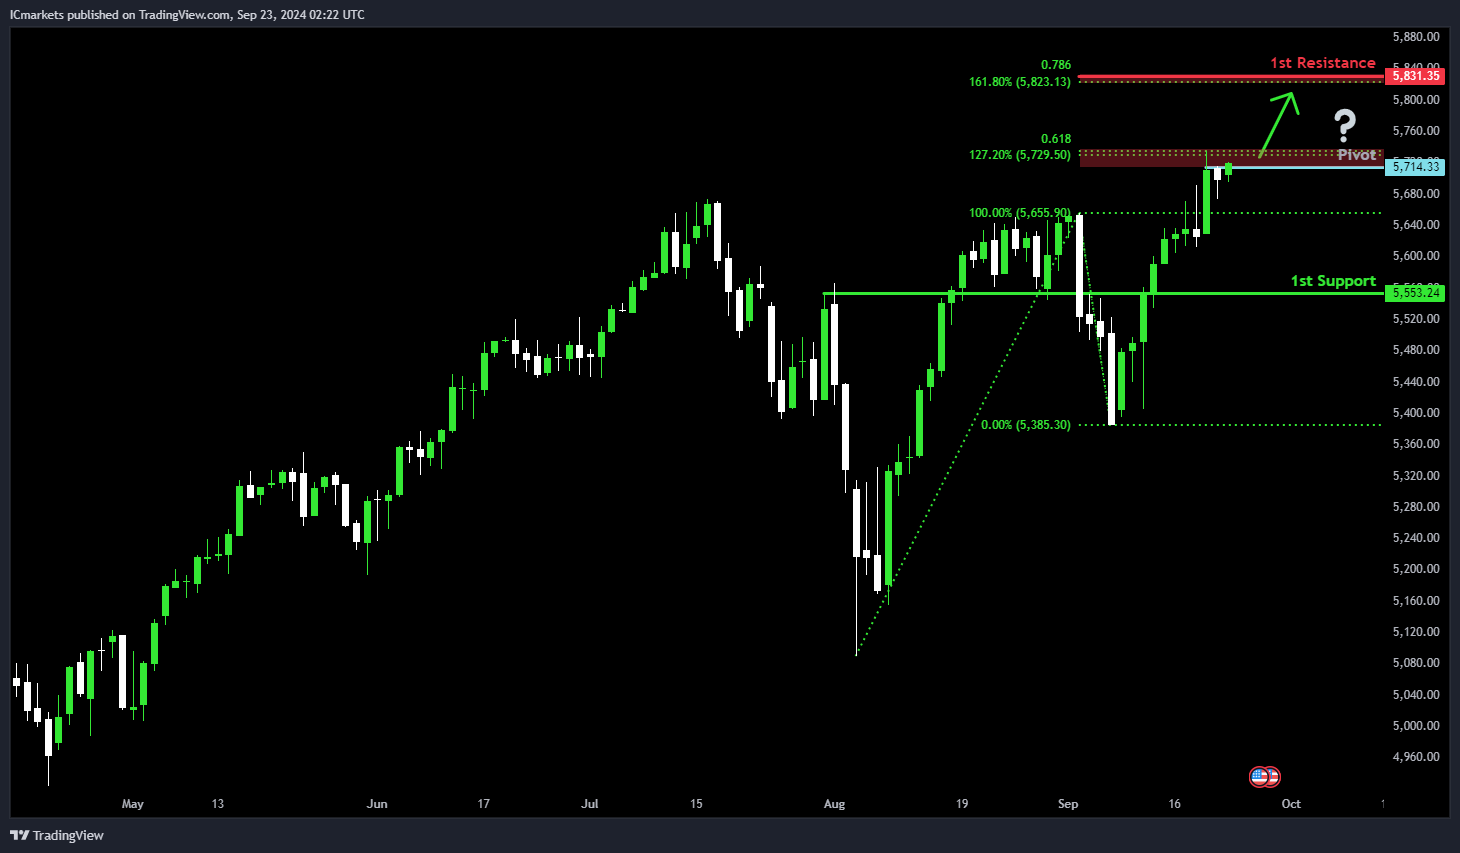
US500 (S&P 500):
Potential Direction: Bullish
Overall momentum of the chart: Bullish
Price is rising towards the pivot and could potentially make a bullish break above this level to rise towards the 1st resistance.
Pivot: 5,714.33
Supporting reasons: Identified as a resistance area that aligns close to a confluence of Fibonacci levels i.e. the 61.8% projection and the 127.2% extension, but the strong bullish momentum is suggesting a bullish break above this resistance zone.
1st support: 5,553.24
Supporting reasons: Identified as an overlap support, indicating a key level where price could find support.
1st resistance: 5,831.35
Supporting reasons: Identified as a resistance that aligns with a confluence of Fibonacci levels i.e. the 78.6% projection and the 161.8% extension, indicating a potential area that could halt any further upward movement.
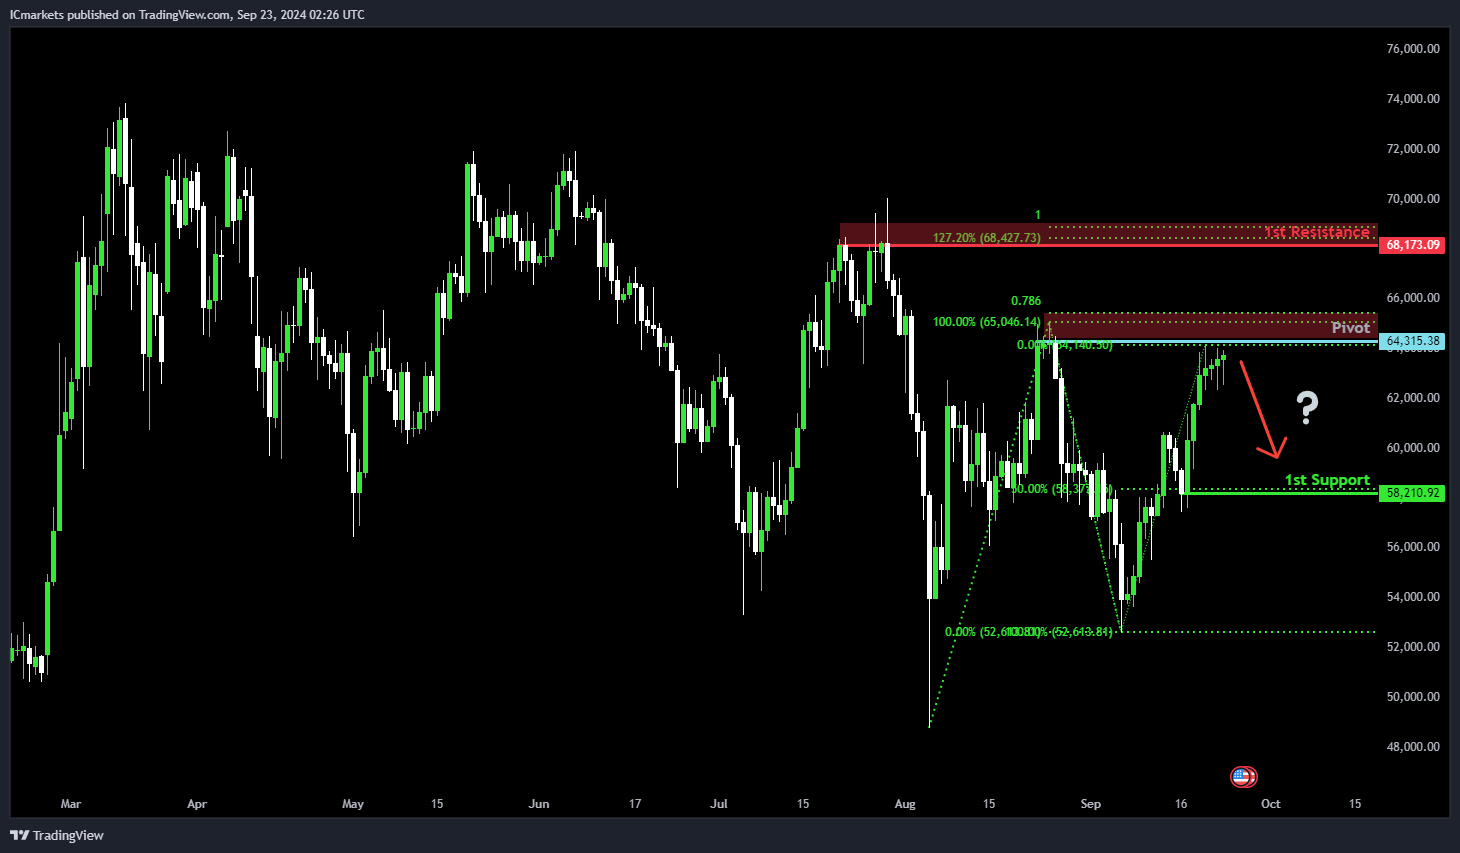
BTC/USD (Bitcoin):
Potential Direction: Bearish
Overall momentum of the chart: Neutral
Price is rising towards the pivot and could potentially make a bearish reversal off this level to fall towards the 1st support.
Pivot: 64,315.38
Supporting reasons: Identified as a swing-high resistance that aligns close to a 78.6% Fibonacci projection, suggesting a potential level where selling pressures could intensify.
1st support: 58,210.92
Supporting reasons: Identified as a pullback support that aligns with a 50% Fibonacci retracement, indicating a key level where price has found support in mid-September.
1st resistance: 68,173.09
Supporting reasons: Identified as a multi-swing-high resistance that aligns close to a confluence of Fibonacci levels i.e. the 100% projection and the 127.2% extension, indicating a potential area that could halt any further upward movement.
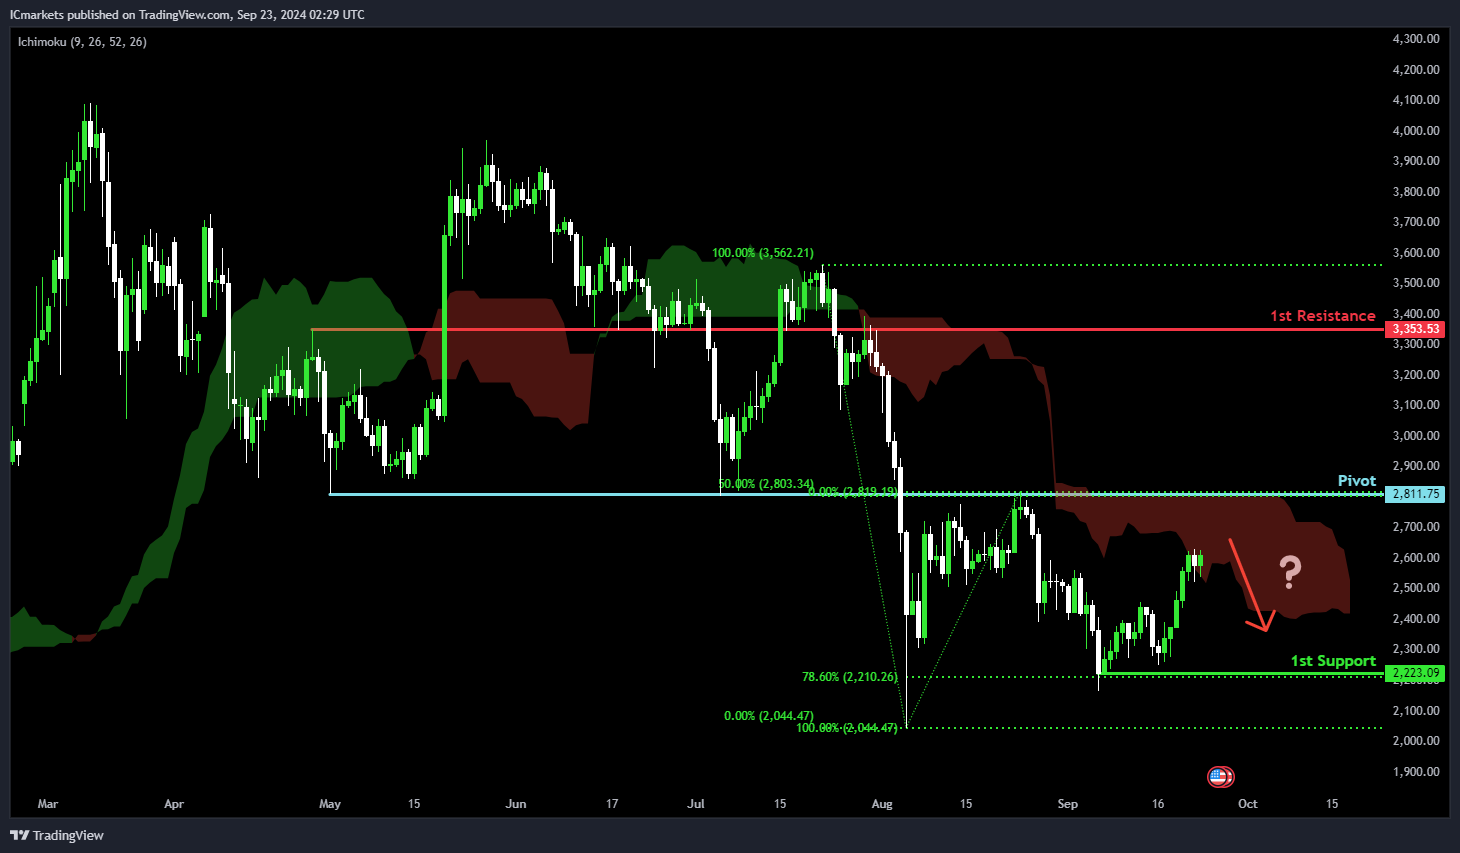
ETH/USD (Ethereum):
Potential Direction: Bearish
Overall momentum of the chart: Neutral
Price is rising towards the pivot and could potentially make a bearish reversal off this level to fall towards the 1st support.
Pivot: 2,811.75
Supporting reasons: Identified as an overlap resistance that aligns with a 50% Fibonacci retracement, suggesting a potential level where selling pressures could intensify. The presence of a bearish Ichimoku Cloud adds further significance to the strength of this resistance zone.
1st support: 2,223.09
Supporting reasons: Identified as a swing-low support that aligns with a 78.6% Fibonacci retracement, indicating a potential level where price has found support in early September.
1st resistance: 3,353.53
Supporting reasons: Identified as an overlap resistance, indicating a potential area that could halt any further upward movement.
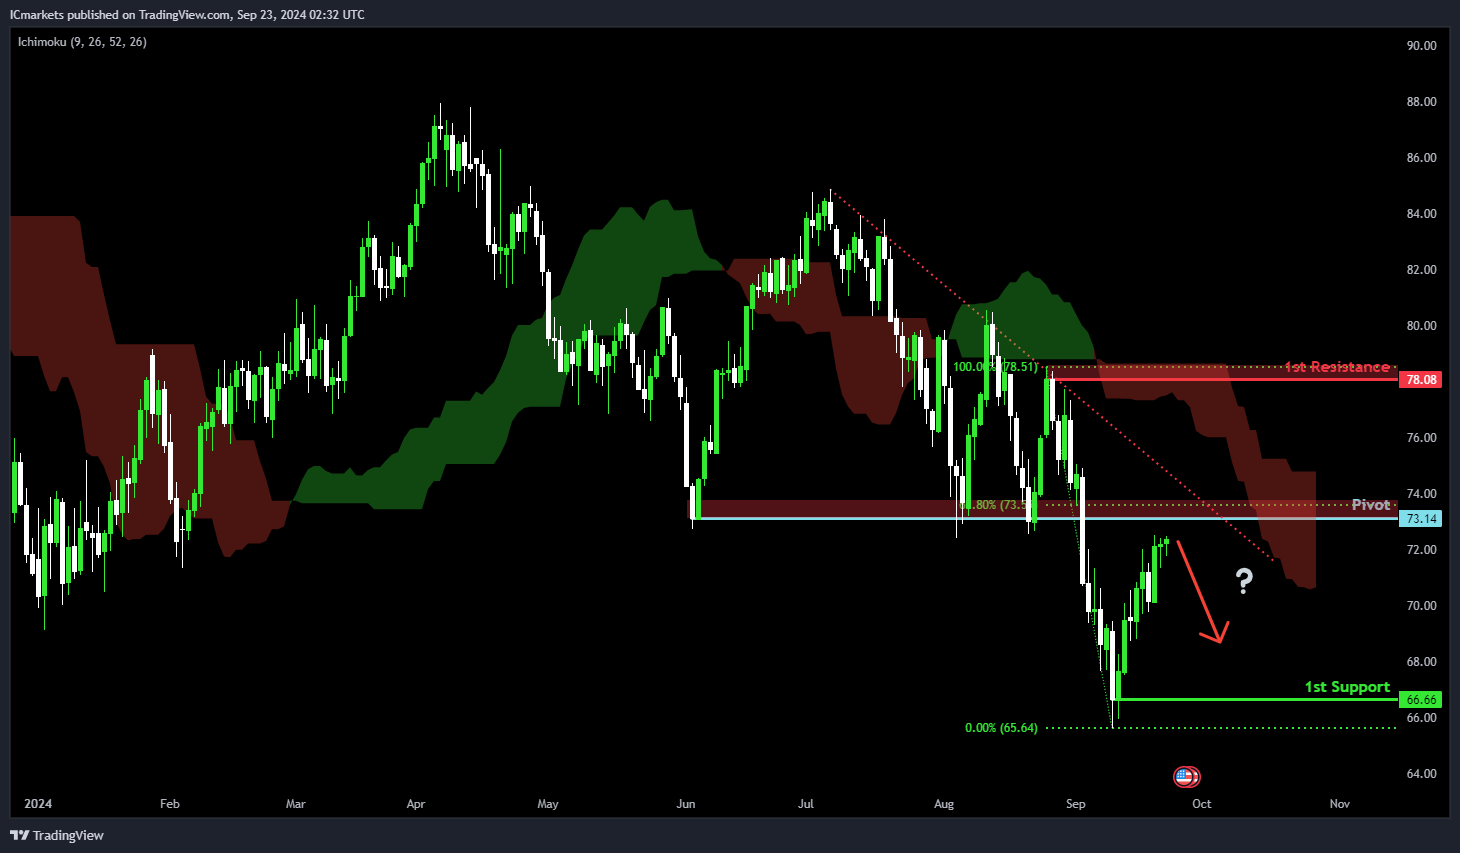
WTI/USD (Oil):
Potential Direction: Bearish
Overall momentum of the chart: Neutral
Price could rise towards the pivot and potentially make a bearish reversal off this level to fall towards the 1st support.
Pivot: 73.14
Supporting reasons: Identified as pullback support that aligns close to a 61.8% Fibonacci retracement, suggesting a potential level where buying interests could pick up to stage a rebound. The presence of a descending trendline and the bearish Ichimoku Cloud add further significance to the strength of this resistance zone.
1st support: 66.66
Supporting reasons: Identified as a swing-low support, indicating a key level where price has found support in mid-September.
1st resistance: 78.08
Supporting reasons: Identified as a swing-high resistance, indicating a potential area that could halt any further upward movement.
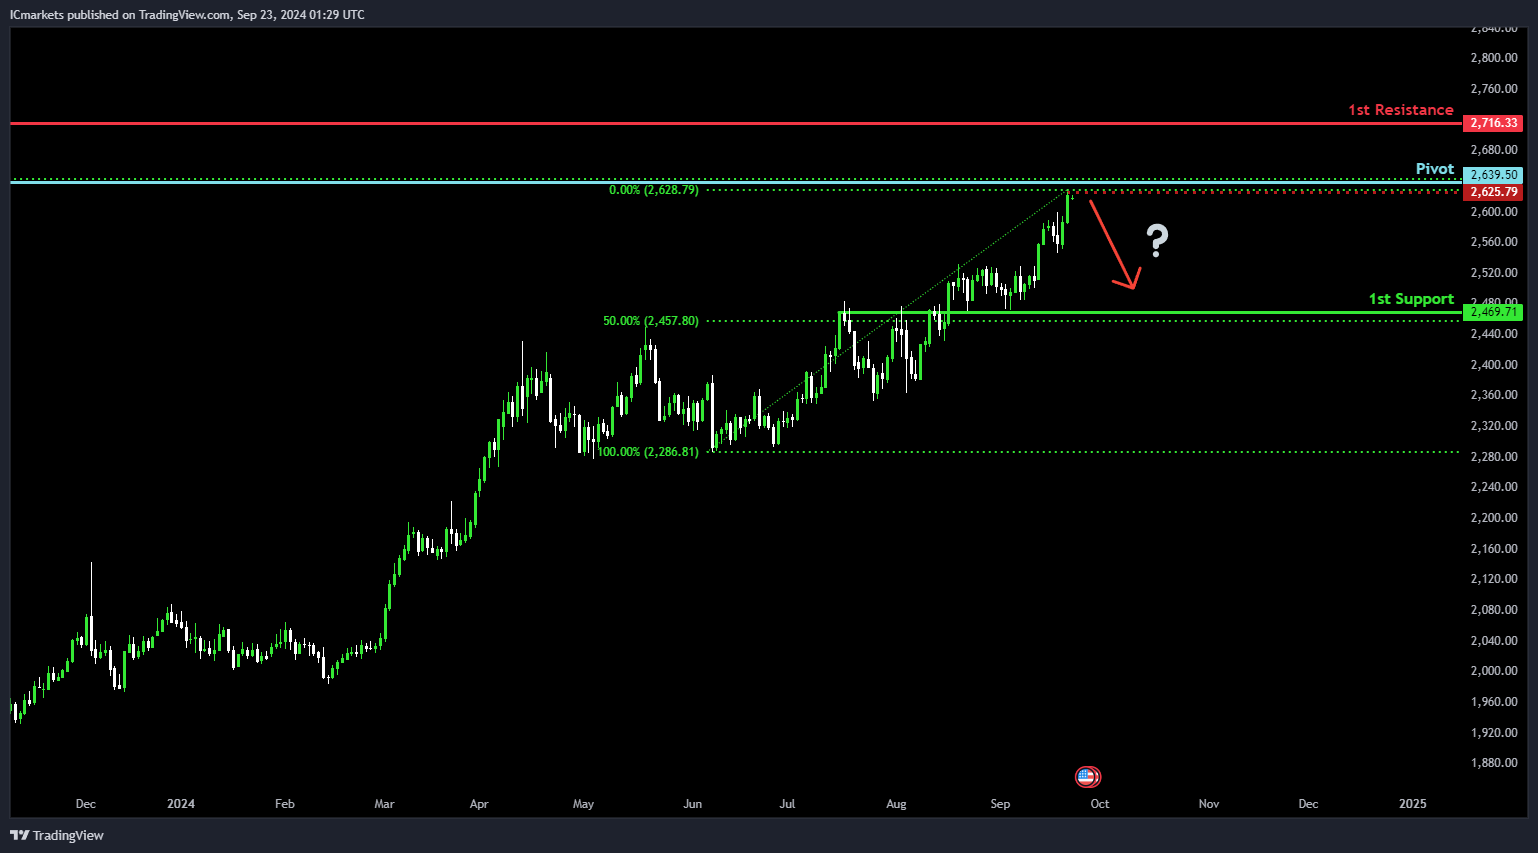
XAU/USD (GOLD):
Potential Direction: Bearish
Overall momentum of the chart: Bullish
Price could potentially make a: Bearish reaction off pivot and drop to 1st support.
Pivot: 2639.50
Supporting reasons: 100% Fibonacci Projection, suggesting this level could act as a significant resistance point.
1st support: 2469.71
Supporting reasons: An overlap support and 50% Fibonacci Retracement, indicating that this level might provide a strong support if the price declines.
1st resistance: 2716.33
Supporting reasons: 100% Fibonacci Projection, which could be a key resistance level if the price rises.
The accuracy, completeness and timeliness of the information contained on this site cannot be guaranteed. IC Trading does not warranty, guarantee or make any representations, or assume any liability regarding financial results based on the use of the information in the site.
News, views, opinions, recommendations and other information obtained from sources outside of www.ictrading.com, used in this site are believed to be reliable, but we cannot guarantee their accuracy or completeness. All such information is subject to change at any time without notice. IC Trading assumes no responsibility for the content of any linked site.
The fact that such links may exist does not indicate approval or endorsement of any material contained on any linked site. IC Trading is not liable for any harm caused by the transmission, through accessing the services or information on this site, of a computer virus, or other computer code or programming device that might be used to access, delete, damage, disable, disrupt or otherwise impede in any manner, the operation of the site or of any user’s software, hardware, data or property.