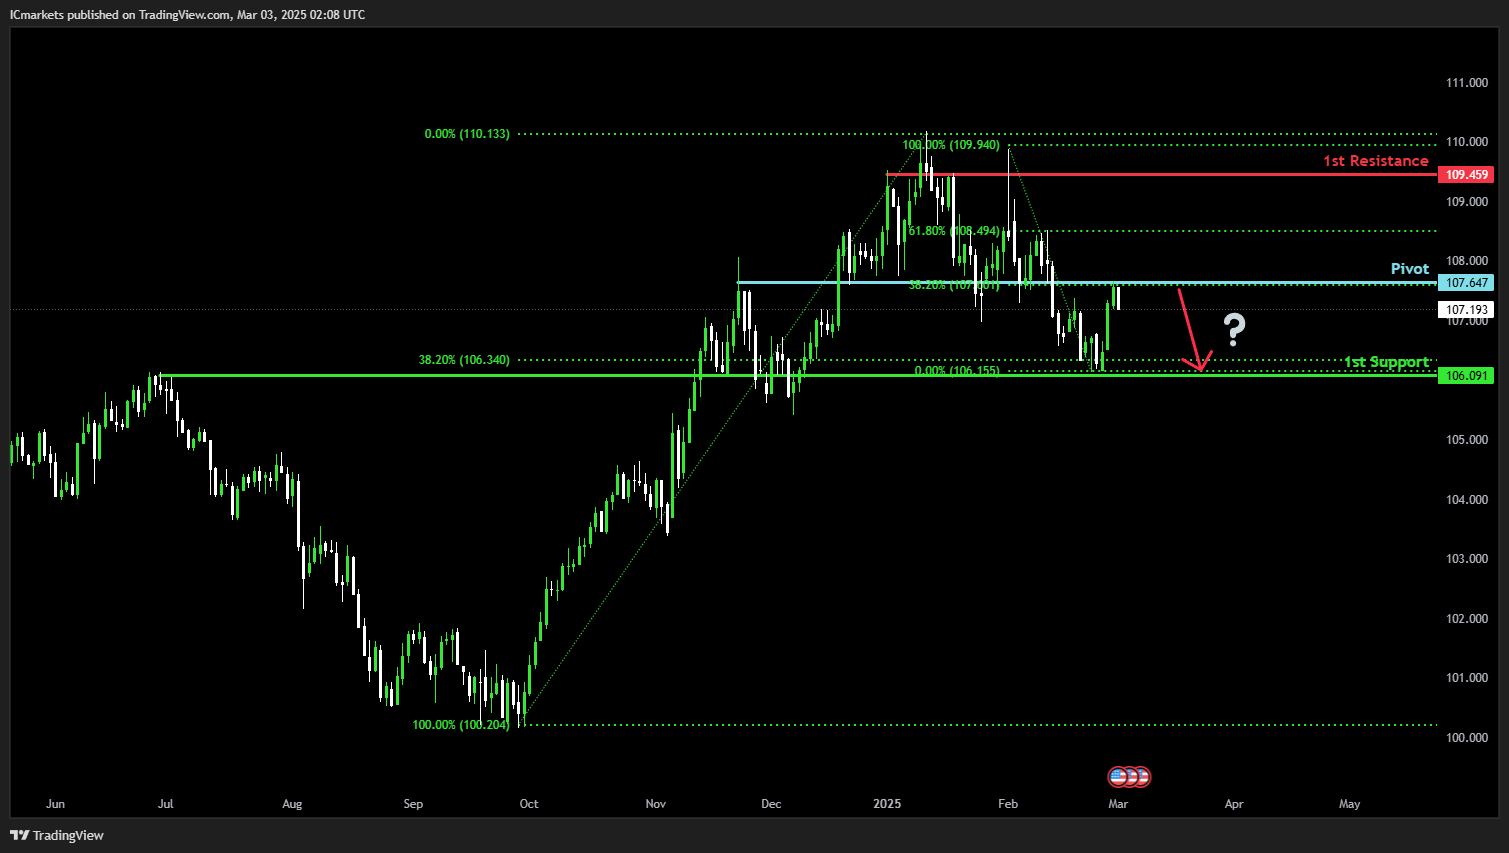
DXY (US Dollar Index):
Potential Direction: Bearish
Overall momentum of the chart: Bearish
Price could potentially make a Bearish continuation toward the 1st support.
Pivot: 107.64
Supporting reasons: Identified as a pullback resistance that aligns with the 38.2% Fibonacci retracement, indicating a potential area where selling pressure could emerge.
1st support: 106.09
Supporting reasons: Identified as an overlap support that aligns with the 38.2% Fibonacci retracement, indicating as a potential area where price could stabilize before continuing higher.
1st resistance: 109.45
Supporting reasons: Identified as a multi swing high resistance, indicating a potential level that could cap further upward movement.
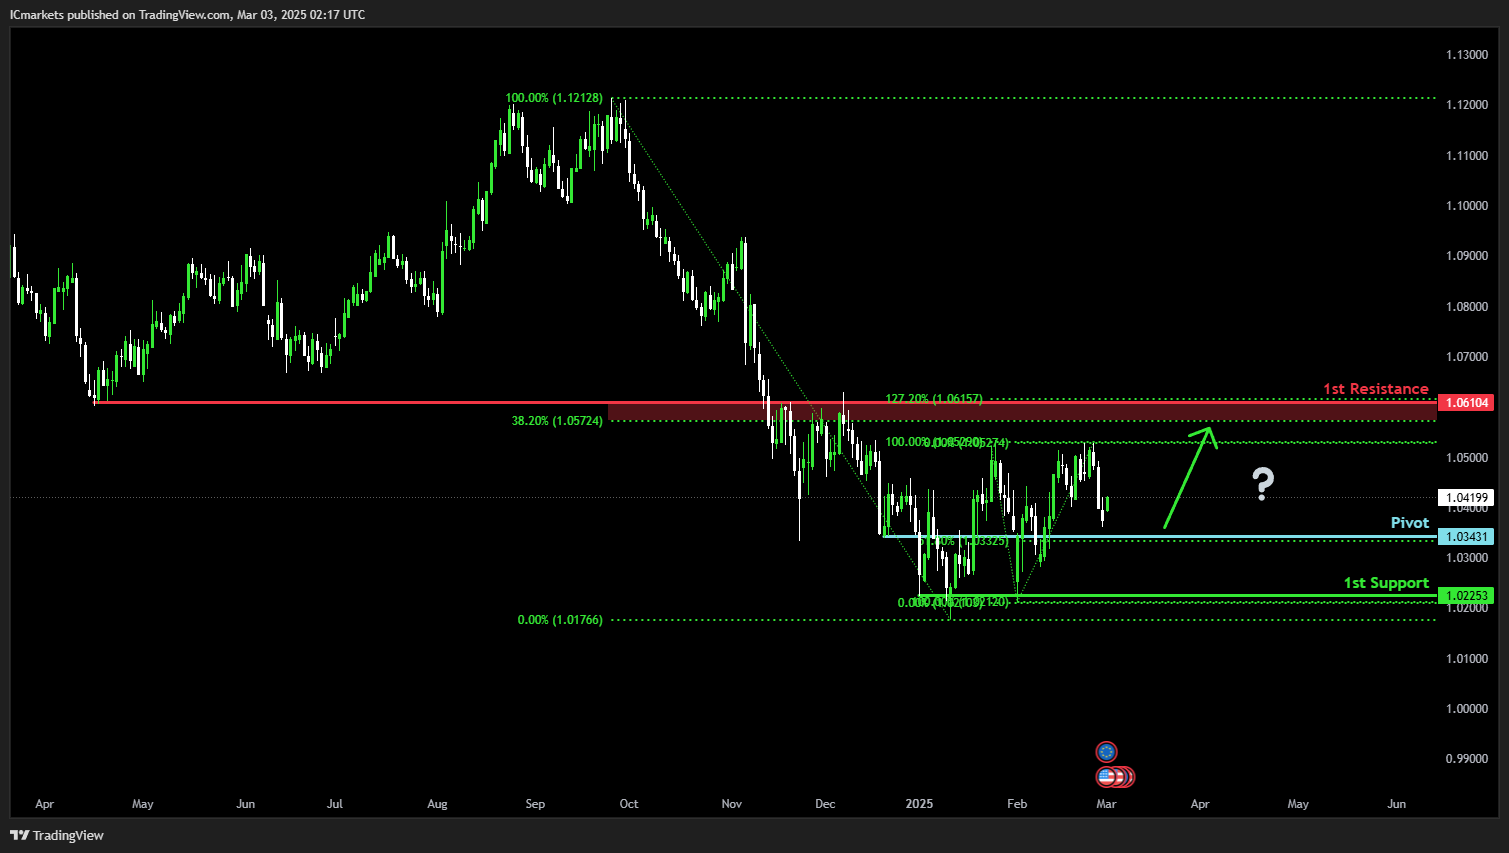
EUR/USD:
Potential Direction: Bullish
Overall momentum of the chart: Bullish
Price could potentially make a bullish bounce off the pivot and head towards the 1st resistance.
Pivot: 1.0343
Supporting reasons: Identified as a pullback support that aligns close to the 61.8% Fibonacci retracement, indicating a potential area where price could rebound.
1st support: 1.0225
Supporting reasons: Identified as a multi swing low support, indicating as a potential area where price could stabilize before continuing higher.
1st resistance: 1.0610
Supporting reasons: Identified as an overlap resistance that aligns close to the 127.2% Fibonacci extension and the 38.2% Fibonacci retracement, indicating a potential level where price could face selling pressure.
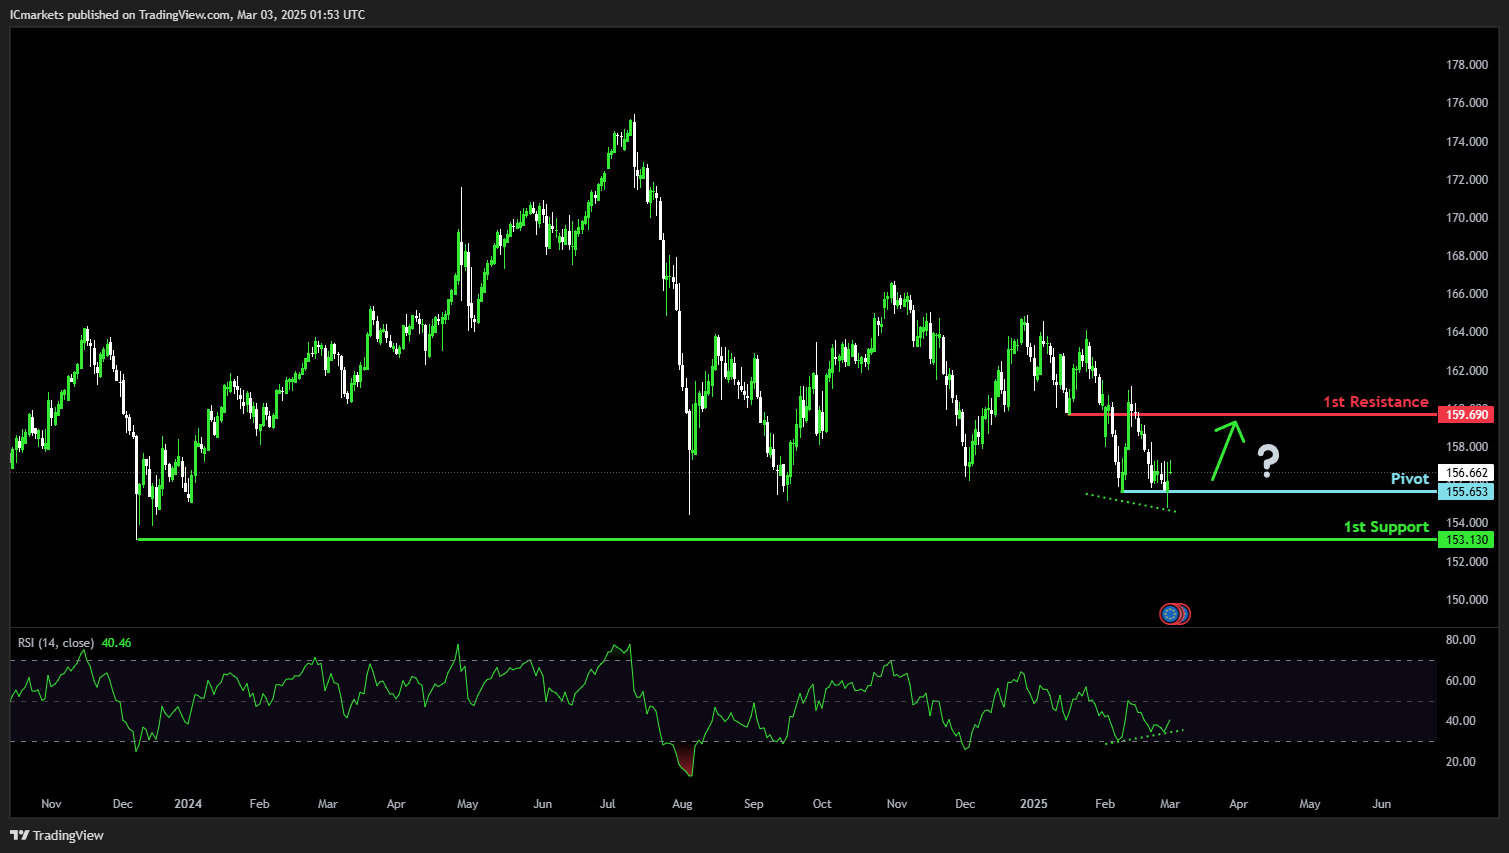
EUR/JPY:
Potential Direction: Bullish
Overall momentum of the chart: Bearish
Price could potentially make a bullish bounce off the pivot and head towards the 1st resistance.
Pivot: 155.65
Supporting reasons: Identified as a multi-swing low support, indicating a potential area where price could rebound.
1st support: 153.13
Supporting reasons: Identified as a swing low support, indicating as a potential area where price could stabilize before continuing higher.
1st resistance: 159.69
Supporting reasons: Identified as a pullback resistance, indicating a potential level where price could face selling pressure.
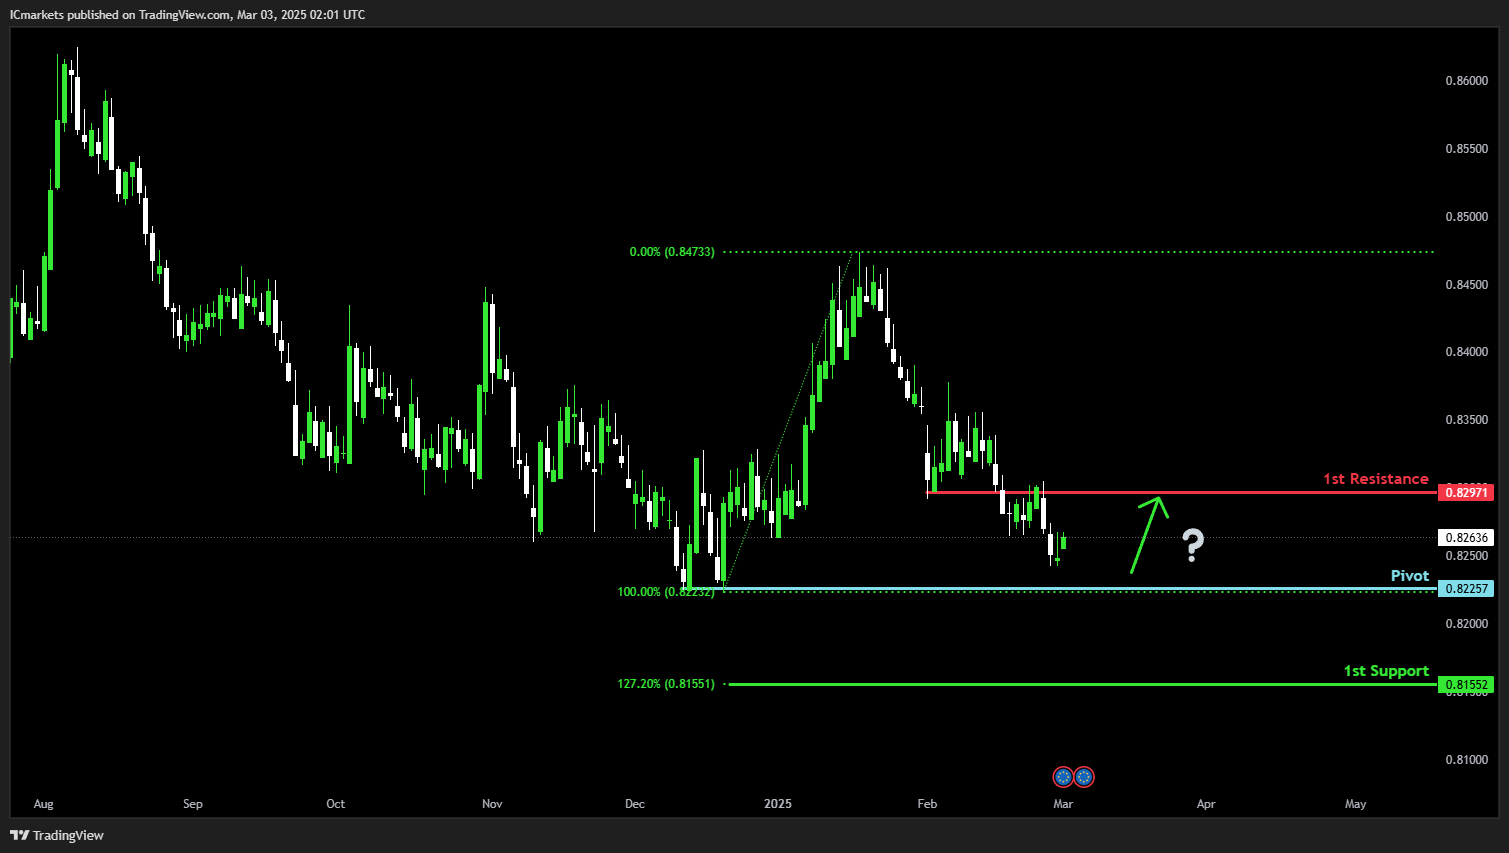
EUR/GBP:
Potential Direction: Bullish
Overall momentum of the chart: Bearish
Price could potentially make a bullish bounce off the pivot and head towards the 1st resistance.
Pivot: 0.8225
Supporting reasons: Identified as a swing low support, indicating a potential area where price could rebound.
1st support: 0.8166
Supporting reasons: Identified as a support that aligns with the 127.2% Fibonacci extension, indicating as a potential area where price could stabilize before continuing higher.
1st resistance: 0.8297
Supporting reasons: Identified as an overlap resistance, indicating a potential level that could cap further upward movement.
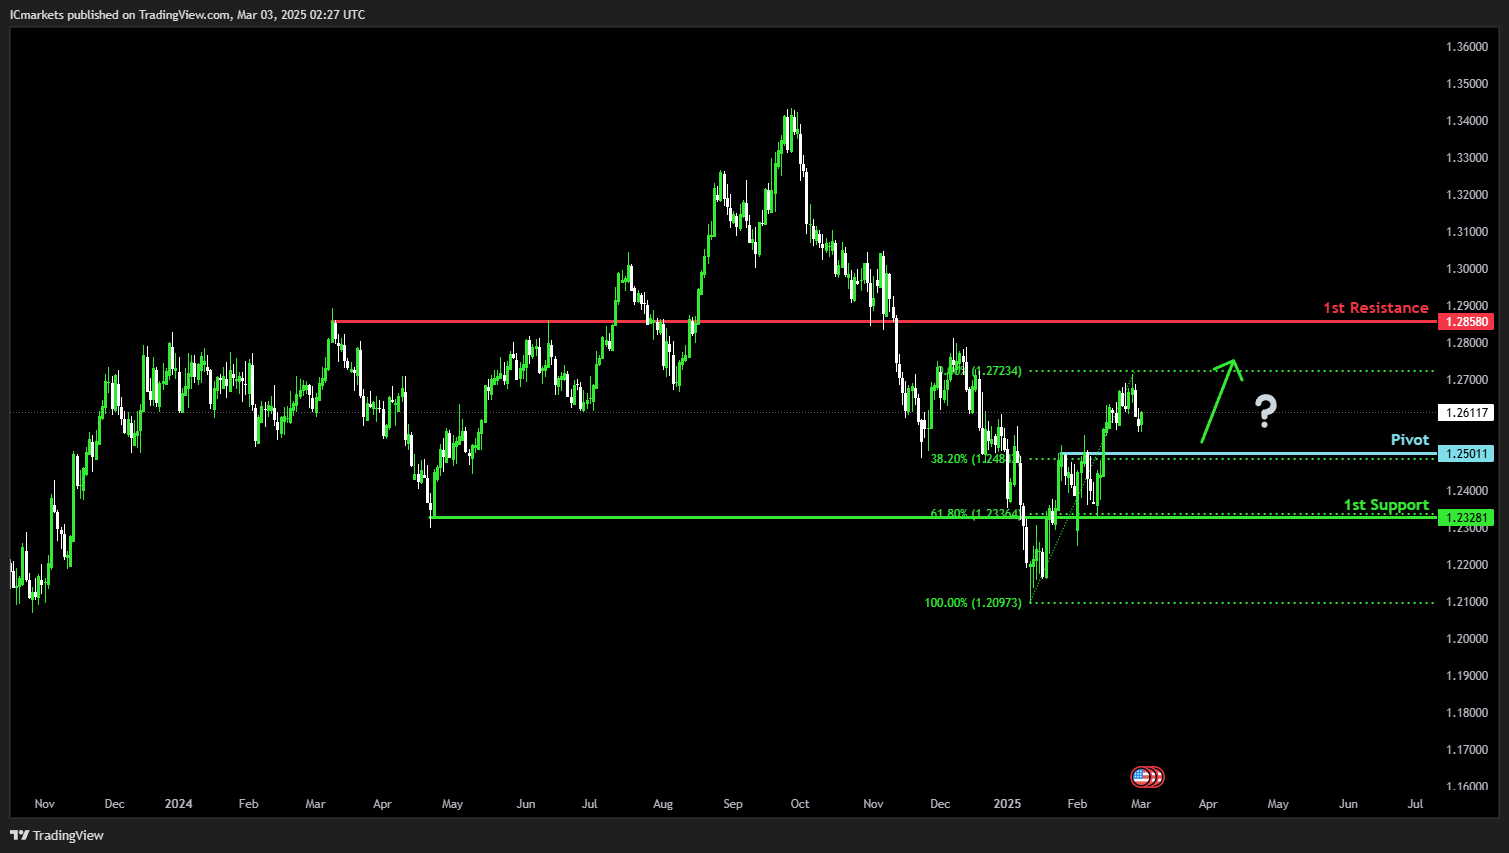
GBP/USD:
Potential Direction: Bulish
Overall momentum of the chart: Bullish
Price could potentially drop further to the pivot in the short-term before bouncing from there and rising to the 1st resistance.
Pivot: 1.2501
Supporting reasons: Identified as a pullback support that aligns close to the 38.2% Fibonacci retracement, indicating a potential level where buyers could step in.
1st support: 1.2328
Supporting reasons: Identified as an overlap support that aligns with the 61.8% Fibonacci retracement, acting as a potential level where price could stabilize before continuing higher.
1st resistance: 1.2858
Supporting reasons: Identified as a pullback resistance, indicating a potential level that could cap further upward movement.
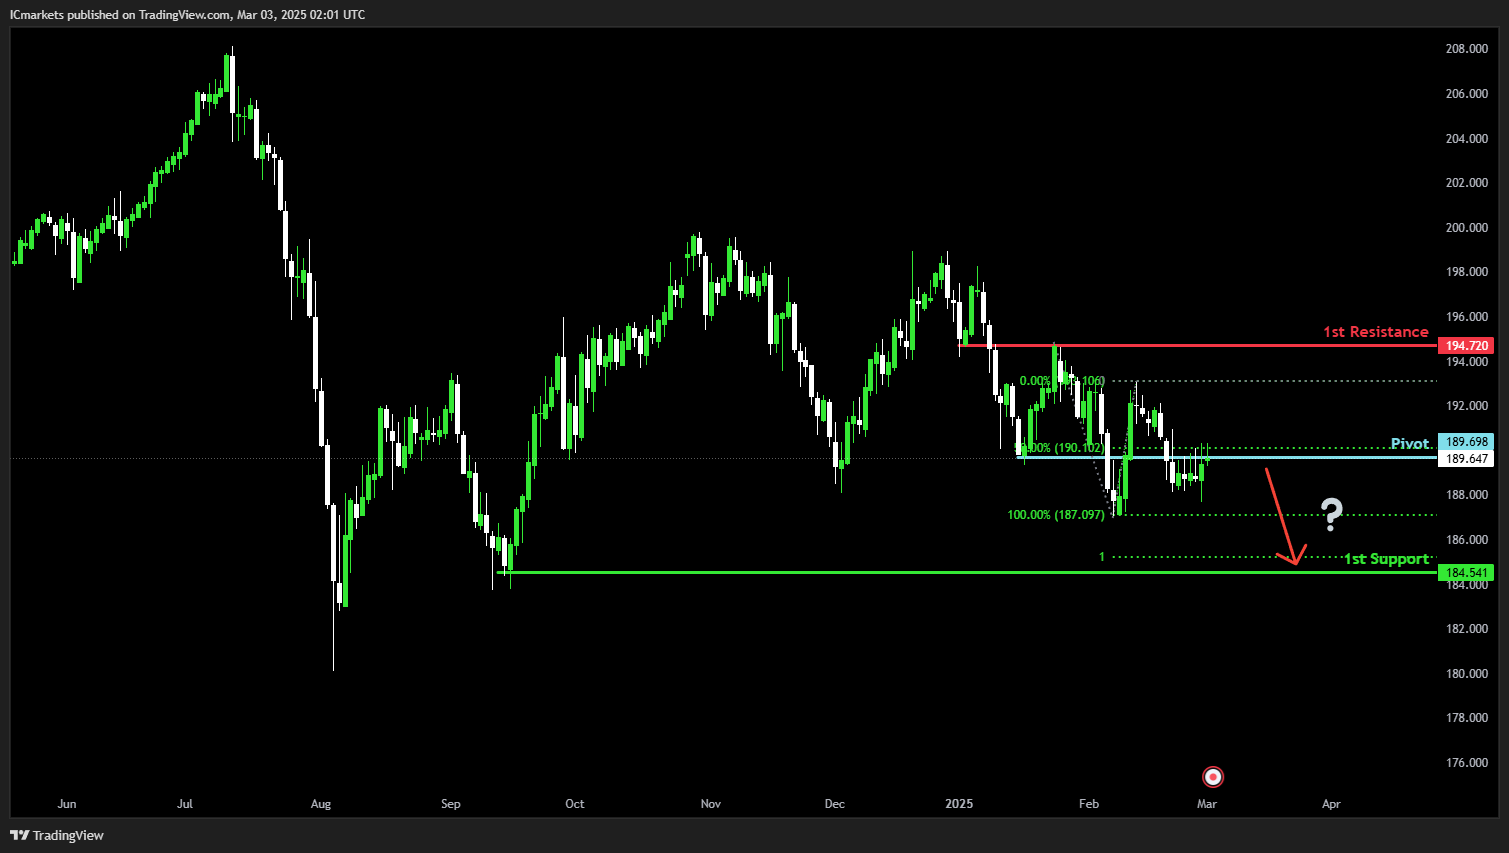
GBP/JPY:
Potential Direction: Bearish
Overall momentum of the chart: Bullish
Price could potentially make a bearish continuation toward the 1st support.
Pivot: 189.69
Supporting reasons: Identified as an overlap resistance that aligns with the 50% Fibonacci retracement, indicating a potential area where selling pressure could emerge.
1st support: 184.54
Supporting reasons: Identified as a multi-swing low support that aligns close to the 100% Fibonacci projection, indicating a potential level where price could stabilize before continuing higher.
1st resistance: 194.72
Supporting reasons: Identified as an overlap resistance, indicating a potential level where price could face selling pressure.
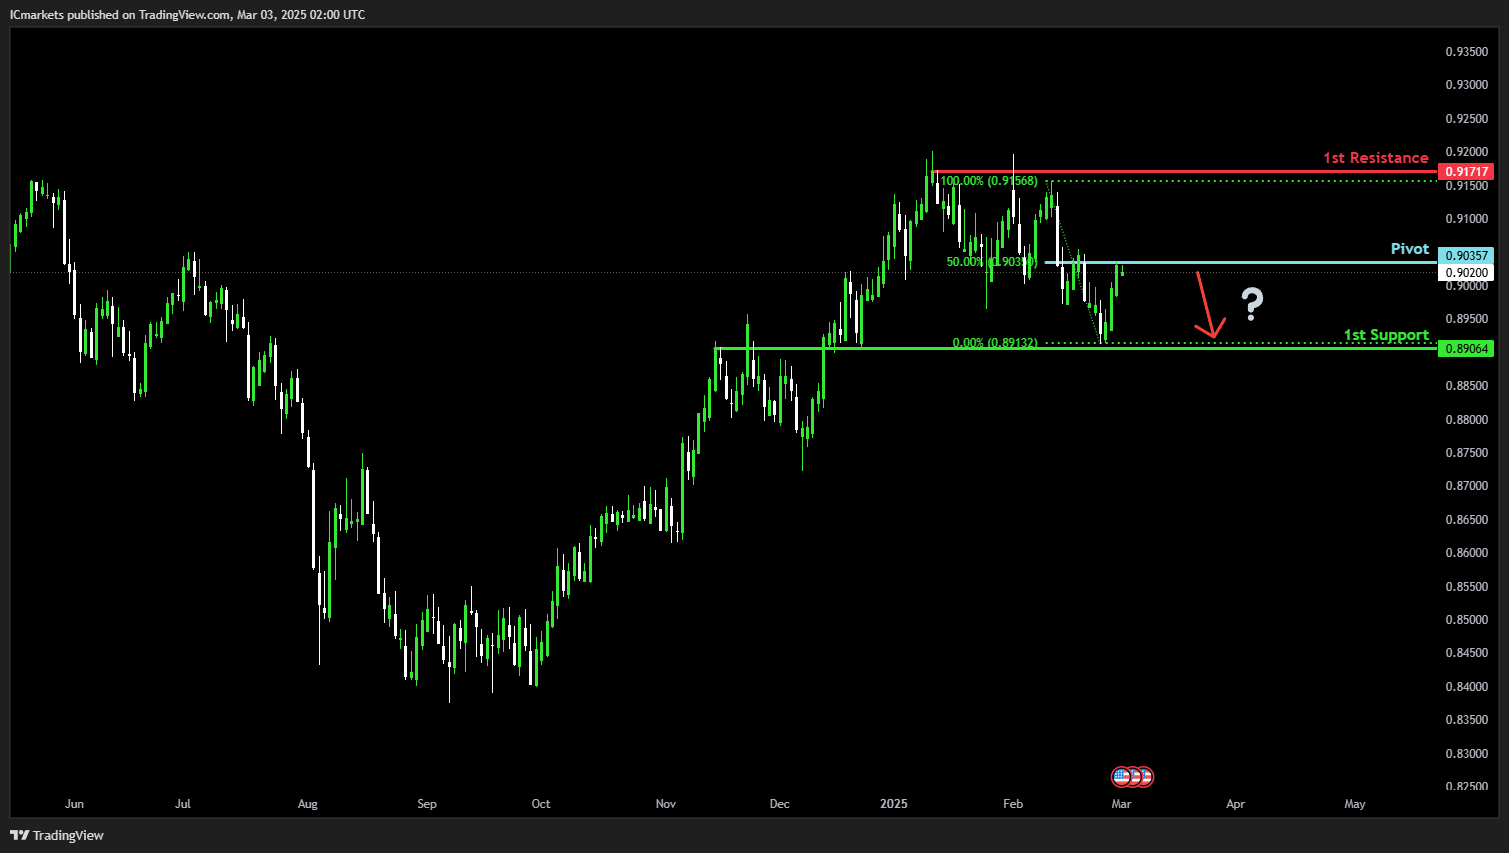
USD/CHF:
Potential Direction: Bearish
Overall momentum of the chart: Bearish
Price could potentially make a Bearish continuation toward the 1st support.
Pivot: 0.9035
Supporting reasons: Identified as a pullback resistance that aligns with the 50% Fibonacci retracement, indicating a potential area where selling pressure could emerge.
1st support: 0.8906
Supporting reasons: Identified as an overlap support, indicating a potential level where price could face selling pressure.
1st resistance: 0.9171
Supporting reasons: Identified as a swing – high resistance, indicating a potential level where price could face selling pressure.
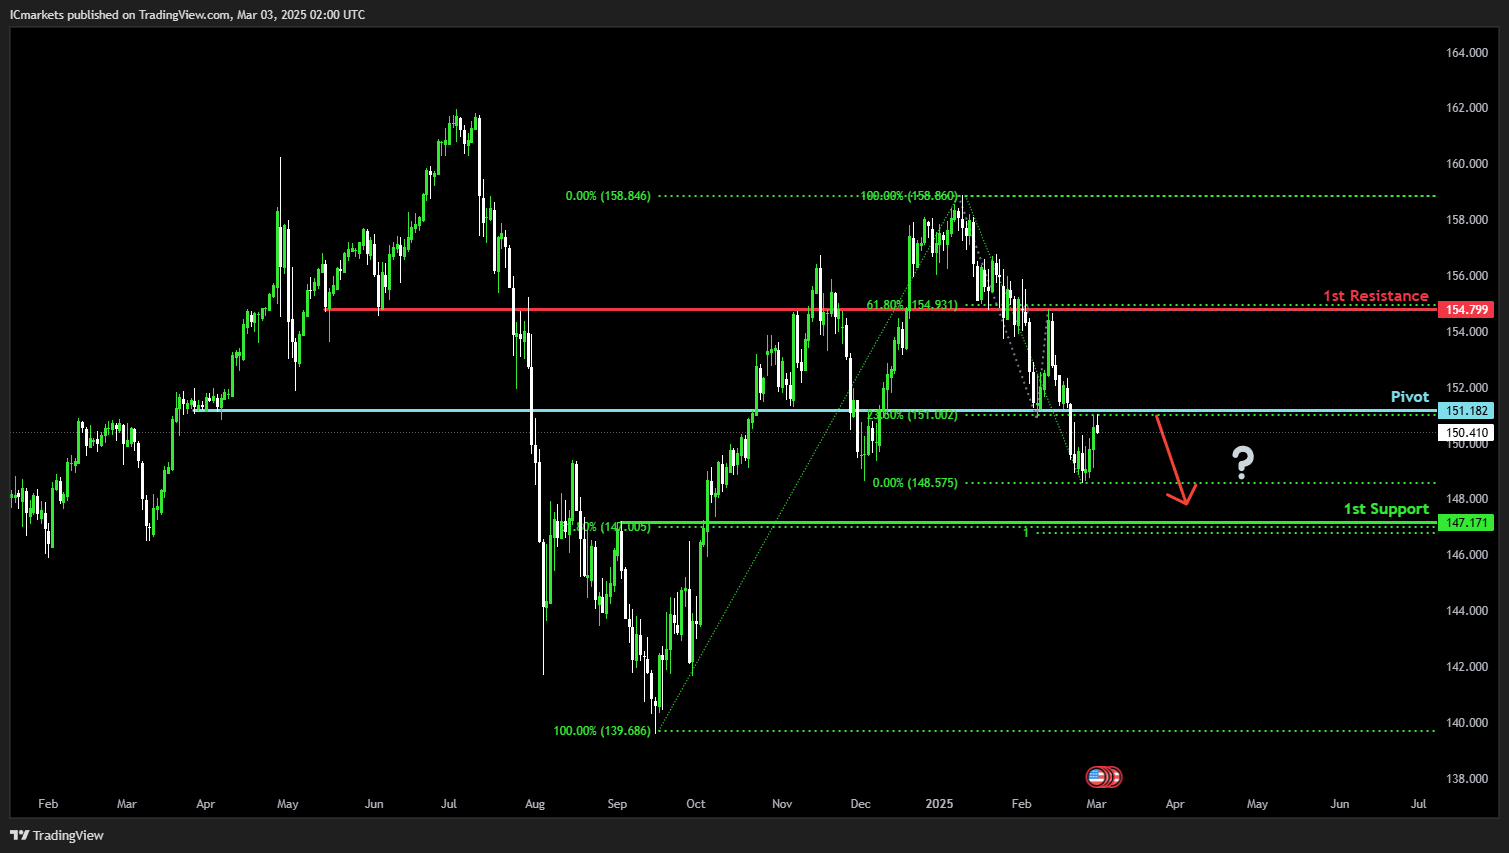
USD/JPY:
Potential Direction: Bearish
Overall momentum of the chart: Bearish
Price could potentially make a bearish continuation toward the 1st resistance.
Pivot: 151.18
Supporting reasons: Identified as a pullback resistance that aligns with the 23.6% Fibonacci retracement, indicating a potential area where selling pressure could emerge.
1st support: 147.17
Supporting reasons: Identified as a pullback support that aligns with the 61.8% Fibonacci retracement and the 100% Fibonacci projection, suggesting a potential area where price could stabilize before resuming its upward movement.
1st resistance: 154.79
Supporting reasons: Identified as an overlap resistance that aligns with the 61.8% Fibonacci retracement, indicating a potential level where price could face selling pressure.
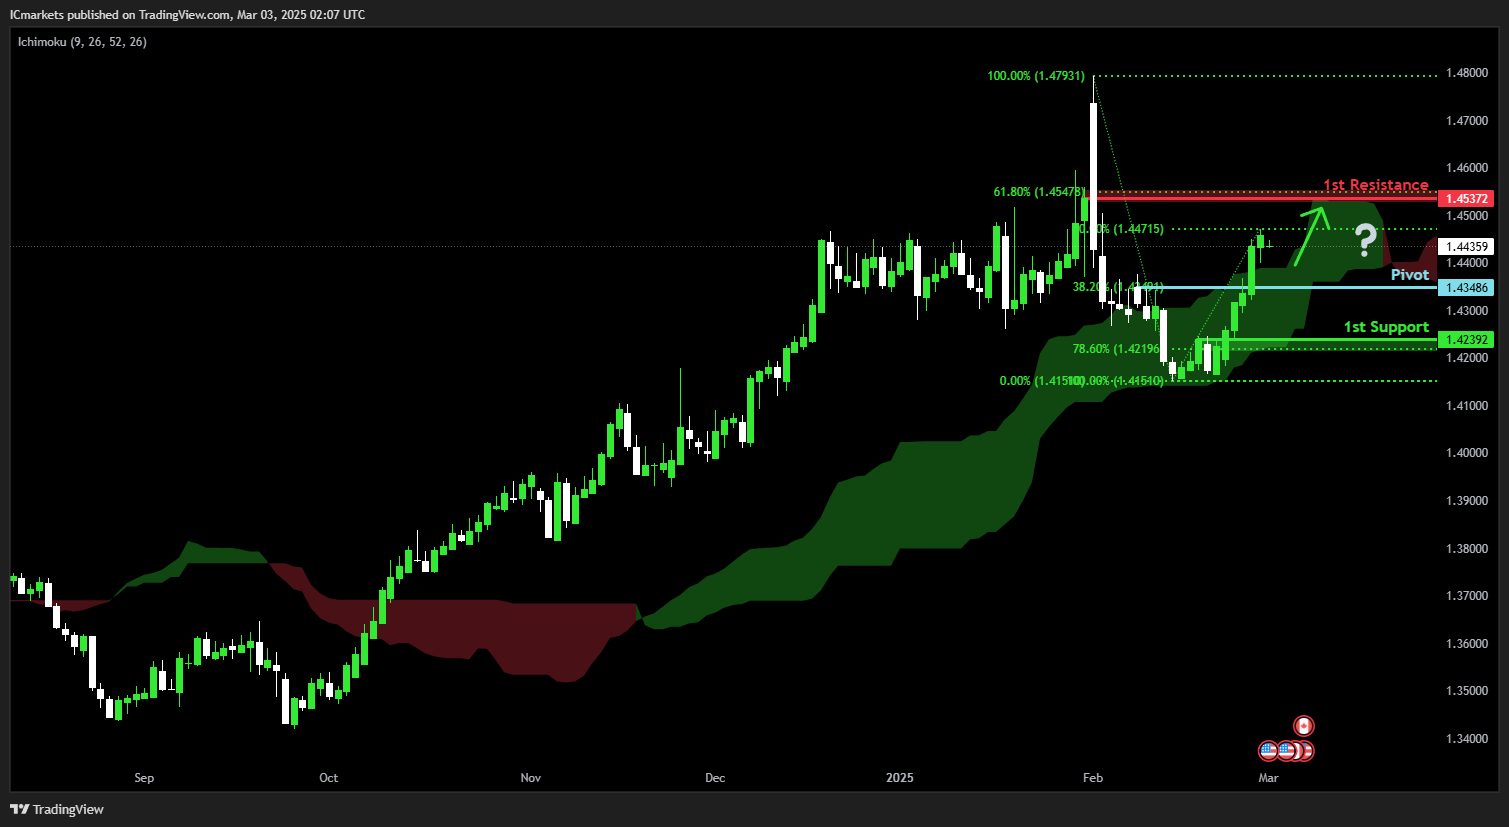
USD/CAD:
Potential Direction: Bullish
Overall momentum of the chart: Bullish
Price could fall towards the pivot and potentially make a bullish bounce off this level to rise towards the 1st resistance.
Pivot: 1.4348
Supporting reasons: Identified as a pullback support that aligns with a 38.2% Fibonacci retracement, indicating a potential area where buying interests could pick up to resume the uptrend. The presence of a green Ichimoku Cloud adds further significance to the strength of the bullish momentum.
1st support: 1.4239
Supporting reasons: Identified as a pullback support that aligns close to a 78.6% Fibonacci retracement, indicating a key level where the price could stabilize once more.
1st resistance: 1.4537
Supporting reasons: Identified as a pullback resistance that aligns close to a 61.8% Fibonacci retracement, indicating a potential area that could halt any further upward movement.
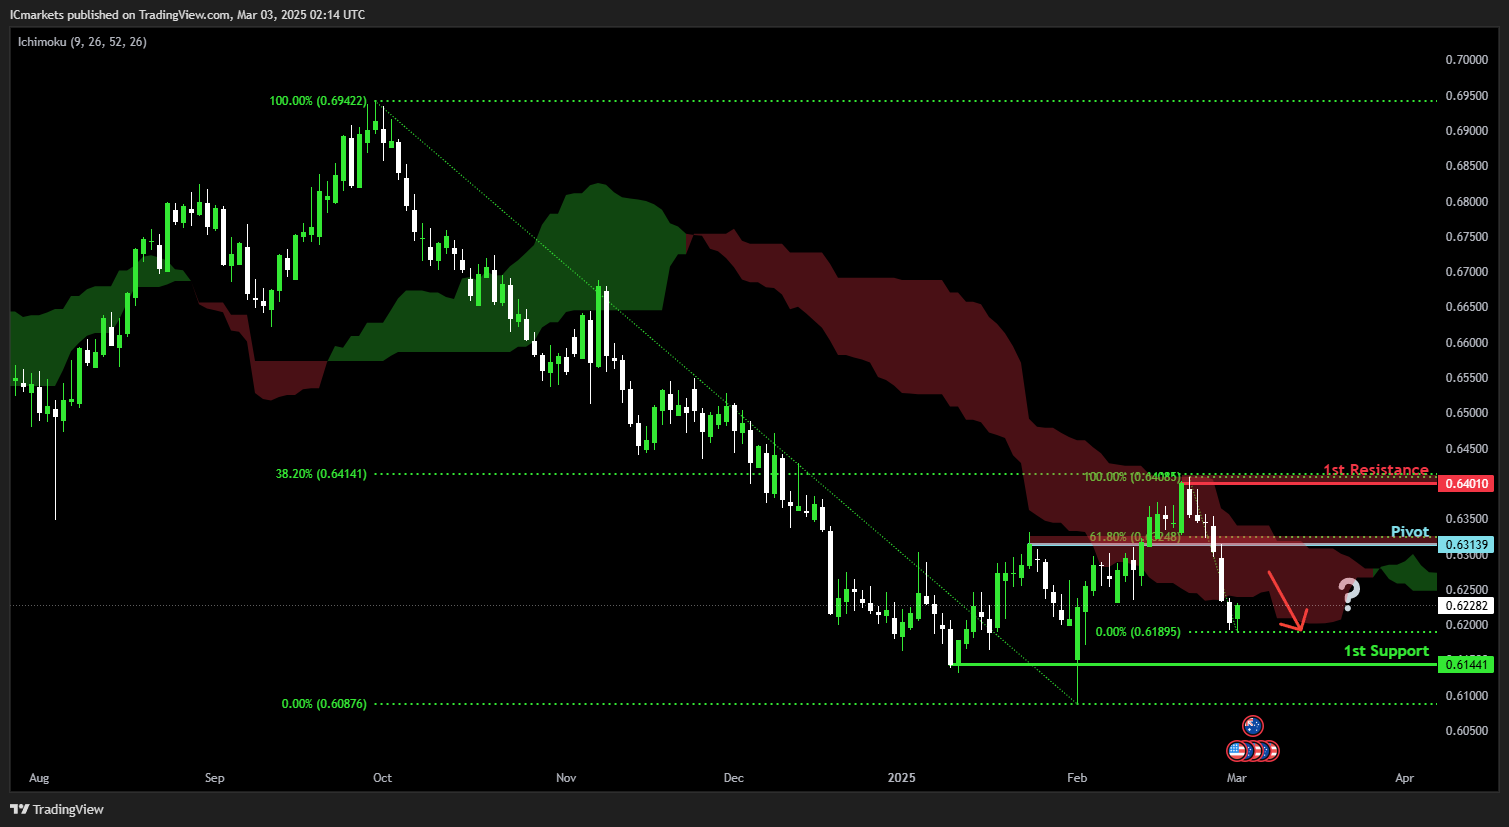
AUD/USD:
Potential Direction: Bearish
Overall momentum of the chart: Bearish
Price could rise towards the pivot and potentially make a bearish reversal off this level to fall towards the 1st support.
Pivot: 0.6313
Supporting reasons: Identified as a pullback resistance that aligns close to a 61.8% Fibonacci retracement, indicating a potential area where selling pressures could intensify. The presence of the red Ichimoku Cloud adds further significance to the strength of the bearish momentum.
1st support: 0.6144
Supporting reasons: Identified as a multi-swing-low support, suggesting a potential area where the price could stabilize once again.
1st resistance: 0.6401
Supporting reasons: Identified as a swing-high resistance that aligns close to a 38.2% Fibonacci retracement, indicating a potential area that could halt any further upward movement.
NZD/USD
Potential Direction: Bearish
Overall momentum of the chart: Bearish
Price could rise towards the pivot and potentially make a bearish reversal off this level to fall towards the 1st support.
Pivot: 0.5687
Supporting reasons: Identified as an overlap resistance that aligns close to a 61.8% Fibonacci retracement, indicating a potential area where selling pressures could intensify. The presence of the red Ichimoku Cloud adds further significance to the strength of the bearish momentum.
1st support: 0.5547
Supporting reasons: Identified as a swing-low support, suggesting a potential area where the price could stabilize once more.
1st resistance: 0.5761
Supporting reasons: Identified as a swing-high resistance, indicating a potential area that could halt any further upward movement.

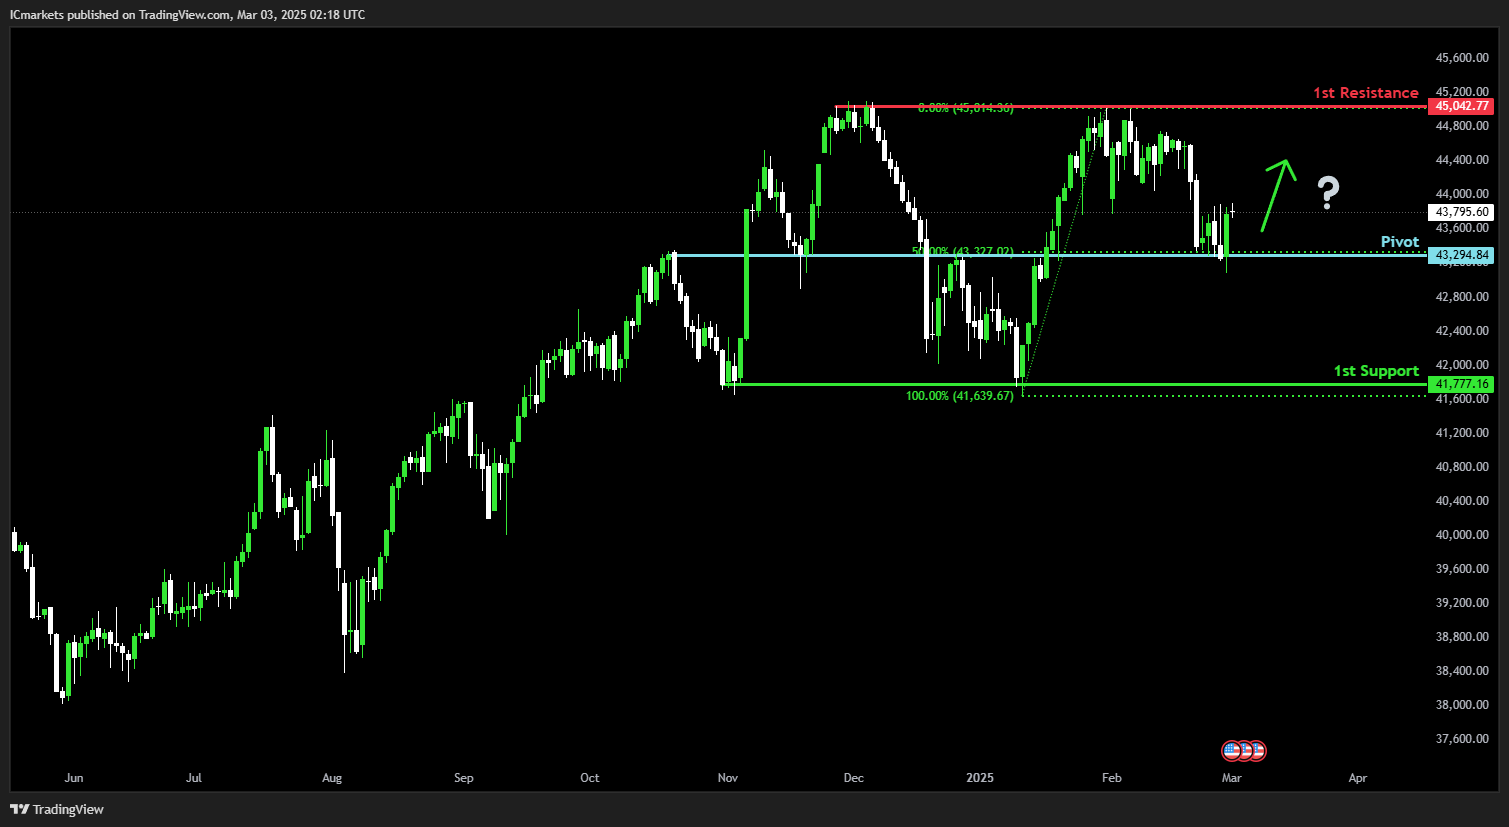
US30 (DJIA):
Potential Direction: Bullish
Overall momentum of the chart: Neutral
Price could fall towards the pivot and potentially make a bullish bounce off this level to rise towards the 1st resistance.
Pivot: 43,294.84
Supporting reasons: Identified as an overlap support that aligns with a 50% Fibonacci retracement, indicating a potential area where buying interests could pick up stage a rebound.
1st support: 41,777.16
Supporting reasons: Identified as a multi-swing-low support, indicating a potential level where the price could stabilize once again.
1st resistance: 45,042.77
Supporting reasons: Identified as a multi-swing-high resistance, indicating a potential area that could halt any further upward movement.
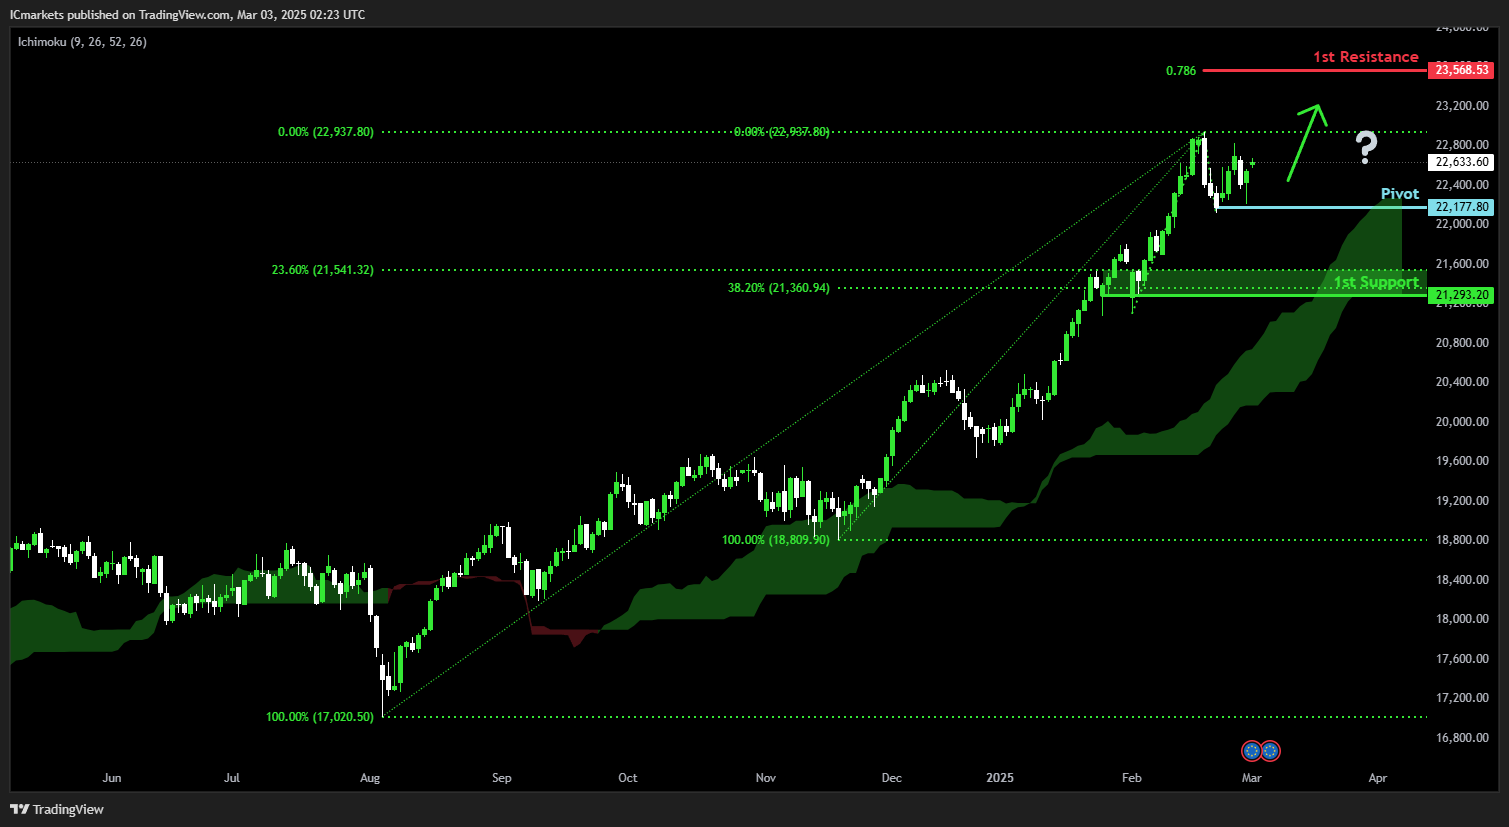
DE40 (DAX):
Potential Direction: Bullish
Overall momentum of the chart: Bullish
Price could fall towards the pivot and potentially make a bullish bounce off this level to rise towards the 1st resistance.
Pivot: 22,177.80
Supporting reasons: Identified as a swing-low support, indicating a potential area where buying interests could pick up to resume the uptrend. The presence of a green Ichimoku Cloud adds further significance to the strength of the bullish momentum.
1st support: 21,293.20
Supporting reasons: Identified as a multi-swing-low support that aligns with a confluence of Fibonacci levels i.e. the 23.6% and 38.2% retracements, indicating a key level where the price could stabilize once more.
1st resistance: 22,568.53
Supporting reasons: Identified as a resistance that aligns with a 78.6% Fibonacci projection, indicating a potential area that could halt any further upward movement.
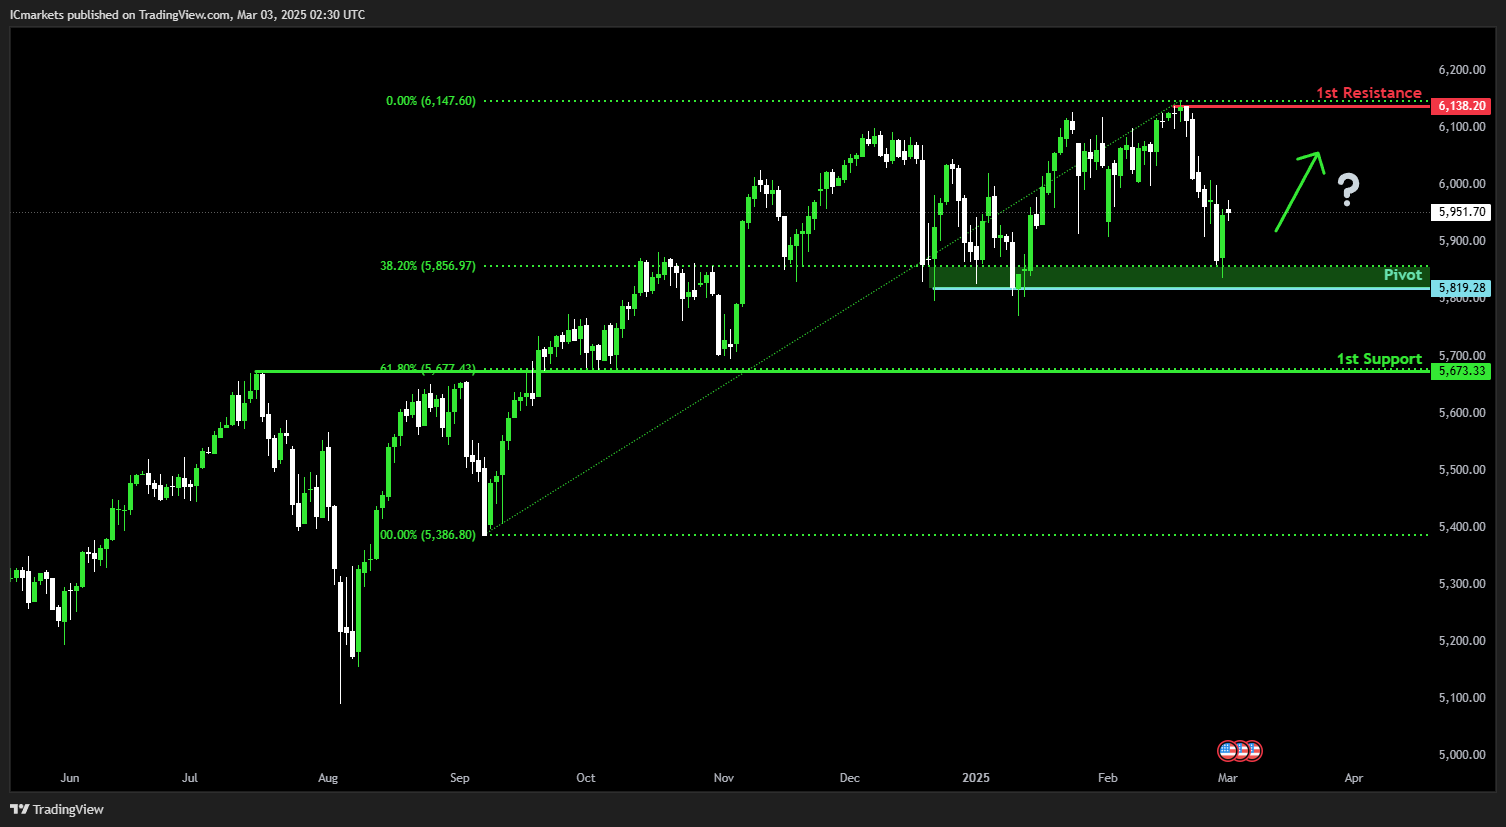
US500 (S&P 500):
Potential Direction: Bullish
Overall momentum of the chart: Neutral
Price could fall towards the pivot and potentially make a bullish bounce off this level to rise towards the 1st resistance.
Pivot: 5,819.28
Supporting reasons: Identified as a multi-swing-low support that aligns close to a 38.2% Fibonacci retracement, indicating a potential area where buying interests could pick up to stage a rebound.
1st support: 5,673.33
Supporting reasons: Identified as an overlap support that aligns with a 61.8% Fibonacci retracement, indicating a potential level where the price could stabilize once again.
1st resistance: 6,138.20
Supporting reasons: Identified as a swing-high resistance that aligns close to the all-time high, indicating a potential area that could halt any further upward movement.
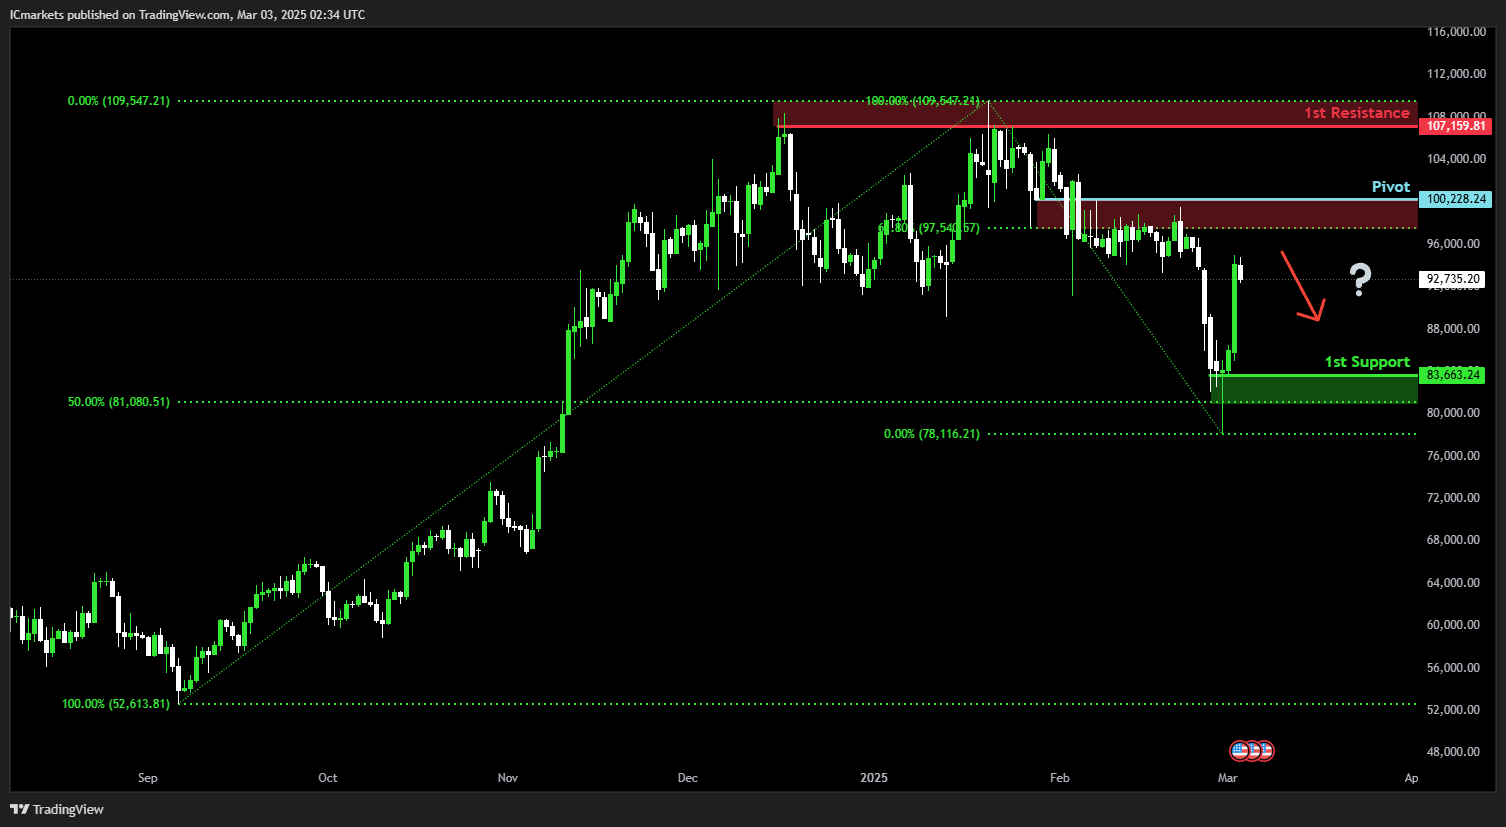
BTC/USD (Bitcoin):
Potential Direction: Bearish
Overall momentum of the chart: Bearish
Price could rise towards the pivot and potentially make a bearish reversal off this level to fall towards the 1st support.
Pivot: 100,228.24
Supporting reasons: Identified as an overlap resistance that aligns close to a 61.8% Fibonacci retracement, indicating a potential area where selling pressures could intensify.
1st support: 83,663.24
Supporting reasons: Identified as a swing-low support that aligns close to a 50% Fibonacci retracement, indicating a potential level where the price could stabilize once more.
1st resistance: 107,158.91
Supporting reasons: Identified as a multi-swing-high resistance that aligns close to the all-time high, indicating a potential area that could halt any further upward movement.
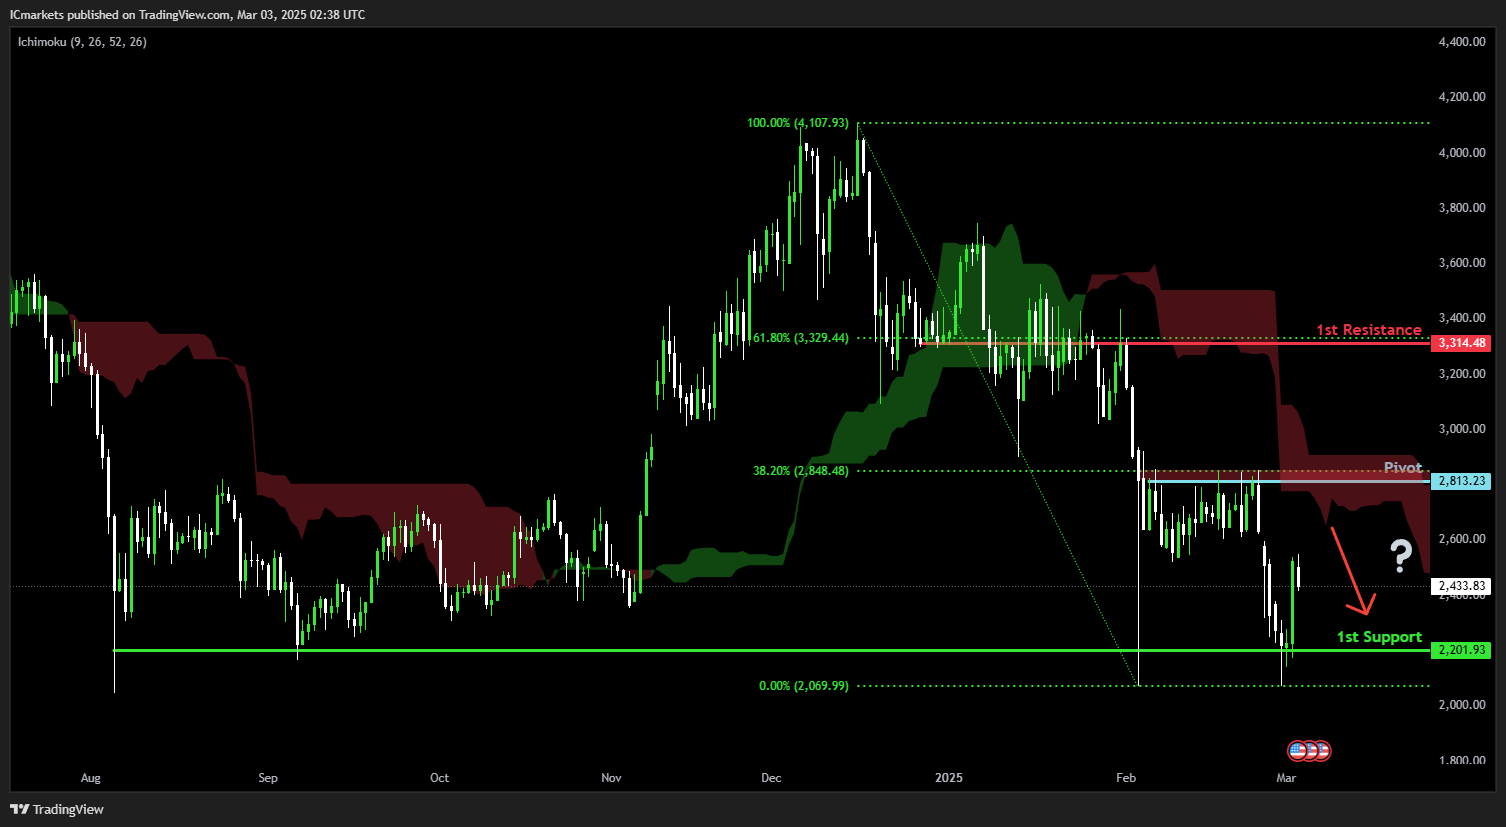
ETH/USD (Ethereum):
Potential Direction: Bearish
Overall momentum of the chart: Bearish
Price could rise towards the pivot and potentially make a bearish reversal off this level to fall towards the 1st support.
Pivot: 2,813.23
Supporting reasons: Identified as a pullback resistance that aligns close to a 38.2% Fibonacci retracement, indicating a potential area where selling pressures could intensify. The presence of the red Ichimoku Cloud adds further significance to the strength of the bearish momentum.
1st support: 2,201.93
Supporting reasons: Identified as a multi-swing-low support, indicating a potential level where the price could stabilize once again.
1st resistance: 3,314.48
Supporting reasons: Identified as an overlap resistance that aligns close to a 61.8% Fibonacci retracement, indicating a potential area that could halt any further upward movement.
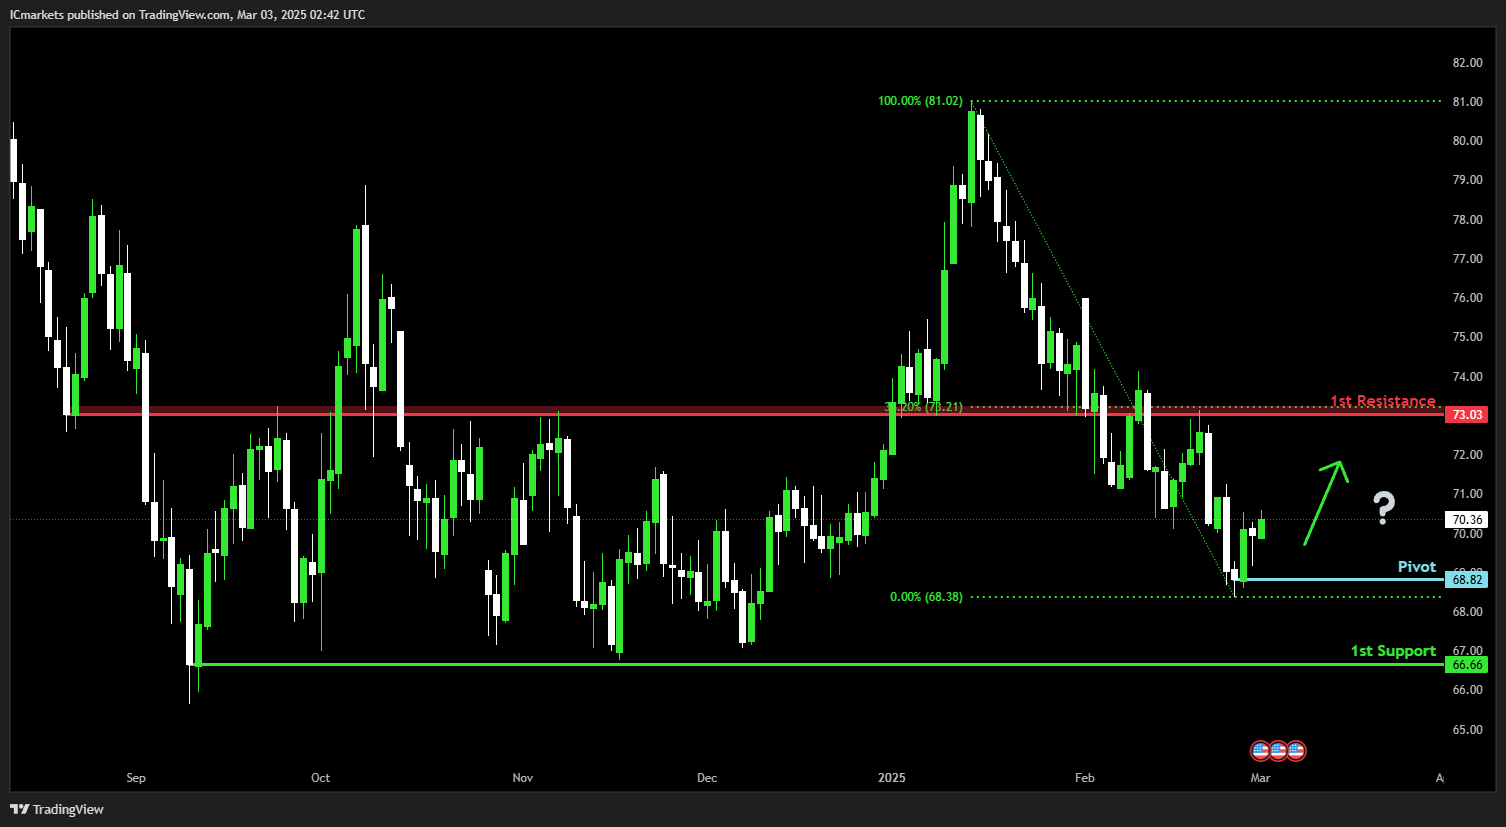
WTI/USD (Oil):
Potential Direction: Bullish
Overall momentum of the chart: Bearish
Price could fall towards the pivot and potentially make a bullish bounce off this level to rise towards the 1st resistance.
Pivot: 68.82
Supporting reasons: Identified as a swing-low support, indicating a potential area where buying interests could pick up to stage a rebound.
1st support: 66.66
Supporting reasons: Identified as a multi-swing-low support, indicating a key level where the price could stabilize once more.
1st resistance: 73.03
Supporting reasons: Identified as an overlap resistance that aligns close to a 38.2% Fibonacci retracement, indicating a potential area that could halt any further upward movement.
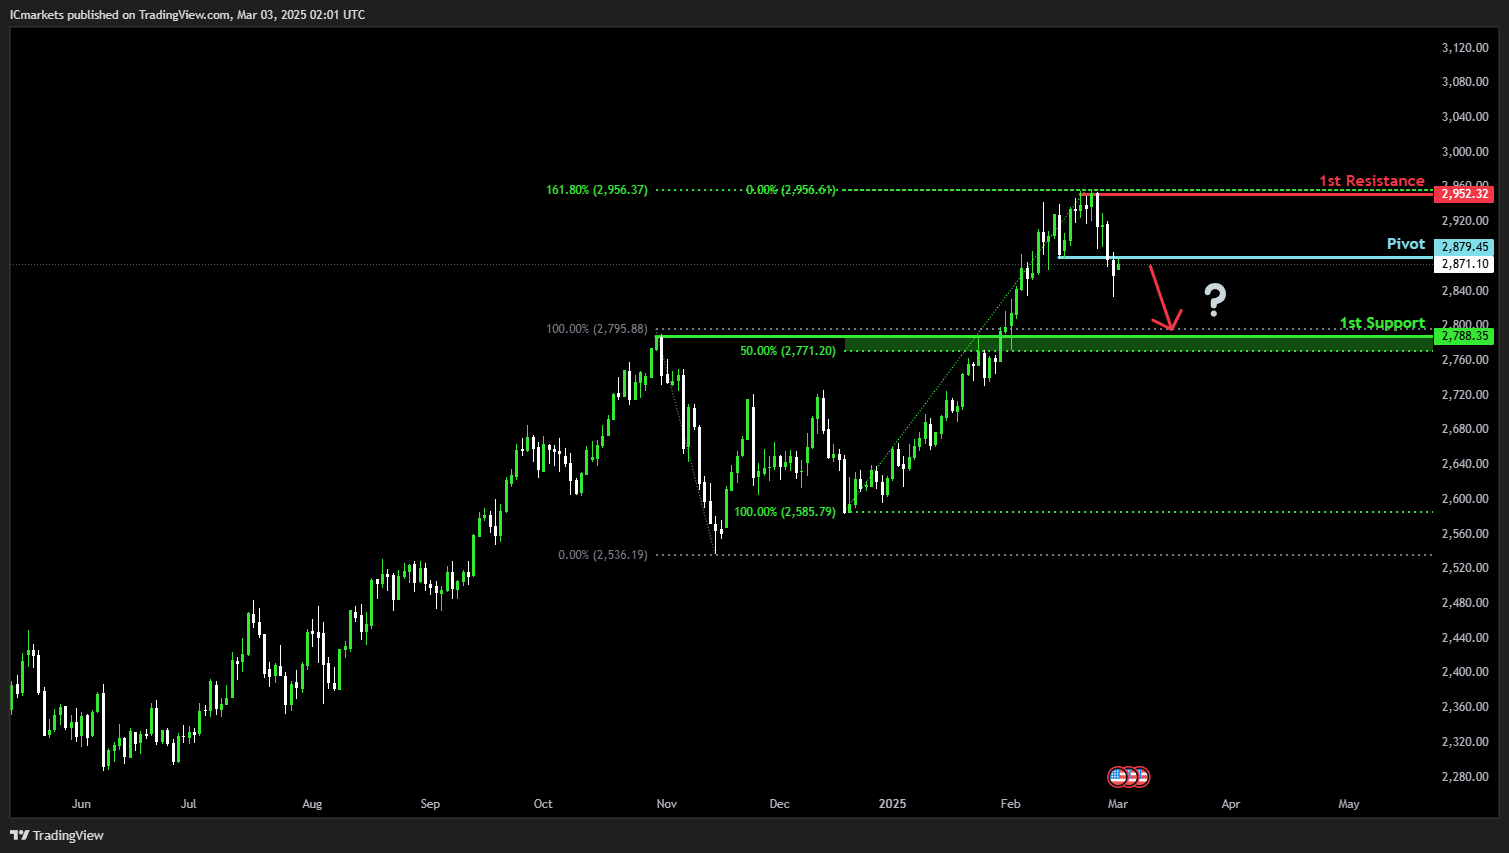
XAU/USD (GOLD):
Potential Direction: Bearish
Overall momentum of the chart: Bullish
Price could potentially make a bearish reversal off the pivot and fall toward the 1st support.
Pivot: 2879.45
Supporting reasons: Identified as a pullback resistance, indicating a potential area where selling pressure could emerge.
1st support: 2788.35
Supporting reasons: Identified as a pullback support that aligns with the 50% Fibonacci retracement, acting as a potential level where price could stabilize before continuing higher.
1st resistance: 2952.32
Supporting reasons: Identified as a swing high resistance that aligns with the 161.8% Fibonacci extension, indicating a potential level where price could face selling pressure.
The accuracy, completeness and timeliness of the information contained on this site cannot be guaranteed. IC Trading does not warranty, guarantee or make any representations, or assume any liability regarding financial results based on the use of the information in the site.
News, views, opinions, recommendations and other information obtained from sources outside of www.ictrading.com, used in this site are believed to be reliable, but we cannot guarantee their accuracy or completeness. All such information is subject to change at any time without notice. IC Trading assumes no responsibility for the content of any linked site.
The fact that such links may exist does not indicate approval or endorsement of any material contained on any linked site. IC Trading is not liable for any harm caused by the transmission, through accessing the services or information on this site, of a computer virus, or other computer code or programming device that might be used to access, delete, damage, disable, disrupt or otherwise impede in any manner, the operation of the site or of any user’s software, hardware, data or property.