Updated June 2020
The world’s most heavily traded currencies are the US dollar (USD), euro (EUR), Japanese yen (JPY), British pound (GBP), Australian dollar (AUD), Canadian dollar (CAD) and the Swiss franc (CHF)[1]. These are major currencies.
The Forex market, however, trades in pairs – two currencies.
Among other currency pairs, EUR/USD, GBP/USD and AUD/USD are considered traditional major currency pairs.
The base currency is the first currency that appears in a currency pair quotation. The EUR (bold) is a base currency. Base currencies always represent one unit. The quote currency, or counter currency, is the second currency in a quotation: the USD (underscored) – determines the value of the base currency.
Imagine EUR/USD trades at $1.30.
$1.30, therefore, is the amount of quote currency, in USD, it takes to equal one unit of the base currency, EUR.
EUR/USD:
According to the 2019 Triennial Survey of turnover in OTC FX markets[2], the US dollar retained its dominant currency status, being on one side of 88% of all trades. The share of trades with the euro on one side expanded somewhat, to 32%. By contrast, the share of trades involving the Japanese yen fell some 5 percentage points, although the yen remained the third most actively traded currency (on one side of 17% of all trades).
In addition, more than 60% of foreign exchange reserves are denominated in dollars and 20% in euro, according to the International Monetary Fund (IMF)[3].
Given the above, and the fact the euro and dollar represent the most heavily traded currencies, EUR/USD remains the most actively traded currency pair in the Forex market. This is also largely due to Europe, particularly Germany, and the US making up two of the largest economies in the world[4].
The pair tends to gain traction heading into the London open. Volume typically continues throughout London, following into the US segment though tends to level off somewhat during the US afternoon. The overlap, when New York and London’s financial centres are both open (13.00-16.00 GMT), are times you’ll also notice a pick-up in volume.
This market tends to respond aggressively to central bank movement, the United States Federal Reserve and the European Central Bank. Interest rate differentials can also influence the currency rate. Additionally, inflation, GDP, trade balance, retail sales data and, in particular, the monthly US employment figures can spark a reaction.
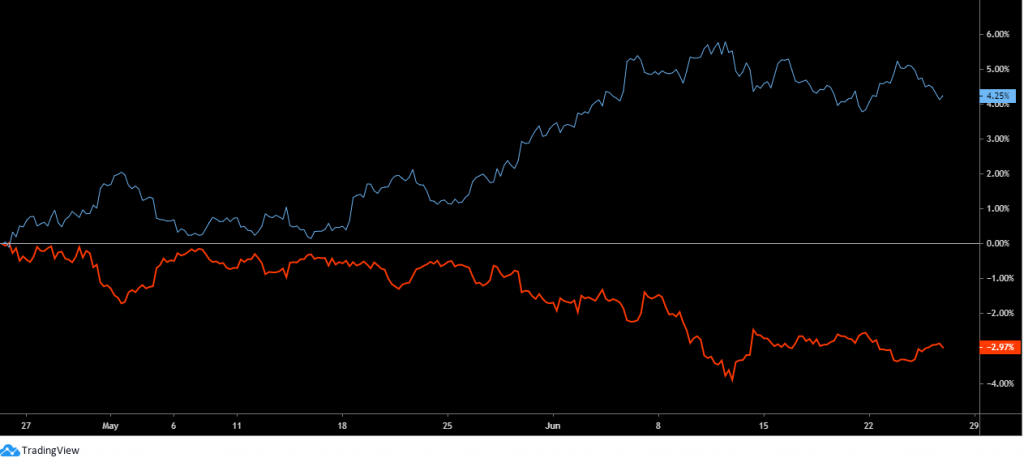
As shown in figure A, it is common to see EUR/USD inversely correlate with USD/CHF.
(Fig A – USD/CHF [orange] EUR/USD [blue])
GBP/USD:
The GBP/USD currency pair quotation reveals the value of one British pound in US dollars.
If the pair trades at $1.40, this is the price to purchase one British pound.
According to the 2019 Triennial Survey of turnover in OTC FX markets, the market share for the British pound in April 2019 was unchanged from its 2016 value at 13%[5].
In addition, approximately 5% of foreign exchange reserves are denominated in British pounds (IMF)[6].
GBP/USD is sensitive to events out of the UK and the US, in particular announcements and speeches from the Bank of England (BoE) and US Federal Reserve. The interest rate differential between the two central banks can also affect the value of the currency pair.
Like EUR/USD, economic indicators such as inflation, GDP, trade balance, retail sales and employment figures can have a marked effect on volatility and the GBP/USD’s direction.
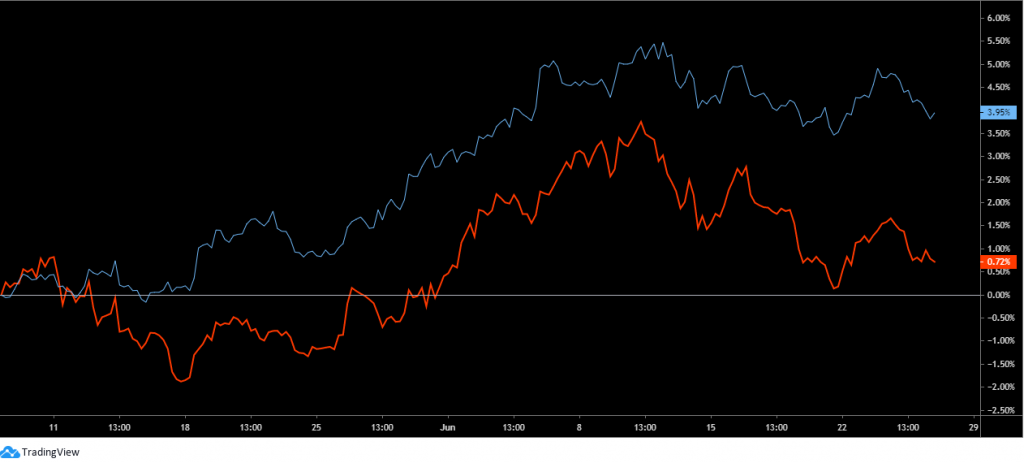
GBP/USD also has a tendency to correlate with the EUR/USD (figure B).
(Fig B – GBP/USD [orange] EUR/USD [blue])
AUD/USD:
The AUD/USD currency pair quotation informs the value of one Australian dollar in US dollars.
If the pair trades at $1.10, this is the price to purchase one Australian dollar.
According to the 2019 Triennial Survey of turnover in OTC FX markets, the market share for the Australian dollar in April 2019 was unchanged from its 2016 value at 7%[7]. In terms of foreign exchange reserves, approximately 2% is denominated in Australian dollars[8].
Interest rate differentials between the US Federal Reserve (Fed) and the Reserve Bank of Australia (RBA) can impact AUD/USD rates. High-impacting economic events that can affect AUD/USD are GDP data, employment, retail sales, trade balance and inflation.
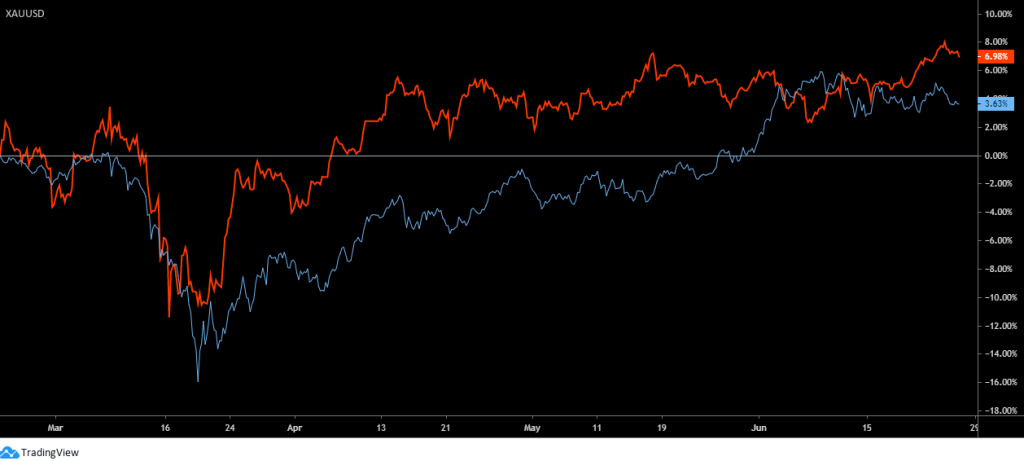
A notable correlation between AUD/USD and gold is also visible. As the world’s second-largest producer of gold[9], you’ll often find AUD/USD and gold prices trade similarly (figure C).
(Fig C – XAU/USD [orange] AUD/USD [blue])
In Closing
Although the Forex market has several pairs to choose from, the above three are some of the most traded. Does this mean you should only look to trade these units? No.
There is an overabundance of minor and exotic currency pairs to choose from, like the EUR/GBP, EUR/AUD and USD/SEK (Swedish Krona).
Why limit the opportunities?
The accuracy, completeness and timeliness of the information contained on this site cannot be guaranteed. IC Trading does not warranty, guarantee or make any representations, or assume any liability regarding financial results based on the use of the information in the site.
News, views, opinions, recommendations and other information obtained from sources outside of www.ictrading.com.au, used in this site are believed to be reliable, but we cannot guarantee their accuracy or completeness. All such information is subject to change at any time without notice. IC Trading assumes no responsibility for the content of any linked site.
The fact that such links may exist does not indicate approval or endorsement of any material contained on any linked site. IC Trading is not liable for any harm caused by the transmission, through accessing the services or information on this site, of a computer virus, or other computer code or programming device that might be used to access, delete, damage, disable, disrupt or otherwise impede in any manner, the operation of the site or of any user’s software, hardware, data or property.
[1] https://www.bis.org/statistics/rpfx19_fx.pdf
[2] https://www.bis.org/statistics/rpfx19_fx.pdf
[3] https://data.imf.org/?sk=E6A5F467-C14B-4AA8-9F6D-5A09EC4E62A4
[4] https://www.worldometers.info/gdp/gdp-by-country/
[5] https://www.bis.org/statistics/rpfx19_fx.pdf
[6] https://data.imf.org/?sk=E6A5F467-C14B-4AA8-9F6D-5A09EC4E62A4
[7] https://www.bis.org/statistics/rpfx19_fx.pdf
[8] https://data.imf.org/?sk=E6A5F467-C14B-4AA8-9F6D-5A09EC4E62A4
[9] https://www.gold.org/goldhub/data/historical-mine-production


