To say the US dollar is important is an understatement.
According to the 2019 Triennial Survey of turnover in OTC FX markets[1], the US dollar retained its dominant currency status, on one side of 88% of all trades. Additionally, more than 60% of foreign exchange reserves are denominated in dollars, according to the International Monetary Fund (IMF)[2].
Traditional major currency pairs also include the US dollar. On top of this, the greenback is the standard currency in the commodity market and therefore directly impacts commodity prices.
What Is the US Dollar Index?
The majority of traders understand how support and resistance levels are applied on charts and also know how to read technical indicators, such as the relative strength index (RSI). Another tool that deserves mention, however, is the US dollar index.
Developed in March 1973 by the United States Federal Reserve, the US dollar index, or more commonly referred to as the ‘DXY’ (ticker symbol used by Bloomberg’s Terminal) or ‘USDX’, is a measure of the value of the US dollar against a basket of six major currencies.
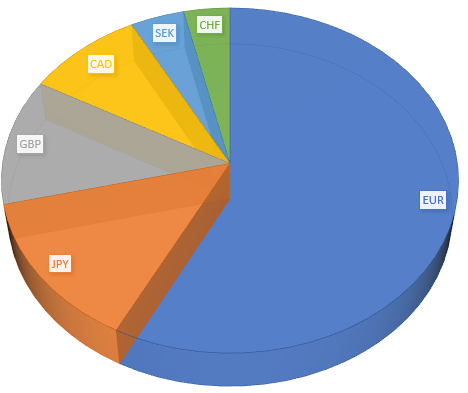
In terms of weighting, the euro (EUR) controls the largest percentage share at approximately 57.6%. This is followed by the Japanese yen (JPY) at 13.7%, the British pound (GBP) at 11.9%, the Canadian dollar (CAD) at 9.1%, the Swedish Krona (SEK) at 4.2% and the Swiss franc (CHF) at 3.6%.
Since its inception, the index achieved all-time highs at 164.72 and lows as far south as 70.69. If you’re familiar with standard stock indices, such as the Dow Jones Industrial Average, the S&P 500 and FTSE 100, the DXY operates similarly, only using currencies as opposed to equities.
Using the DXY
The DXY provides a way of measuring USD strength.
- Currency pairs with the US dollar representing the base currency (the first currency in a pair’s quotation – USD/CHF, for example) may be an attractive buy if the DXY is oversold. Similarly, selling these markets is appealing if the DXY is overbought.
- If, on the other hand, the USD represents the quote currency (the second currency in a pair’s quotation –EUR/USD or GBP/USD), buying these currency pairs may be appealing if the DXY registers overbought conditions. And, similarly, traders may consider selling these markets if the DXY puts forward an oversold reading.
Each trader is different, and will have a different idea of what constitutes oversold and overbought conditions.
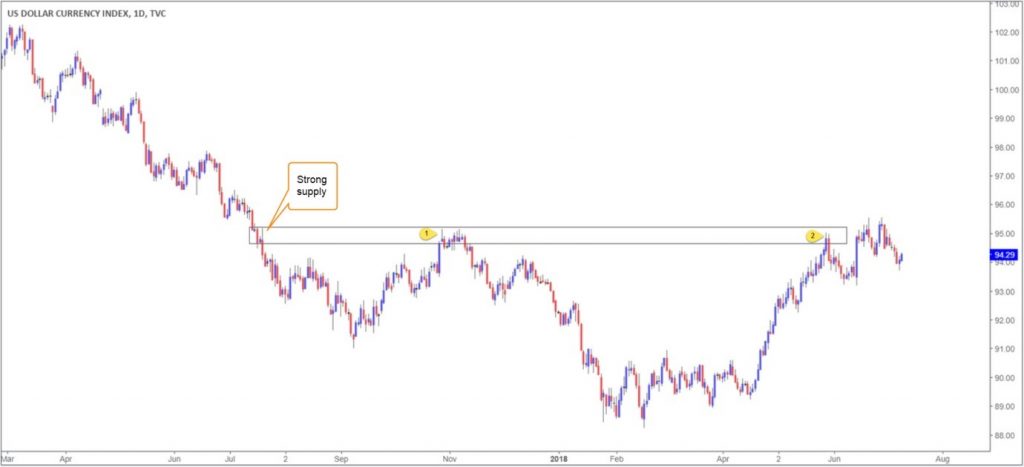
Those who favour supply and demand, a popular approach involving price action, will note supply drawn on the DXY held price lower at point 1, in figure A. Selling off from this area denotes a USD overbought condition, serving as a warning signal. Therefore, would you be bullish the greenback at point 2? No.
(Figure A)
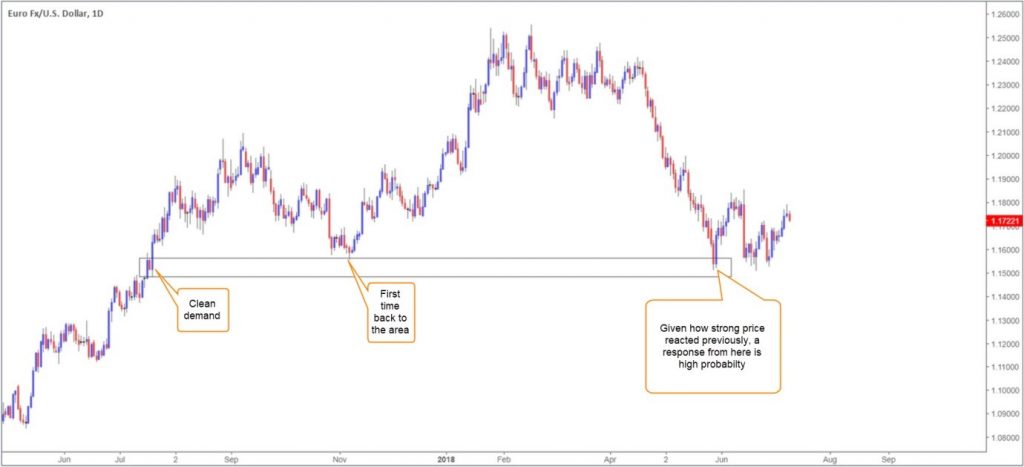
If we know the dollar is likely to turn lower at point 2 on the DXY, prudent traders may look to bid currency pairs containing a USD quote currency. The EUR/USD (figure B), for example, offered a trading opportunity to buy demand on its second retest, converging with supply on the DXY.
(Figure B)
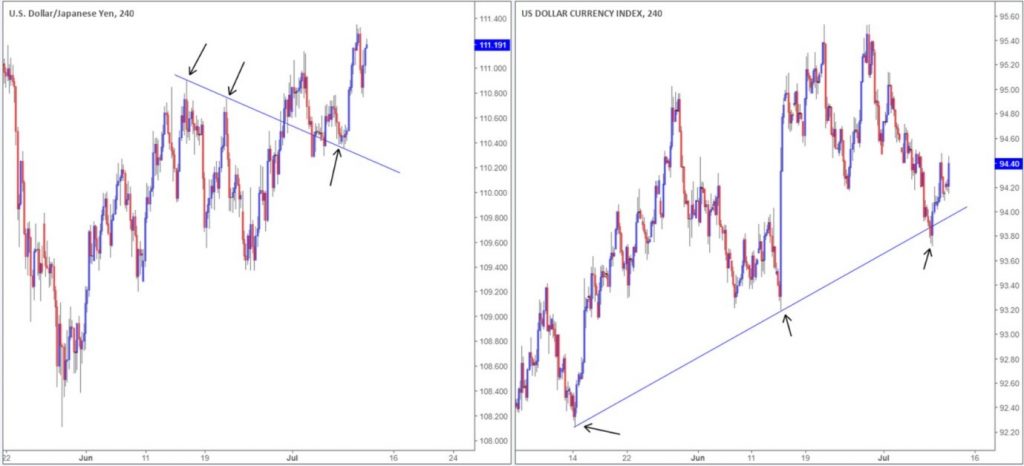
As demonstrated in figure C, you can also use trend line studies between the DXY and currency pairs to determine USD overbought/oversold conditions.
Figure C is a reasonably simple chart. On the right, the US dollar index displays trend line support. The last test of the trend line would have had traders drawn to USD-base currency pairs for possible long trades. The left side of the chart shows USD/JPY trading off trend line support at the same time. Given the convergence, a USD/JPY bid would have been high probability.
(Figure C)
Other Tools
You can use any tool you feel offers the clearest perspective in terms of overbought and oversold conditions on the DXY. It does not have to be supply and demand or trend lines.
Knowing where the DXY is positioned is important. It adds weight to trade setups.
Feel free to experiment with different technical tools. You might find technical indicators are more suited to identify DXY overbought/oversold conditions, rather than price action.
The accuracy, completeness and timeliness of the information contained on this site cannot be guaranteed. IC Trading does not warranty, guarantee or make any representations, or assume any liability regarding financial results based on the use of the information in the site.
News, views, opinions, recommendations and other information obtained from sources outside of www.ictrading.com.au, used in this site are believed to be reliable, but we cannot guarantee their accuracy or completeness. All such information is subject to change at any time without notice. IC Trading assumes no responsibility for the content of any linked site.
The fact that such links may exist does not indicate approval or endorsement of any material contained on any linked site. IC Trading is not liable for any harm caused by the transmission, through accessing the services or information on this site, of a computer virus, or other computer code or programming device that might be used to access, delete, damage, disable, disrupt or otherwise impede in any manner, the operation of the site or of any user’s software, hardware, data or property.
[1] https://www.bis.org/statistics/rpfx19_fx.pdf
[2] https://data.imf.org/?sk=E6A5F467-C14B-4AA8-9F6D-5A09EC4E62A4


