
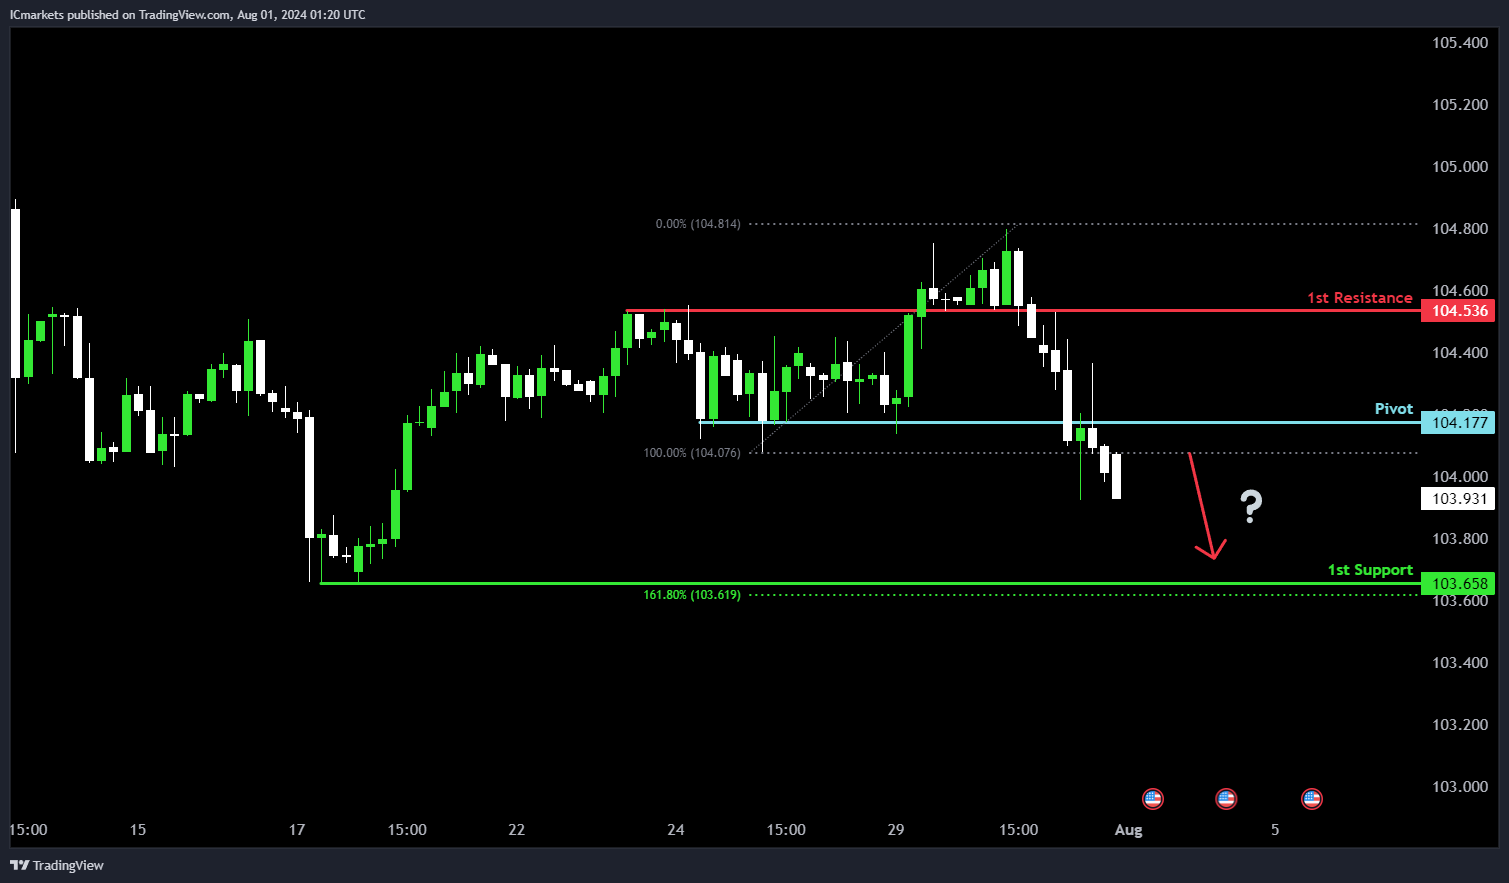
DXY (US Dollar Index):
Potential Direction: Bearish
Price could potentially make a bearish continuation towards 1st support.
Pivot: 104.17
Supporting reasons: Identified as an overlap resistance level, indicating a potential area where sellers could enter the market after a retracement.
1st support: 103.65
Supporting reasons: Identified as a swing low support level, specifically at the 161.80% Fibonacci Extension, suggesting a significant area where previous declines have found support.
1st resistance: 104.53
Supporting reasons: Identified as an overlap resistance level, indicating a historical point where previous rallies have faced selling pressure or reversed.
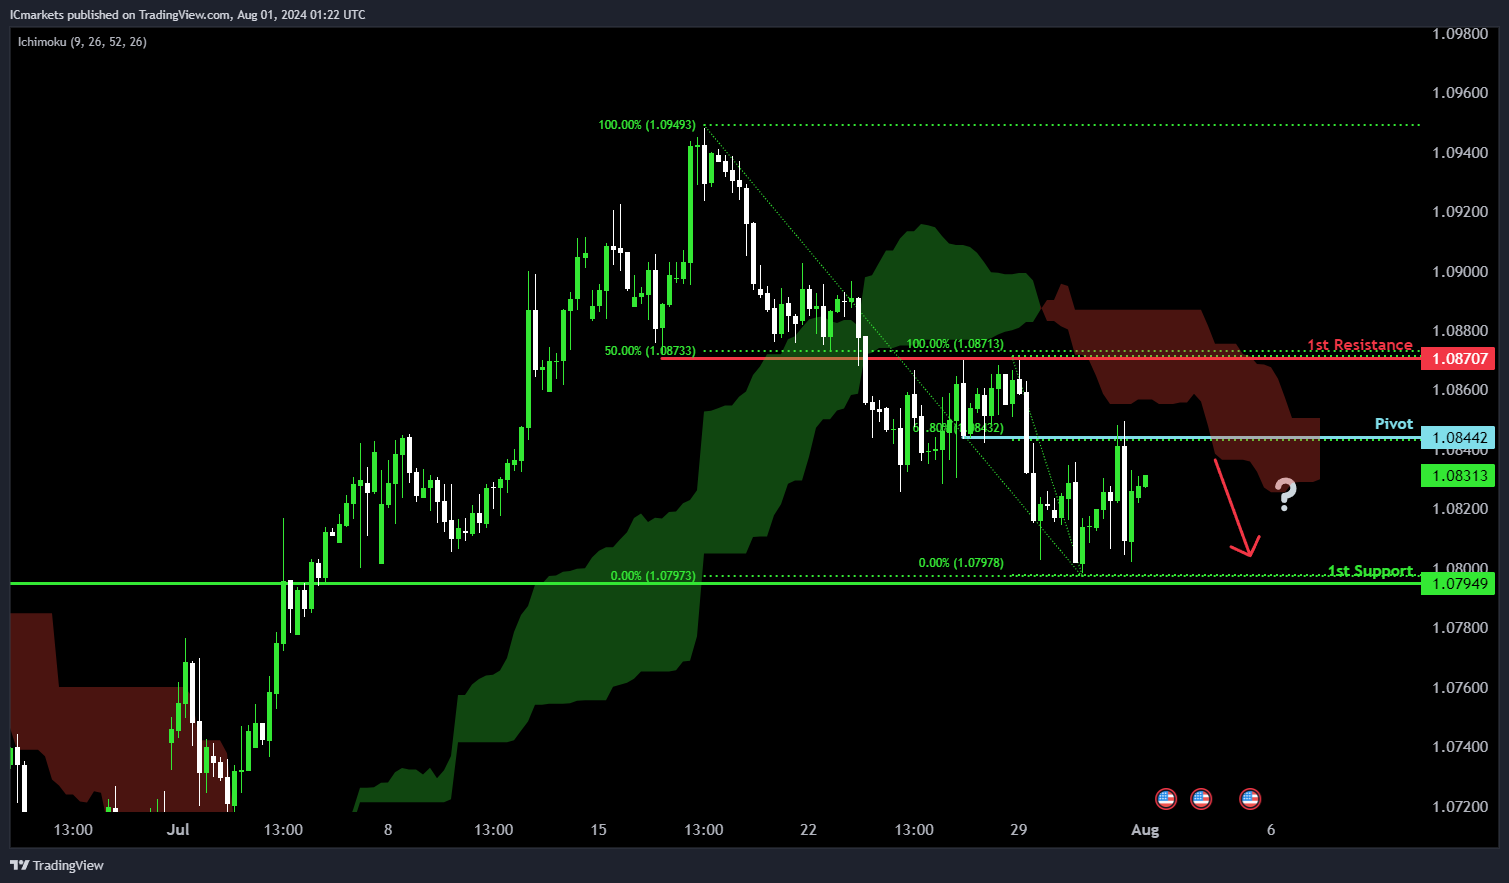
EUR/USD:
Potential Direction: Bearish
Overall momentum of the chart: Bearish
Factors contributing to the momentum: Price is below the bearish Ichimoku cloud
Price could potentially make a bearish reaction off pivot and drop to 1st support.
Pivot: 1.0844
Supporting reasons: Identified as an overlap resistance level, specifically at the 61.80% Fibonacci Retracement, indicating a potential area where sellers could enter the market after a retracement.
1st support: 1.0794
Supporting reasons: Identified as an overlap support level, suggesting a significant area where previous declines have found support.
1st resistance: 1.0870
Supporting reasons: Identified as an overlap resistance level, specifically at the 50% Fibonacci Retracement, indicating a historical point where previous rallies have faced selling pressure or reversed.
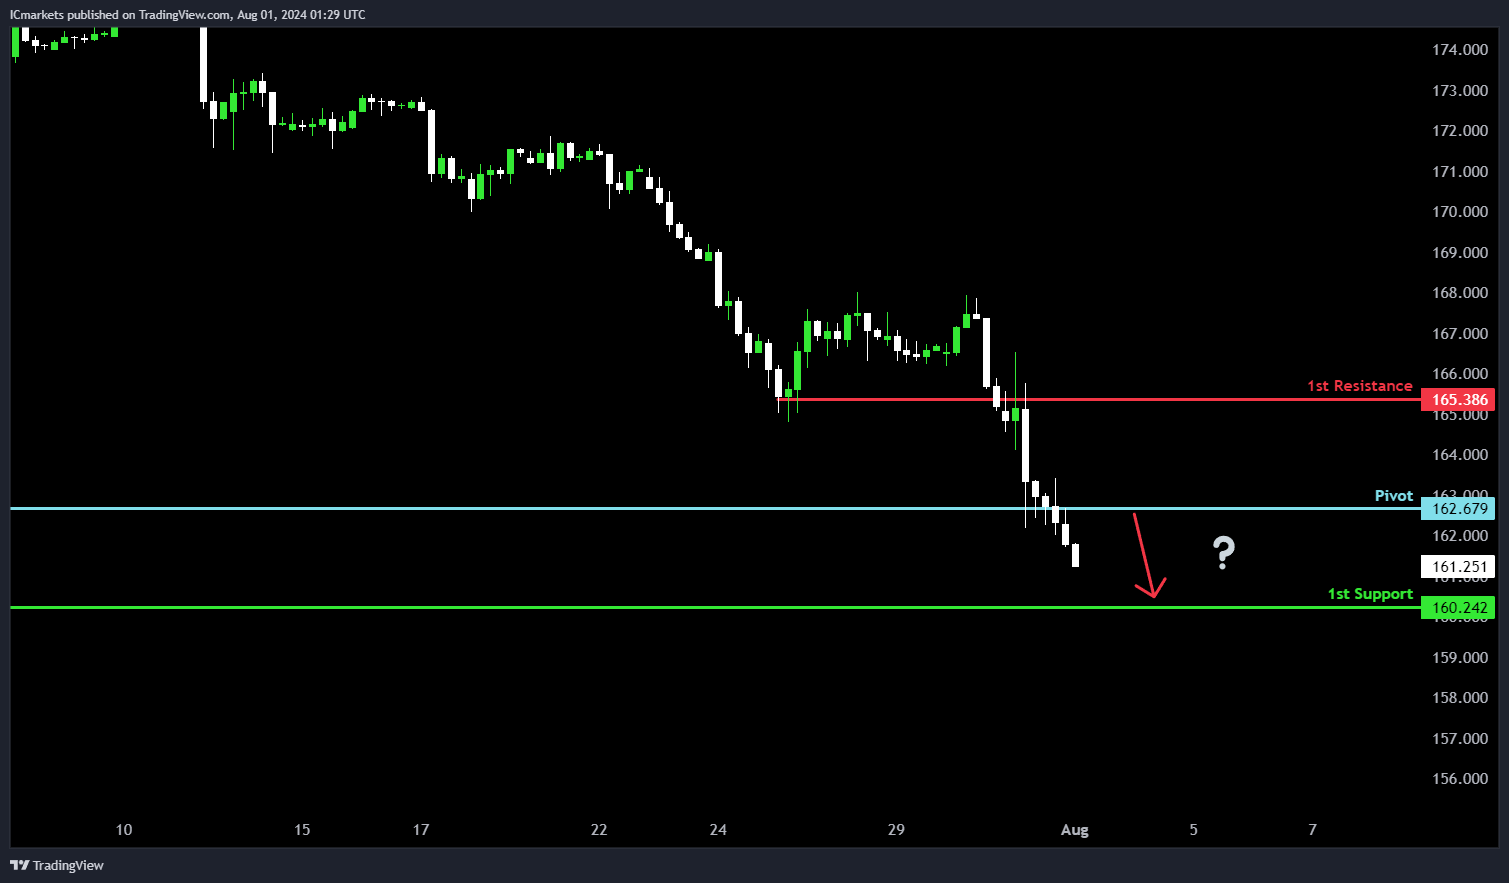
EUR/JPY:
Potential Direction: Bearish
Overall momentum of the chart: Bearish
Price could potentially make a bearish continuation towards 1st support.
Pivot: 162.67
Supporting reasons: Identified as an overlap resistance level, indicating a potential area where sellers could enter the market after a retracement.
1st support: 160.24
Supporting reasons: Identified as an overlap support level, suggesting a significant area where previous declines have found support.
1st resistance: 165.38
Supporting reasons: Identified as an overlap resistance level, indicating a historical point where previous rallies have faced selling pressure or reversed.
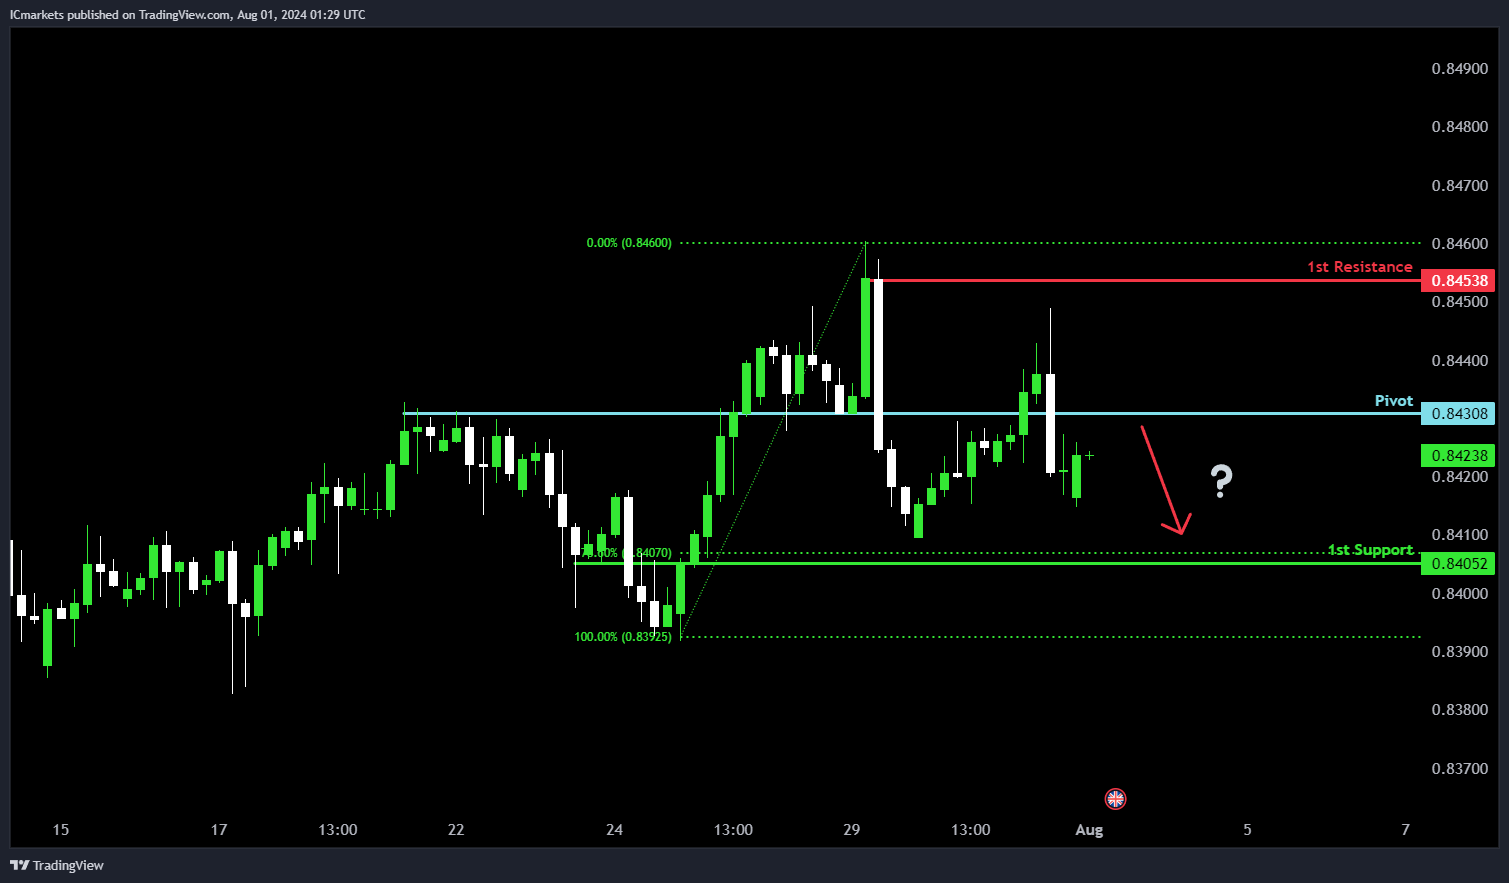
EUR/GBP:
Potential Direction: Bearish
Overall momentum of the chart: Bearish
Price could potentially make a bearish reaction off pivot and drop to 1st support.
Pivot: 0.8430
Supporting reasons: Identified as an overlap resistance level, indicating a potential area where sellers could enter the market after a retracement.
1st support: 0.8405
Supporting reasons: Identified as a pullback support level, specifically at the 78.60% Fibonacci Retracement, suggesting a significant area where previous declines have found support.
1st resistance: 0.8453
Supporting reasons: Identified as a swing high resistance level, indicating a historical point where previous rallies have faced selling pressure or reversed.
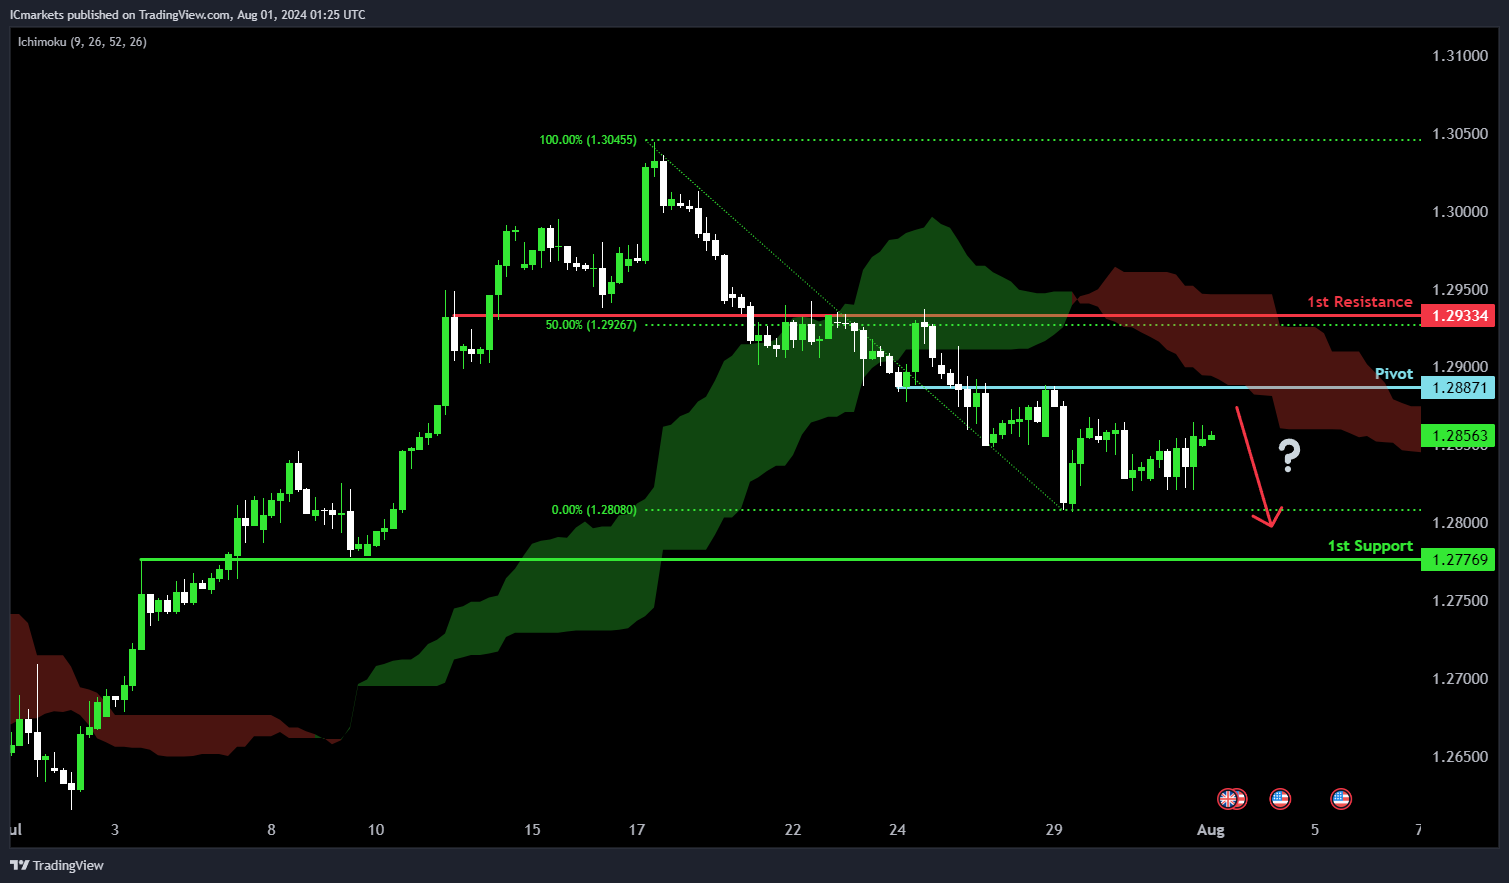
GBP/USD:
Potential Direction: Bearish
Overall momentum of the chart: Bearish
Factors contributing to the momentum: Price is below the bearish Ichimoku cloud
Price could potentially make a bearish reaction off pivot and drop to 1st support.
Pivot: 1.2887
Supporting reasons: Identified as an overlap resistance level, indicating a potential area where sellers could enter the market after a retracement.
1st support: 1.2776
Supporting reasons: Identified as an overlap support level, suggesting a significant area where previous declines have found support.
1st resistance: 1.2933
Supporting reasons: Identified as an overlap resistance level, specifically at the 50% Fibonacci Retracement, indicating a historical point where previous rallies have faced selling pressure or reversed.
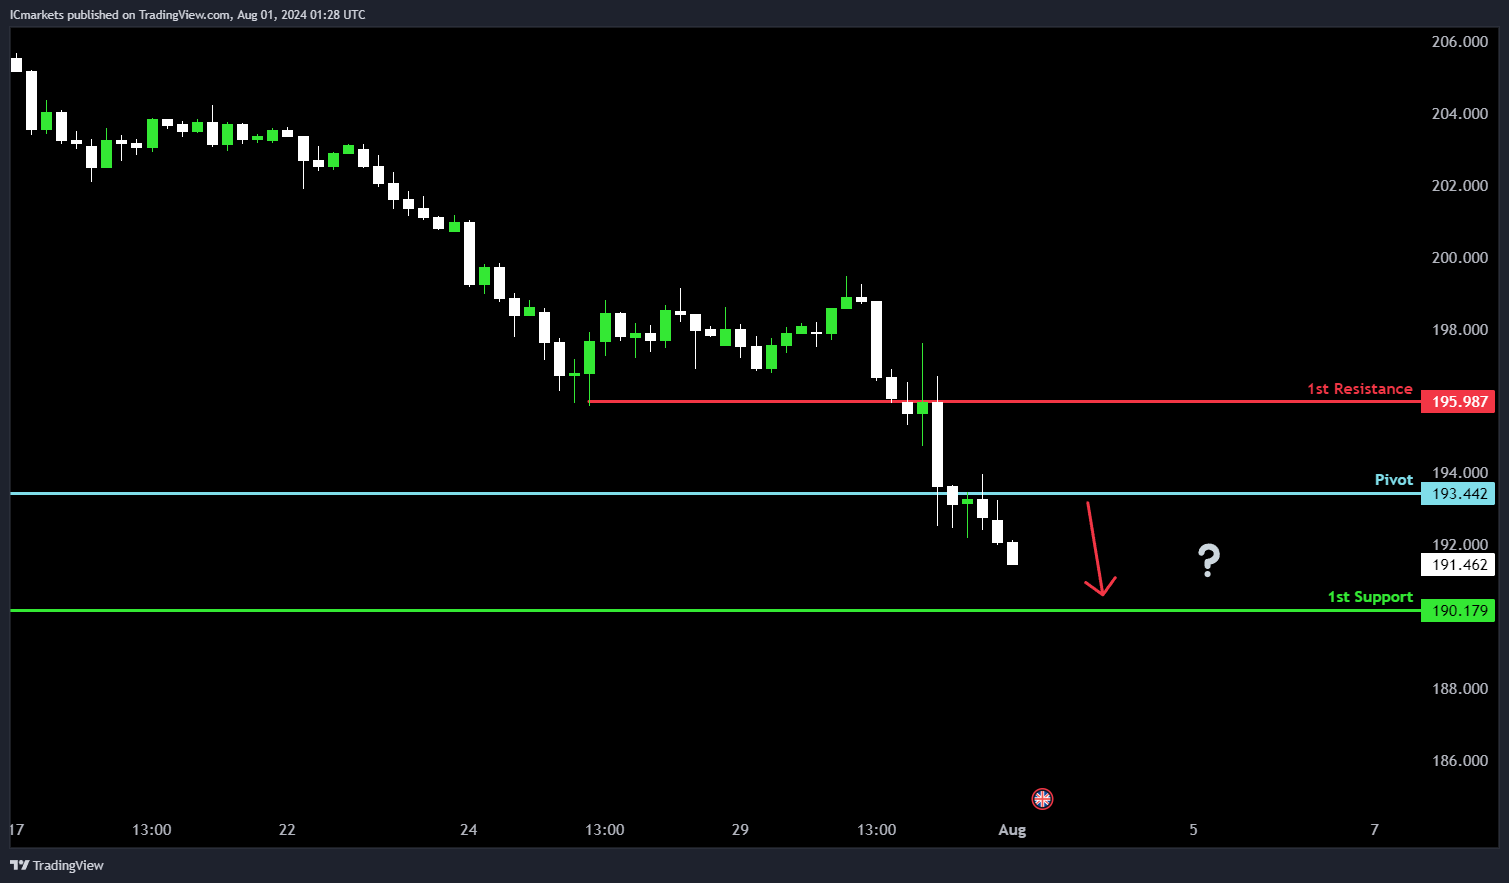
GBP/JPY:
Potential Direction: Bearish
Overall momentum of the chart: Bearish
Price could potentially make a bearish continuation towards 1st support.
Pivot: 193.44
Supporting reasons: Identified as a pullback resistance level, indicating a potential area where sellers could enter the market after a retracement.
1st support: 190.17
Supporting reasons: Identified as an overlap support level, suggesting a significant area where previous declines have found support.
1st resistance: 195.98
Supporting reasons: Identified as an overlap resistance level, indicating a historical point where previous rallies have faced selling pressure or reversed.
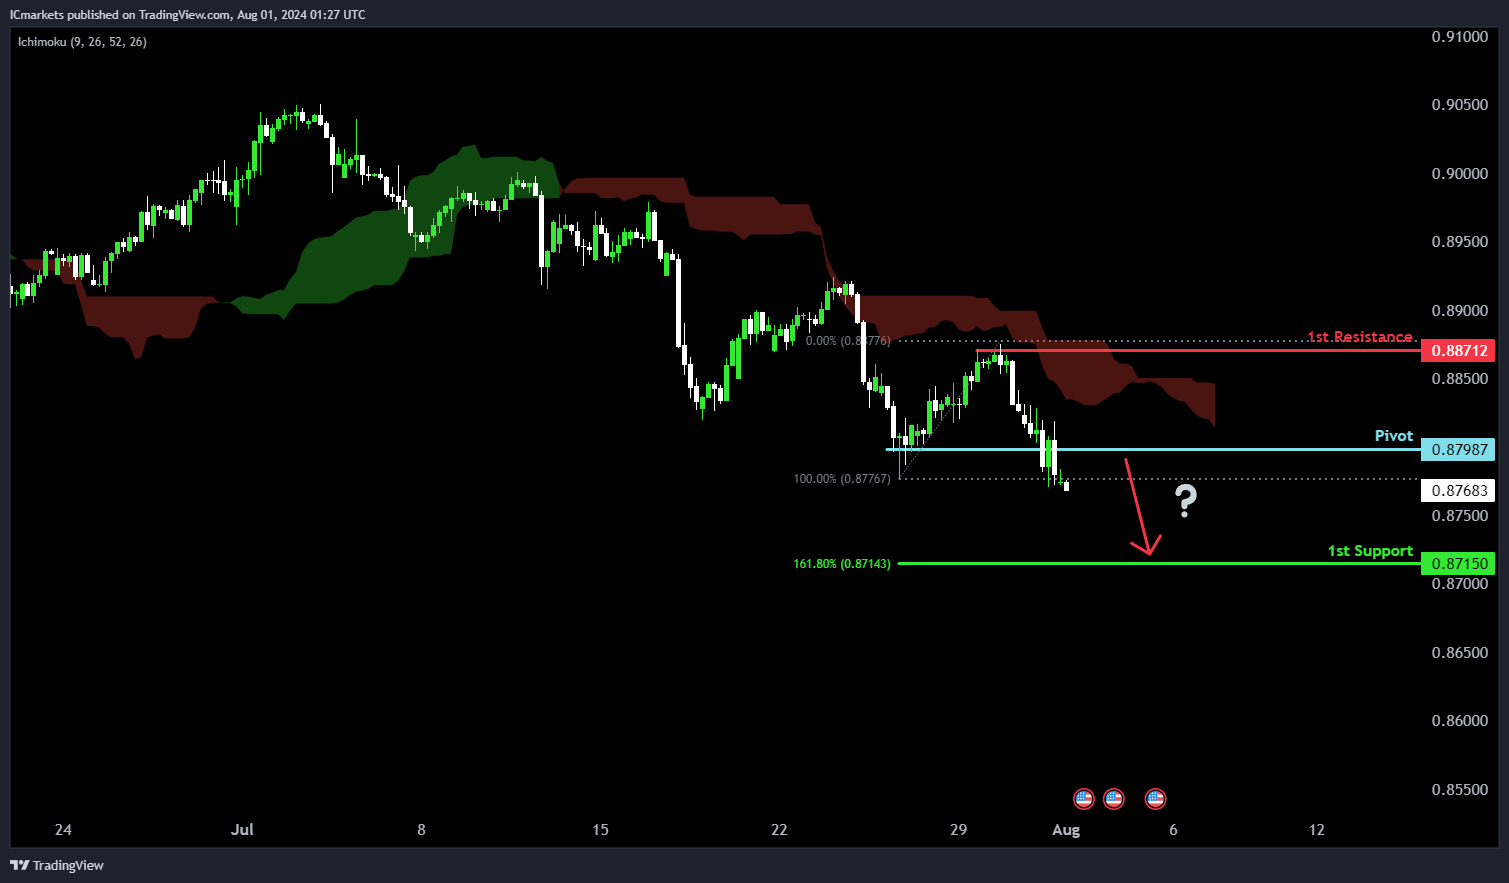
USD/CHF:
Potential Direction: Bearish
Overall momentum of the chart: Bearish
Factors contributing to the momentum: Price is below the bearish Ichimoku cloud
Price could potentially make a bearish continuation towards 1st support.
Pivot: 0.8798
Supporting reasons: Identified as a pullback resistance level, indicating a potential area where sellers could enter the market after a retracement.
1st support: 0.8715
Supporting reasons: Identified as a significant level, specifically at the 161.80% Fibonacci Extension, suggesting a strong area where previous declines have found support.
1st resistance: 0.8871
Supporting reasons: Identified as a swing high resistance level, indicating a historical point where previous rallies have faced selling pressure or reversed.
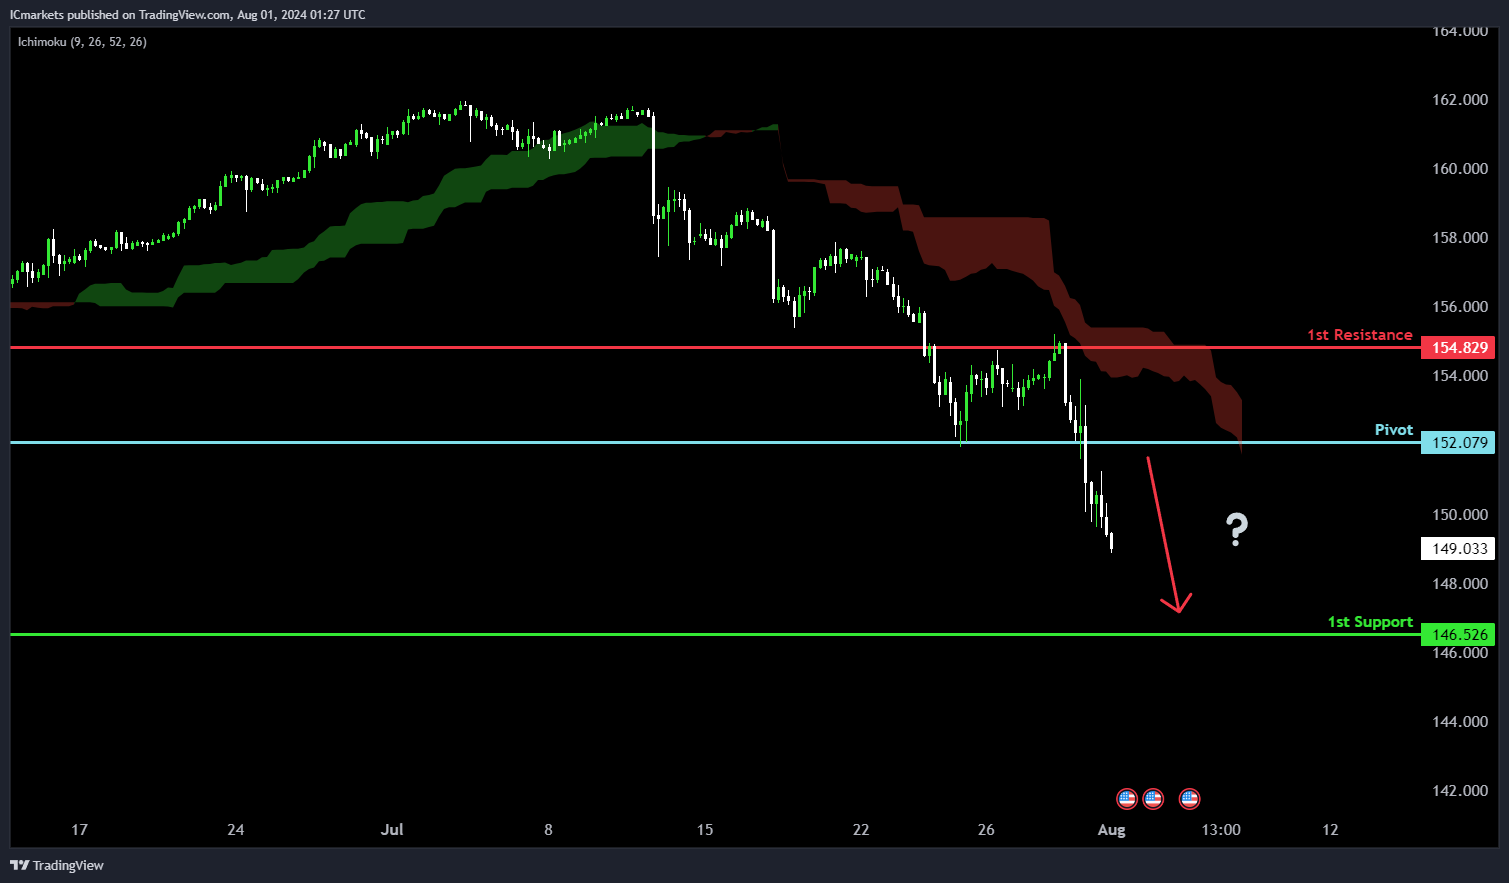
USD/JPY:
Potential Direction: Bearish
Overall momentum of the chart: Bearish
Factors contributing to the momentum: Price is below the bearish Ichimoku cloud
Price could potentially make a bearish continuation towards 1st support.
Pivot: 152.07
Supporting reasons: Identified as a pullback resistance level, indicating a potential area where sellers could enter the market after a retracement.
1st support: 146.52
Supporting reasons: Identified as an overlap support level, suggesting a significant area where previous declines have found support.
1st resistance: 154.82
Supporting reasons: Identified as an overlap resistance level, indicating a historical point where previous rallies have faced selling pressure or reversed.
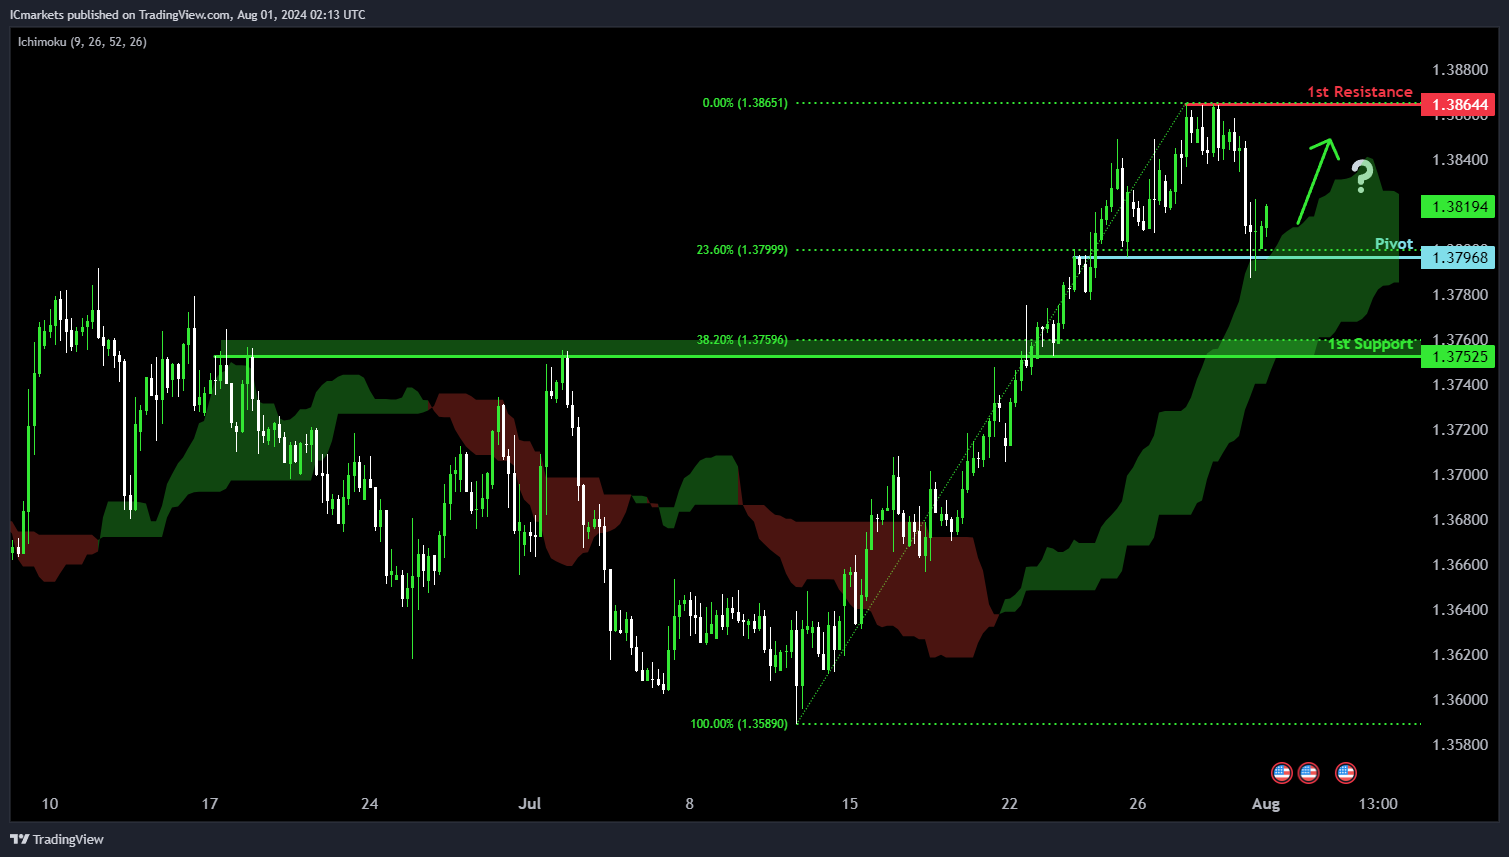
USD/CAD:
Potential Direction: Bullish
Overall momentum of the chart: Bullish
Price has made a bullish bounce off the pivot and could potentially rise towards the 1st resistance.
Pivot: 1.3796
Supporting reasons: Identified as an overlap support that aligns with a 23.6% Fibonacci retracement level, indicating a significant area where buying interests could pick up to stage a rebound. The presence of a bullish Ichimoku Cloud adds further significance for a potential rebound.
1st support: 1.3752
Supporting reasons: Identified as an overlap support that aligns with a 38.2% Fibonacci retracement level, indicating a potential area that could halt any further downward movement.
1st resistance: 1.3864
Supporting reasons: Identified as a pullback resistance, indicating a potential area that could halt any further upward movement.
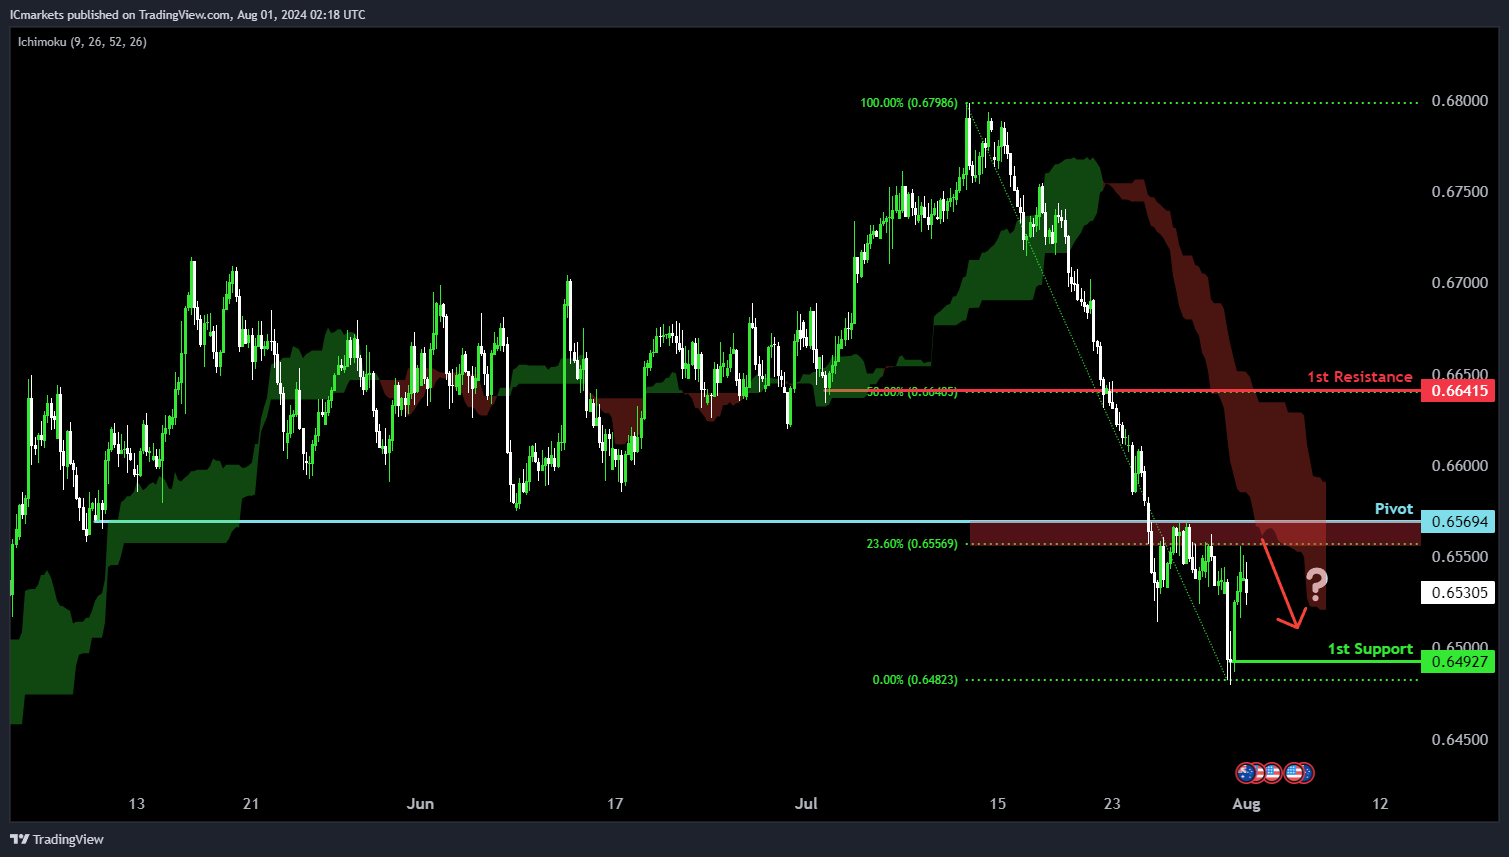
AUD/USD:
Potential Direction: Bearish
Overall momentum of the chart: Bearish
Price could rise towards the pivot and potentially make a bearish reversal off this level to fall towards the 1st support.
Pivot: 0.6569
Supporting reasons: Identified as an overlap resistance that aligns close to a 23.6% Fibonacci retracement level, indicating a potential area where selling pressures could intensify to resume the downtrend. The presence of a bearish Ichimoku Cloud adds further significance to the downward momentum.
1st support: 0.6492
Supporting reasons: Identified as a pullback support, suggesting a significant area where price has recently found support.
1st resistance: 0.6641
Supporting reasons: Identified as a pullback resistance that aligns with a 50% Fibonacci retracement, indicating a significant area that could halt further upward movement.
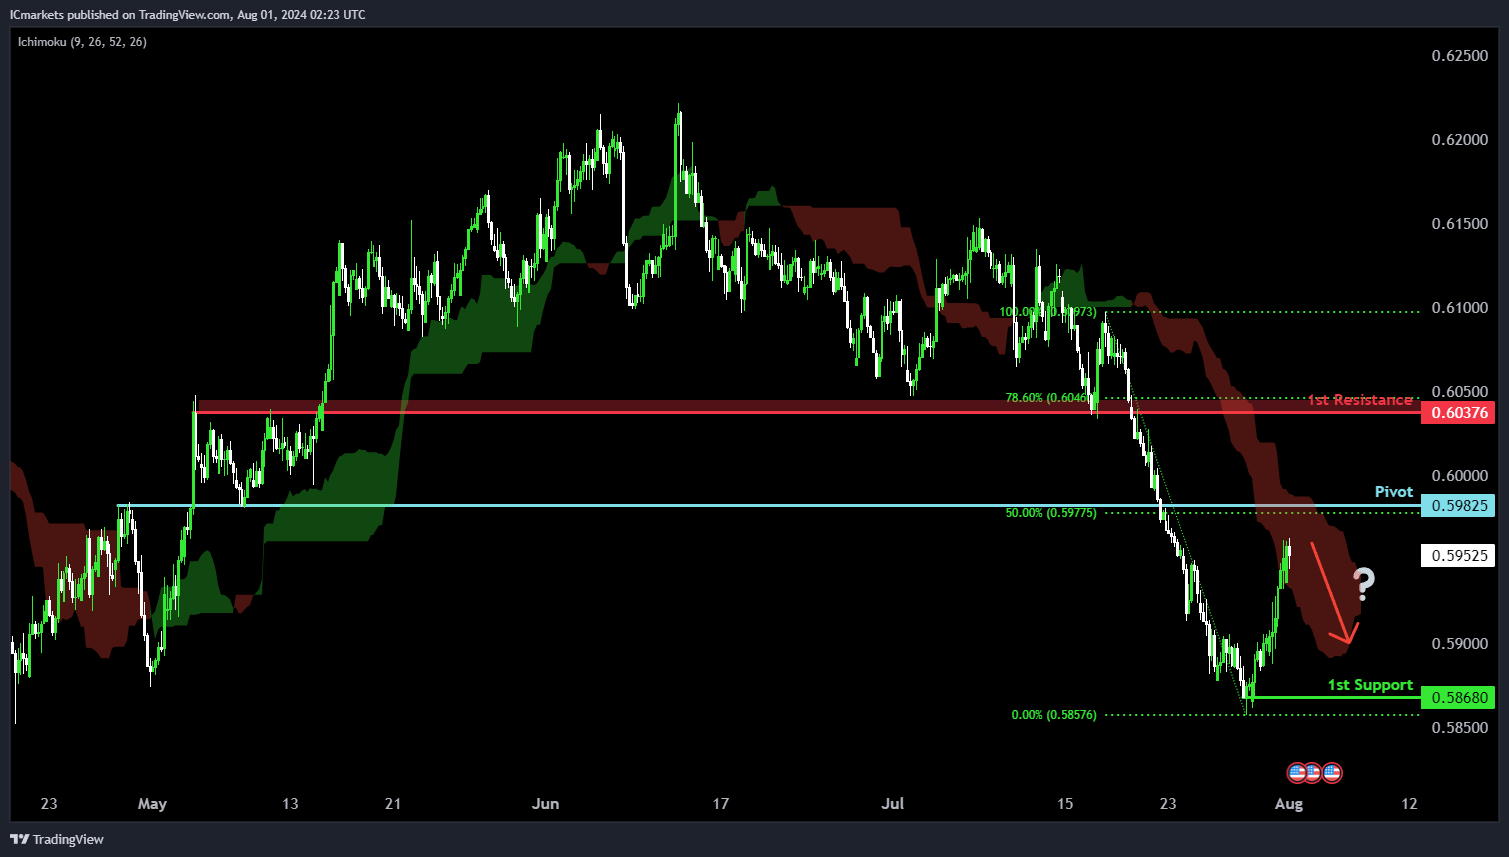
NZD/USD
Potential Direction: Bearish
Overall momentum of the chart: Bearish
Price could rise towards the pivot and potentially make a bearish reversal off this level to drop towards the 1st support.
Pivot: 0.5982
Supporting reasons: Identified as an overlap resistance that aligns close to a 50% Fibonacci retracement level, indicating a potential area where selling pressures could intensify to resume the downtrend. The presence of a bearish Ichimoku Cloud adds further significance to the downward momentum.
1st support: 0.5868
Supporting reasons: Identified as a swing-low support, suggesting a significant area where price has recently found support.
1st resistance: 0.6037
Supporting reasons: Identified as an overlap resistance that aligns close to a 78.6% Fibonacci retracement level, indicating a significant area that could halt further upward movement.
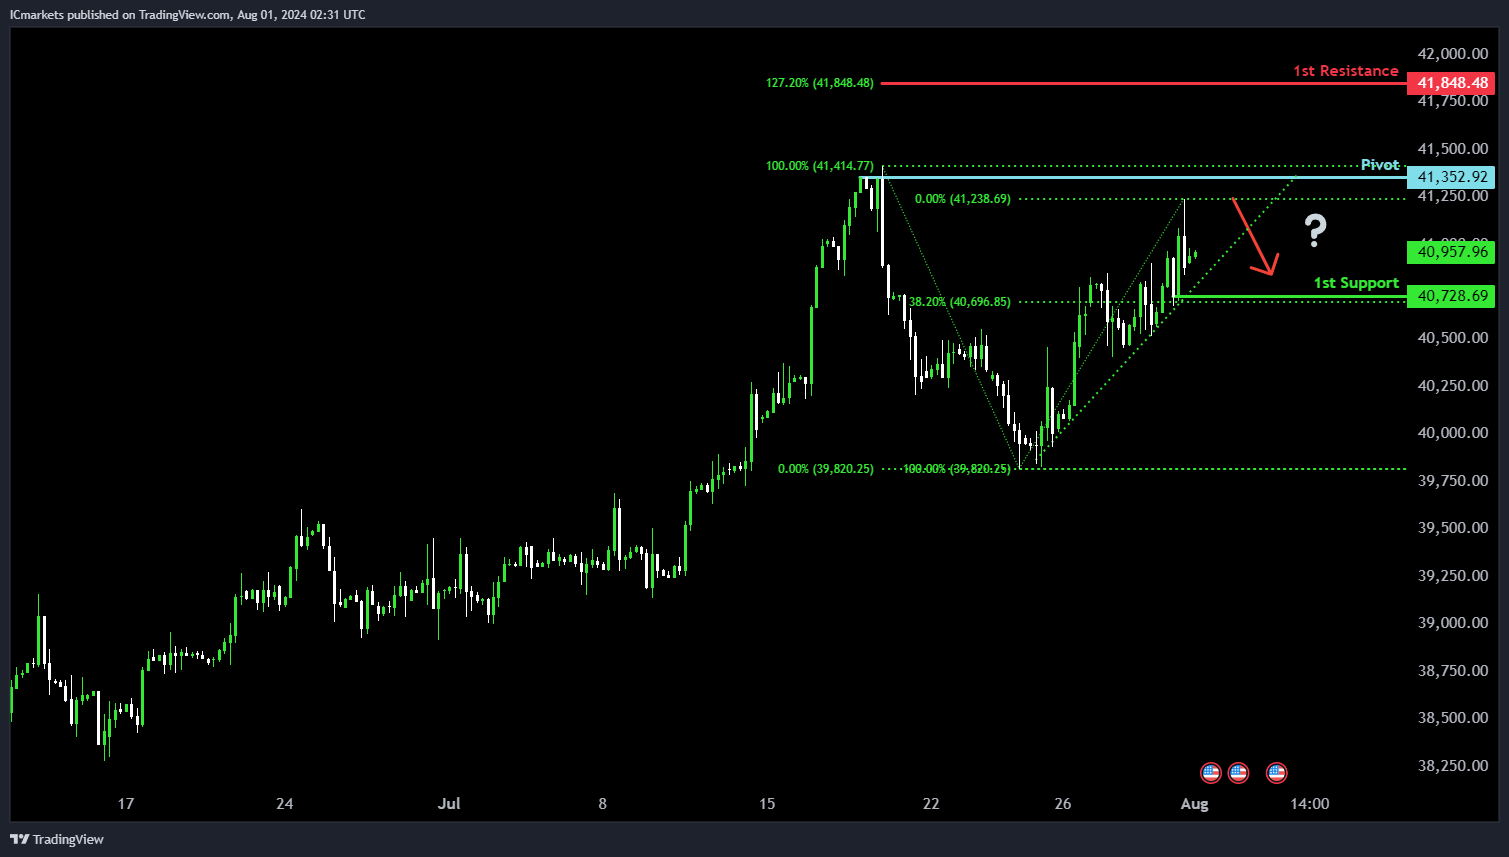
US30 (DJIA):
Potential Direction: Bearish
Overall Momentum of the Chart: Neutral
Price could rise towards the pivot and potentially make a bearish reversal off this level to pull back towards the 1st support.
Pivot: 41,352.92
Supporting reasons: Identified as a pullback resistance that aligns close to the all-time high, indicating a potential area where selling pressures could intensify.
1st Support: 40,728.69
Supporting Reasons: Identified as a pullback support that aligns with a 38.2% Fibonacci retracement level, suggesting a significant area where price could find strong support.
1st Resistance: 41,848.48
Supporting Reasons: Identified as a resistance that aligns with a 127.2% Fibonacci extension level, indicating a significant area that could halt further upward movement.
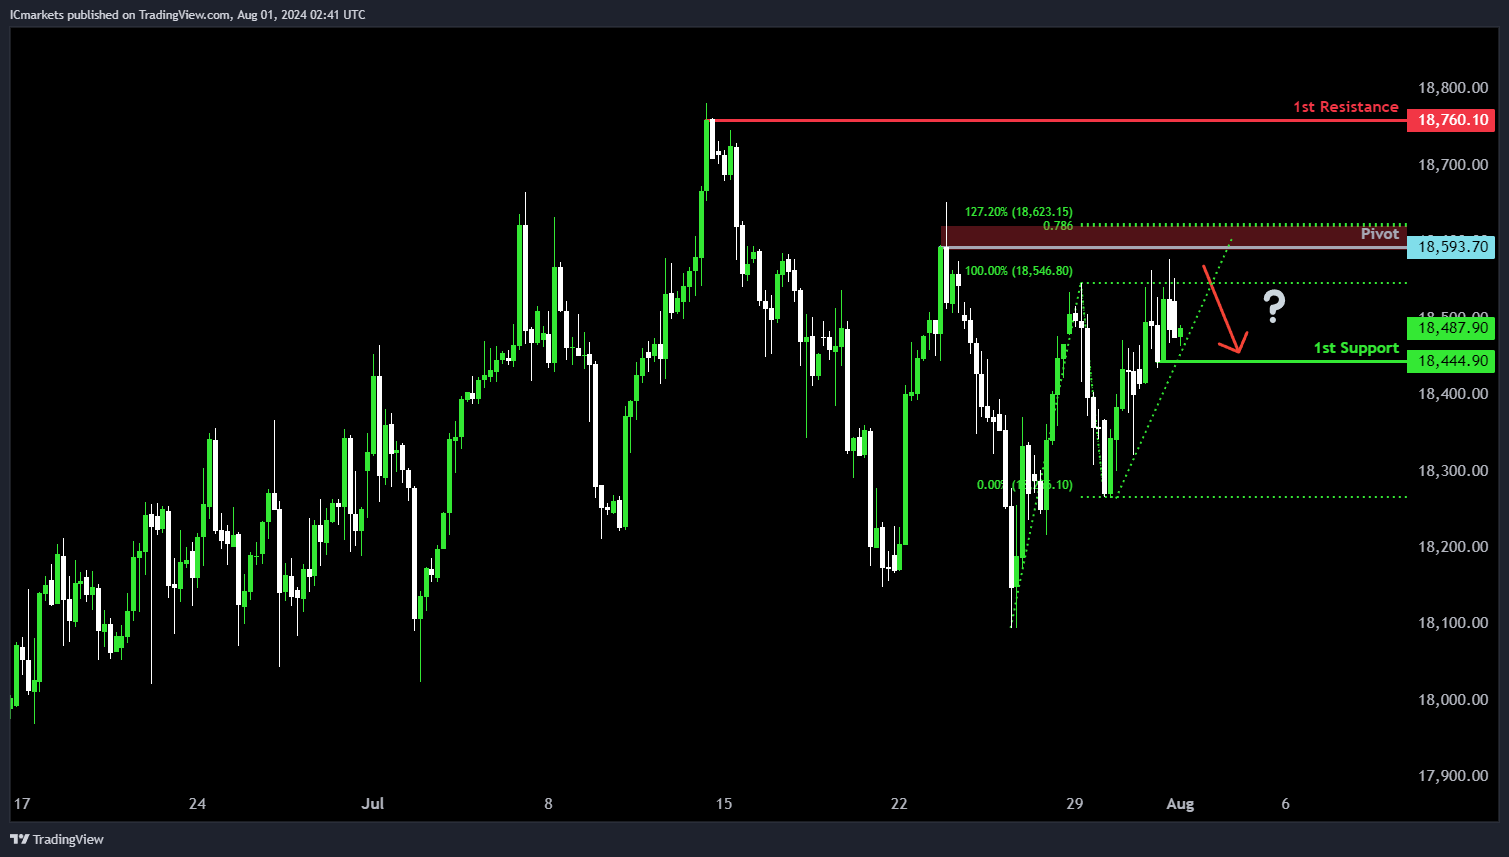
DE40 (DAX):
Potential Direction: Bearish
Overall Momentum of the Chart: Neutral
Price could rise towards the pivot and potentially make a bearish reversal off this level to pull back towards the 1st support.
Pivot: 18,593.70
Supporting reasons: Identified as a swing-high resistance that aligns with a confluence of Fibonacci levels i.e. the 78.6% projection and the 127.2% extension levels, indicating a significant area where selling pressures could intensify.
1st Support: 18,444.90
Supporting Reasons: Identified as a pullback support, indicating a significant area where price could find strong support. The presence of an ascending trendline adds further significance to the strength of this support zone.
1st Resistance: 18,760.10
Supporting Reasons: Identified as a swing-high resistance, indicating a significant area that could halt further upward movement.
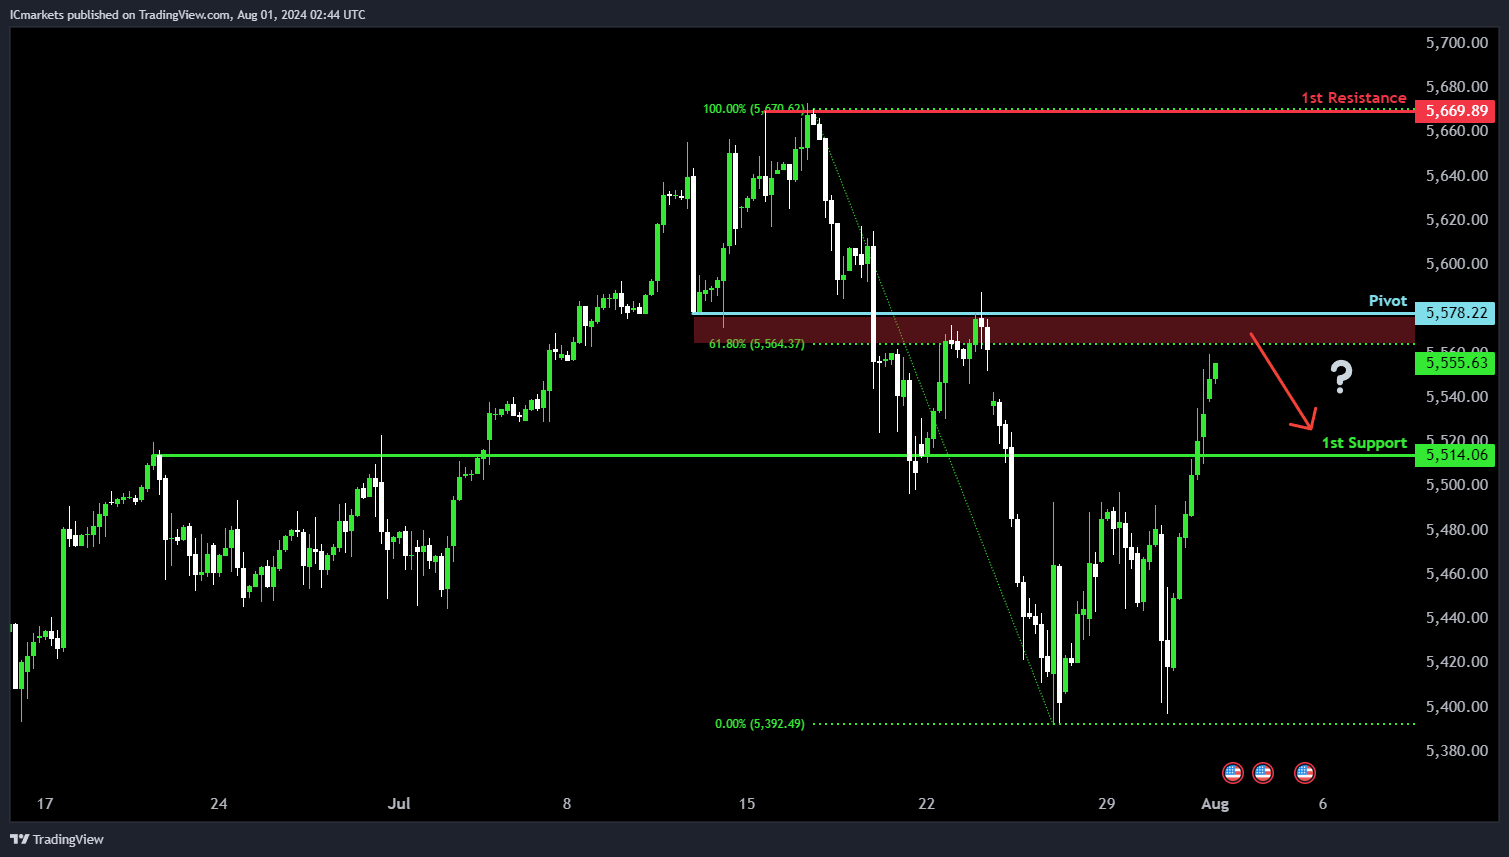
US500 (S&P 500):
Potential Direction: Bearish
Overall momentum of the chart: Neutral
Price is rising towards the pivot and could potentially make a bearish reversal off this level to pull back towards the 1st support.
Pivot: 5,578.22
Supporting reasons: Identified as an overlap resistance that aligns close to a 61.8% Fibonacci retracement level, indicating a potential area where selling pressures could intensify.
1st support: 5,514.06
Supporting reasons: Identified as an overlap support, indicating a potential area where price could find strong support.
1st resistance: 5,669.89
Supporting reasons: Identified as a swing-high resistance that aligns close to the all-time high, suggesting a critical area that could halt further upward movement.
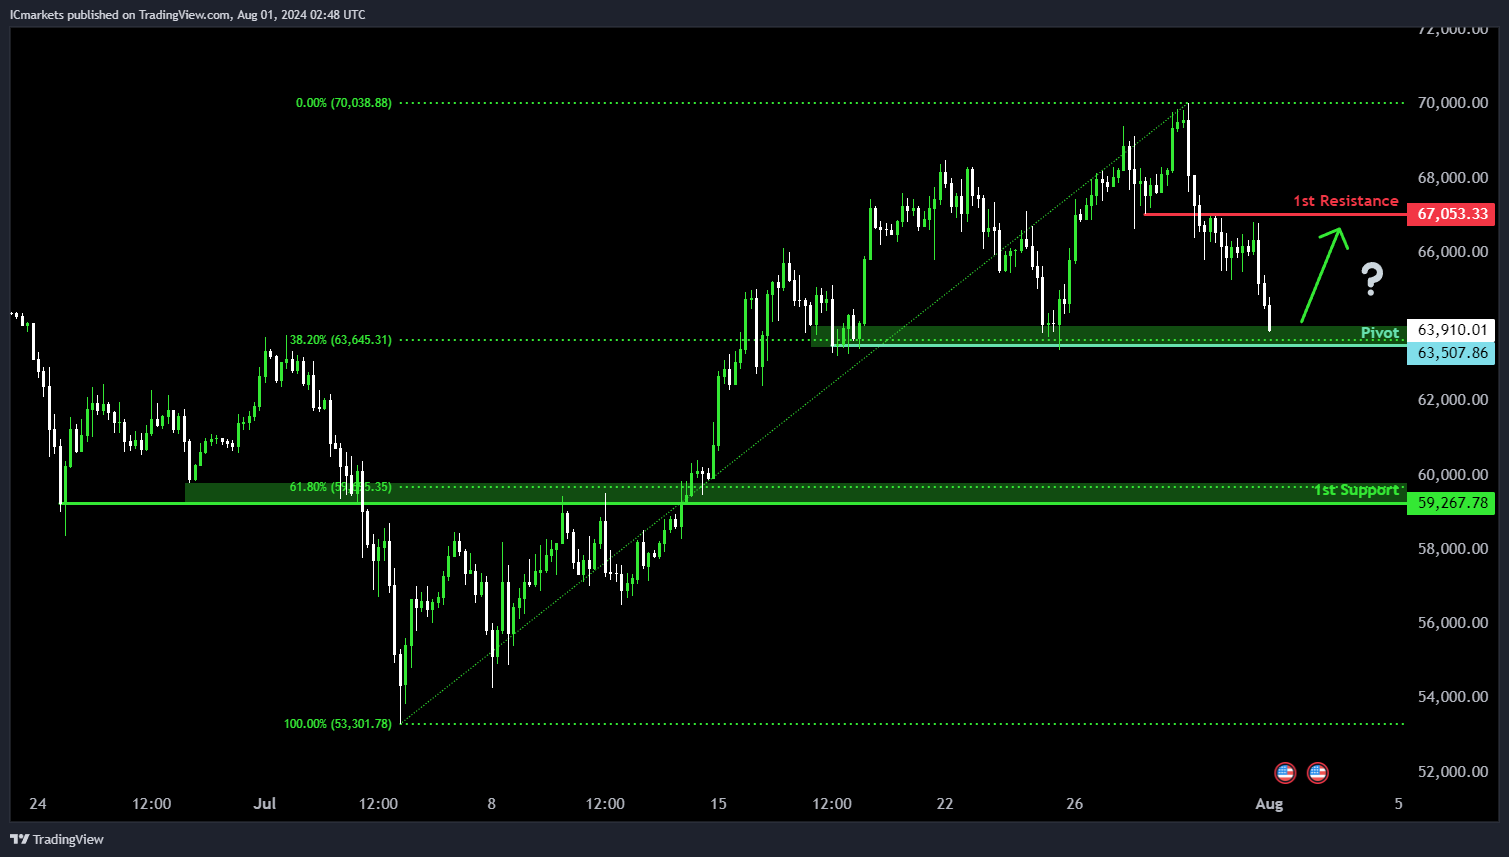
BTC/USD (Bitcoin):
Potential Direction: Bullish
Overall momentum of the chart: Neutral
Price is falling towards the pivot and could potentially make a bullish bounce off this level to rise towards the 1st resistance.
Pivot: 63,507.86
Supporting reasons: Identified as a pullback support that aligns with a 38.2% Fibonacci retracement level, indicating a potential area where buying interests could pick up to stage a rebound.
1st support: 59,267.78
Supporting reasons: Identified as an overlap support that aligns close to a 61.8% Fibonacci retracement level, indicating a significant area that could halt further downward movement.
1st resistance: 67,053.33
Supporting reasons: Identified as an overlap resistance, indicating a potential barrier that could halt further upward movement.
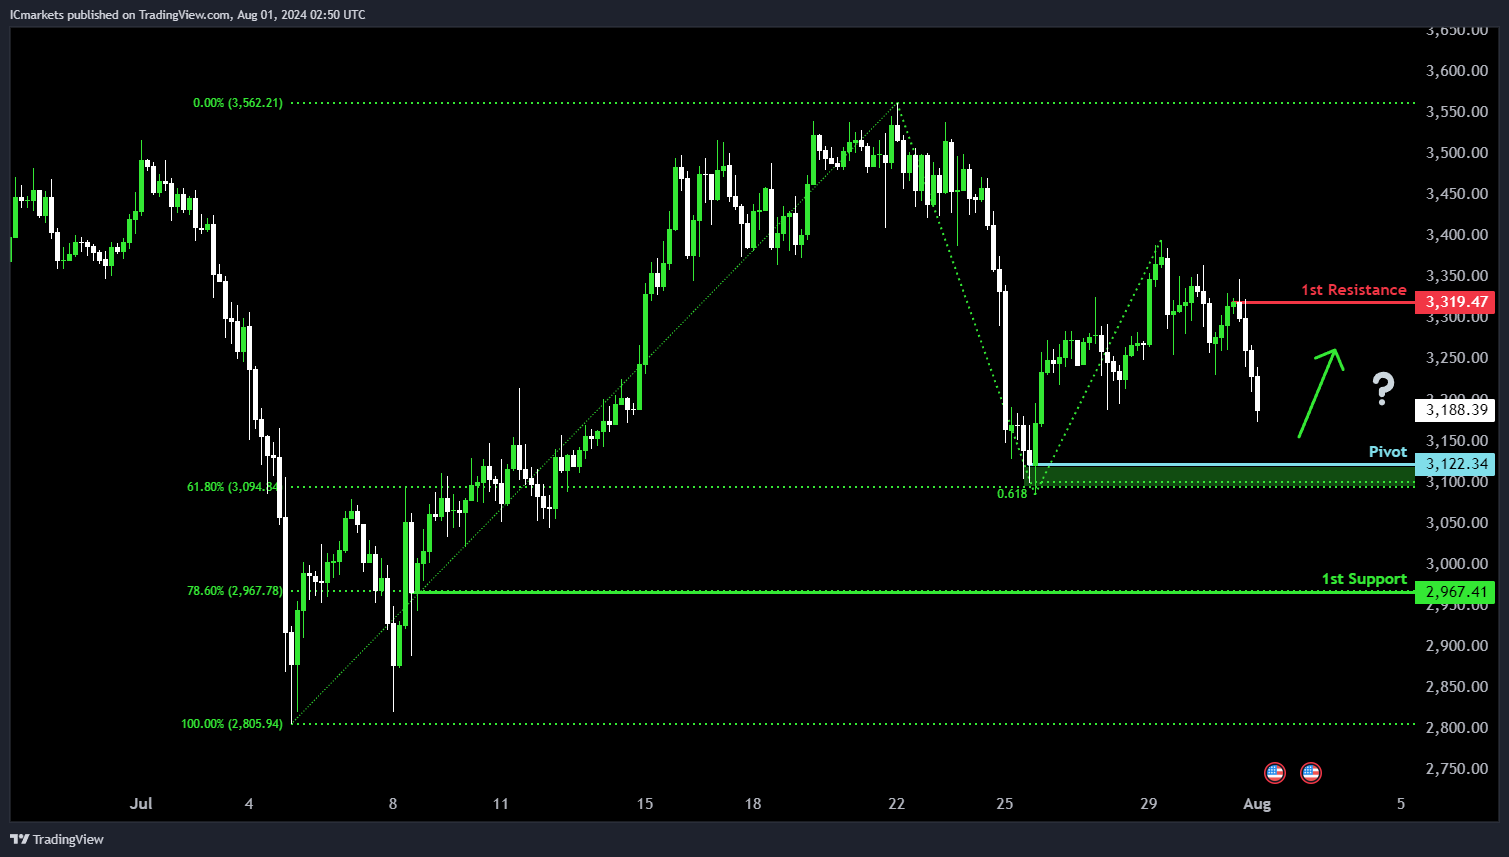
ETH/USD (Ethereum):
Potential Direction: Bullish
Overall momentum of the chart: Neutral
Price is falling towards the pivot and could potentially make a bullish bounce off this level to rise towards the 1st resistance.
Pivot: 3,122.34
Supporting reasons: Identified as a pullback support that aligns with a confluence of Fibonacci levels i.e. the 61.8% retracement and the 61.8% projection levels, indicating a potential area where buying interests could pick up to stage a rebound.
1st Support: 2,967.41
Supporting Reasons: Identified as a pullback support that aligns with a 78.6% Fibonacci retracement level, indicating a significant area that could halt further downward movement.
1st Resistance: 3,319.47
Supporting Reasons: Identified as a pullback resistance, indicating a historical barrier where selling pressures could intensify.
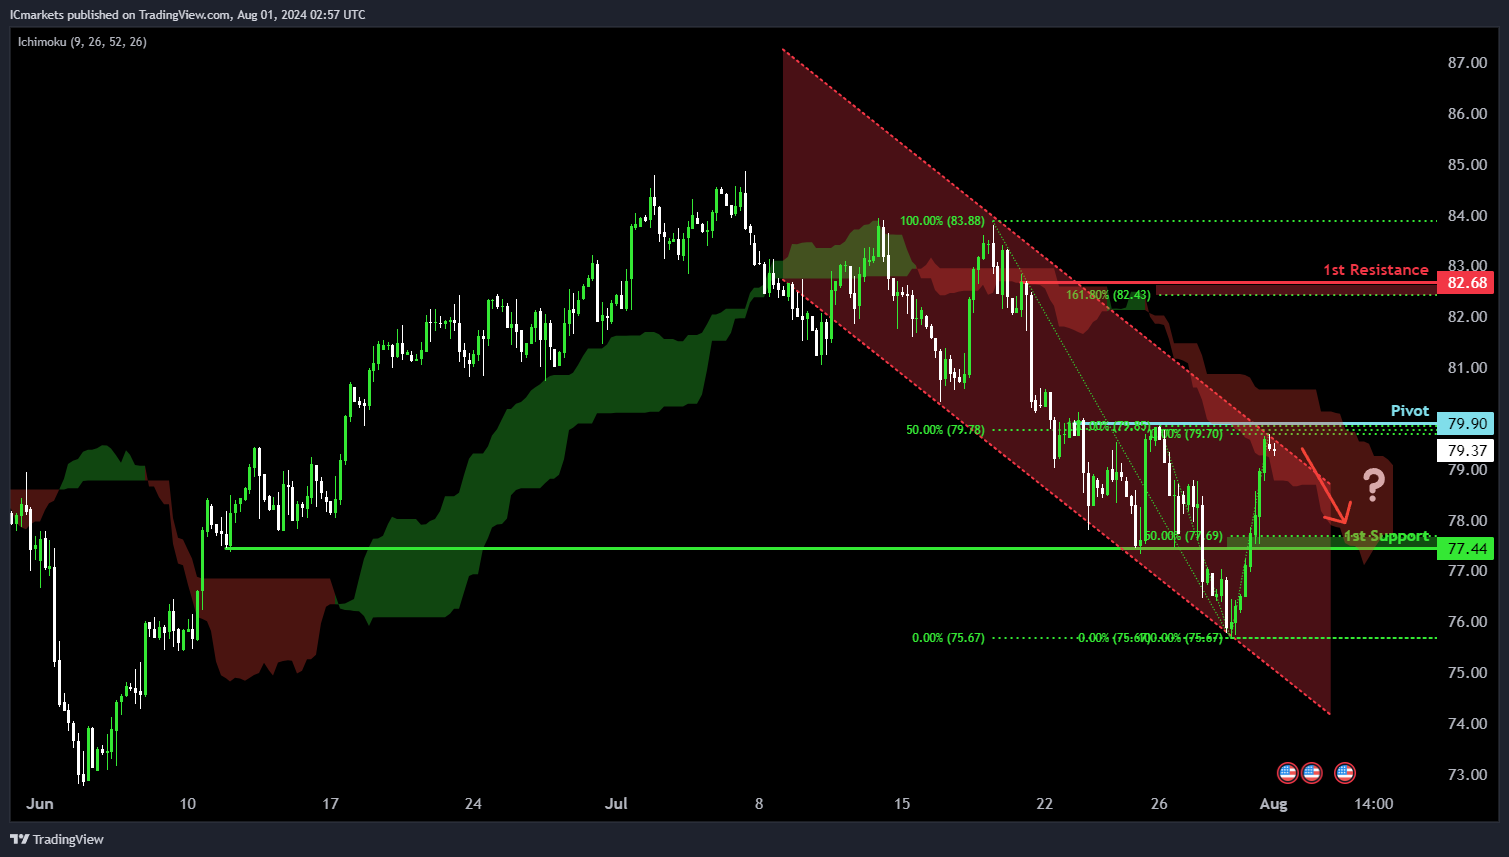
WTI/USD (Oil):
Potential Direction: Bearish
Overall Momentum of the Chart: Neutral
Price is rising towards the pivot and could potentially make a bearish reversal off this level to fall towards the 1st support.
Pivot: 79.90
Supporting Reasons: Identified as a pullback resistance that aligns with a 50% Fibonacci retracement level, indicating a significant where selling pressures could intensify. The presence of a bearish Ichimoku Cloud adds further significance to the strength of this resistance zone.
1st Support: 77.44
Supporting Reasons: Identified as a pullback support that aligns with a 50% Fibonacci retracement level, indicating a significant area where price could find strong support.
1st Resistance: 82.68
Supporting Reasons: Identified as a pullback resistance that aligns close to a 161.8% Fibonacci extension level, indicating a potential barrier that could halt further upward movement.
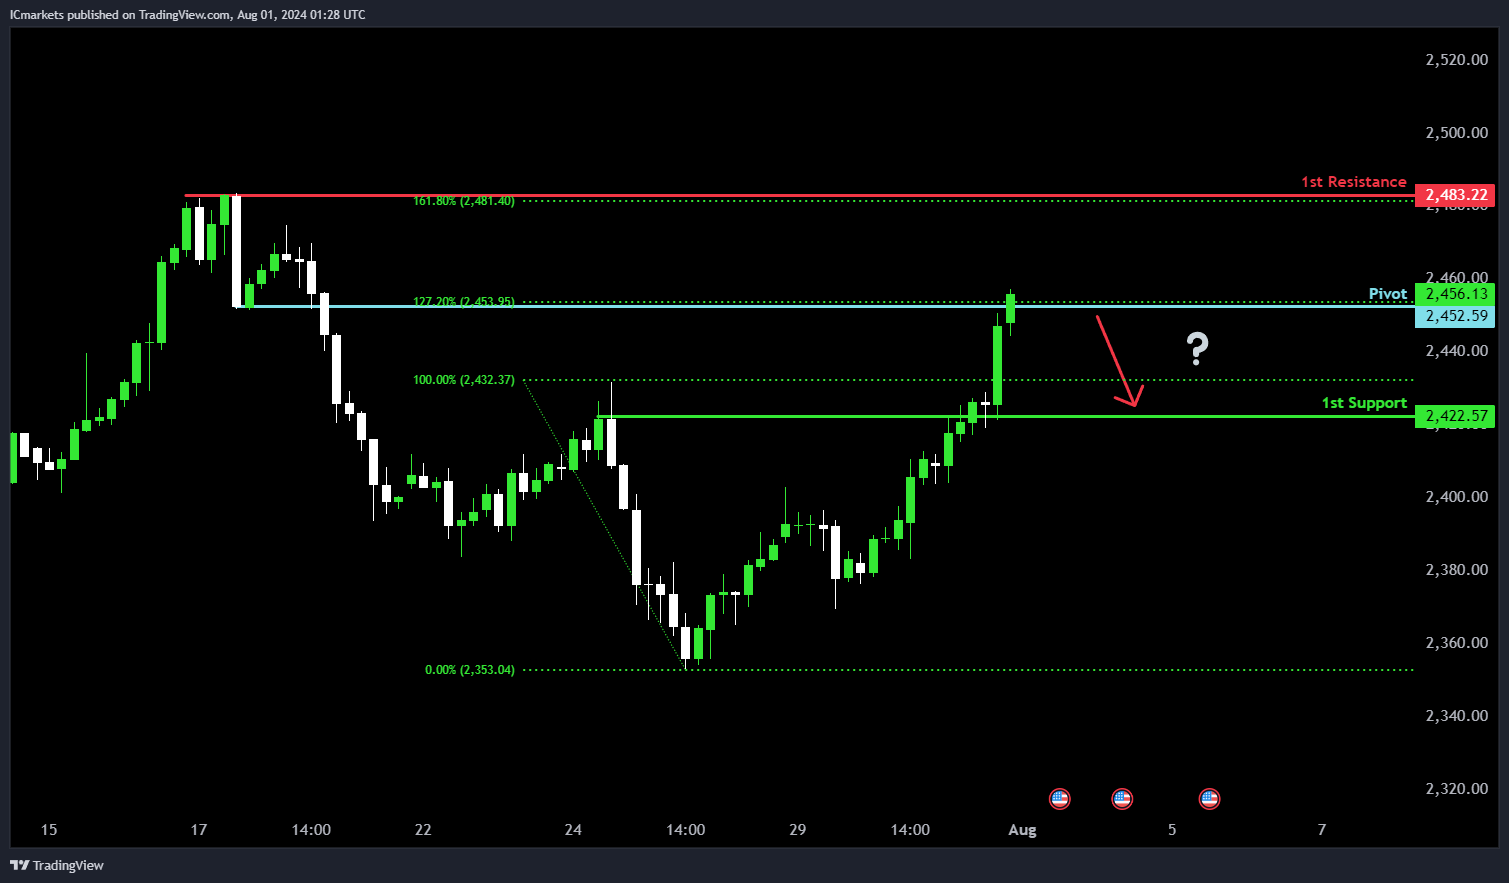
XAU/USD (GOLD):
Potential Direction: Bearish
Overall momentum of the chart: Bearish
Price could potentially make a bearish reaction off pivot and drop to 1st support.
Pivot: 2456.13
Supporting reasons: Identified as a pullback resistance level, specifically at the 127.20% Fibonacci Extension, indicating a potential area where sellers could enter the market after a retracement.
1st support: 2422.57
Supporting reasons: Identified as an overlap support level, suggesting a significant area where previous declines have found support.
1st resistance: 2483.22
Supporting reasons: Identified as a swing high resistance level, specifically at the 161.80% Fibonacci Extension, indicating a historical point where previous rallies have faced selling pressure or reversed.
The accuracy, completeness and timeliness of the information contained on this site cannot be guaranteed. IC Trading does not warranty, guarantee or make any representations, or assume any liability regarding financial results based on the use of the information in the site.
News, views, opinions, recommendations and other information obtained from sources outside of www.ictrading.com, used in this site are believed to be reliable, but we cannot guarantee their accuracy or completeness. All such information is subject to change at any time without notice. IC Trading assumes no responsibility for the content of any linked site.
The fact that such links may exist does not indicate approval or endorsement of any material contained on any linked site. IC Trading is not liable for any harm caused by the transmission, through accessing the services or information on this site, of a computer virus, or other computer code or programming device that might be used to access, delete, damage, disable, disrupt or otherwise impede in any manner, the operation of the site or of any user’s software, hardware, data or property.