
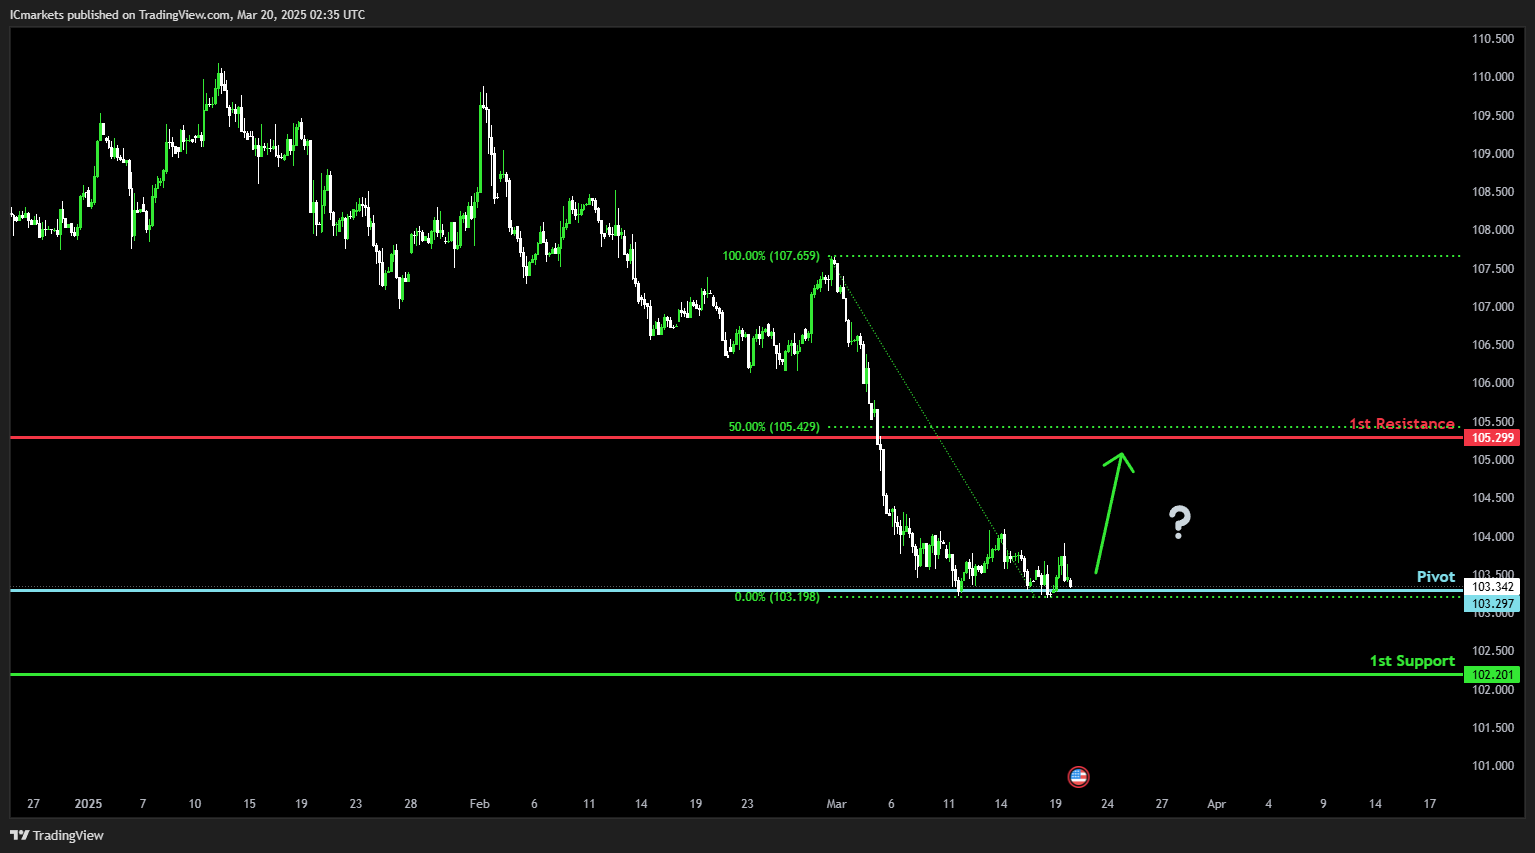
DXY (US Dollar Index):
Potential Direction: Bullish
Overall momentum of the chart: Bearish
Price could potentially make a bullish bounce off the pivot and rise toward the 1st resistance.
Pivot: 103.34
Supporting reasons: Identified as an overlap support, indicating a potential area where buying interests could pick up to resume the uptrend.
1st support: 102.20
Supporting reasons: Identified as an overlap support, indicating a potential area where the price could stabilize once again.
1st resistance: 105.29
Supporting reasons: Identified as a pullback resistance that aligns close to the 50% Fibonacci retracement, indicating a potential level that could cap further upward movement.
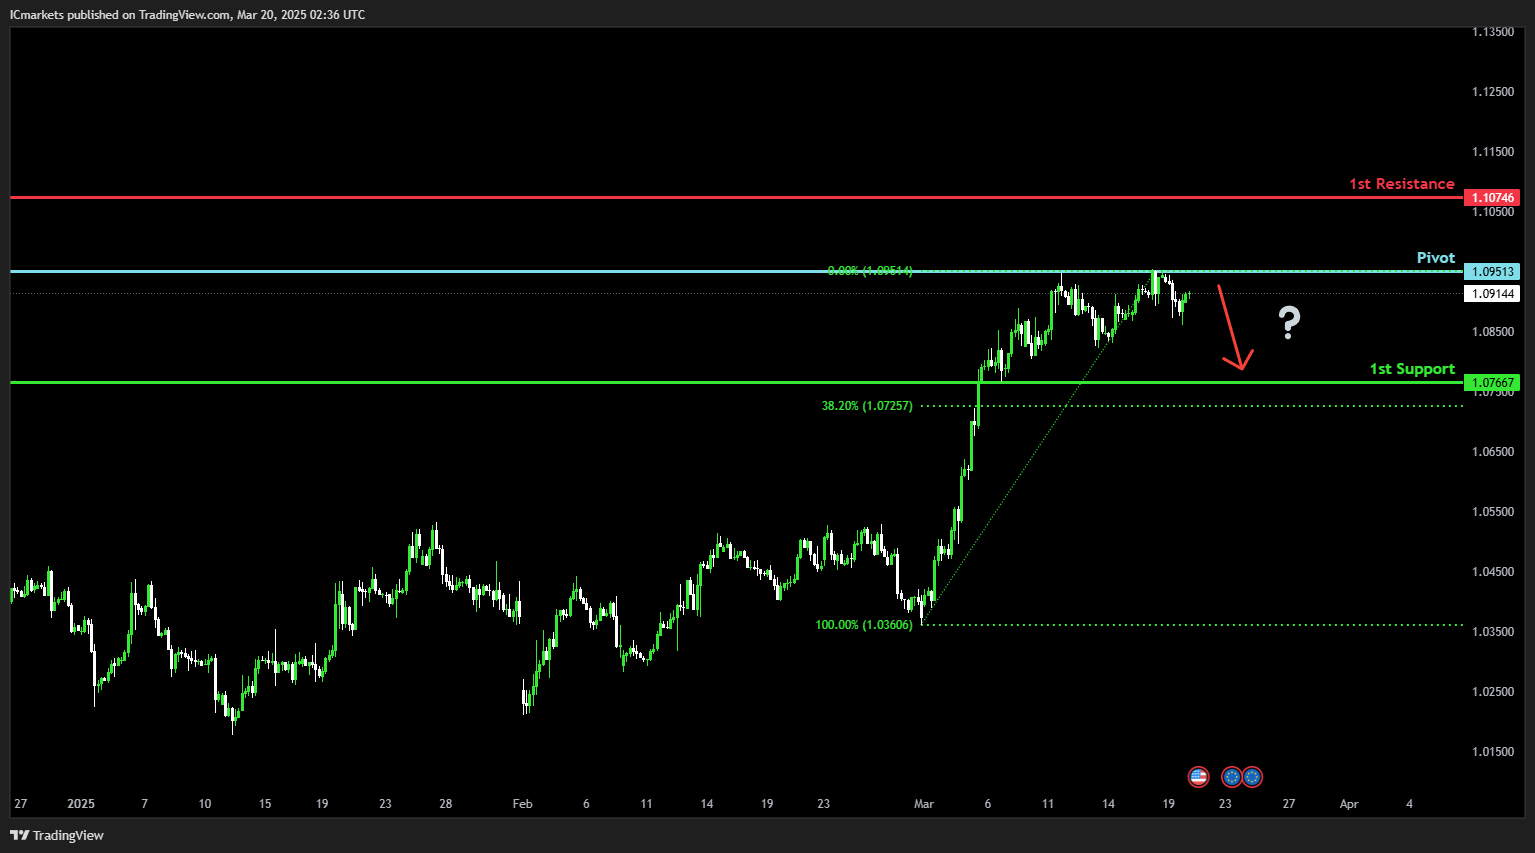
EUR/USD:
Potential Direction: Bearish
Overall momentum of the chart: Bullish
Price could potentially make a bearish reversal off this level to fall towards the 1st support.
Pivot: 1.0951
Supporting reasons: Identified as a multi-swing high resistance, indicating a potential area where selling pressures could intensify.
1st support: 1.0766
Supporting reasons: Identified as a pullback support, indicating a potential area where the price could stabilize once more.
1st resistance: 1.1074
Supporting reasons: Identified as a multi-swing high resistance, indicating a potential area that could halt any further upward movement.
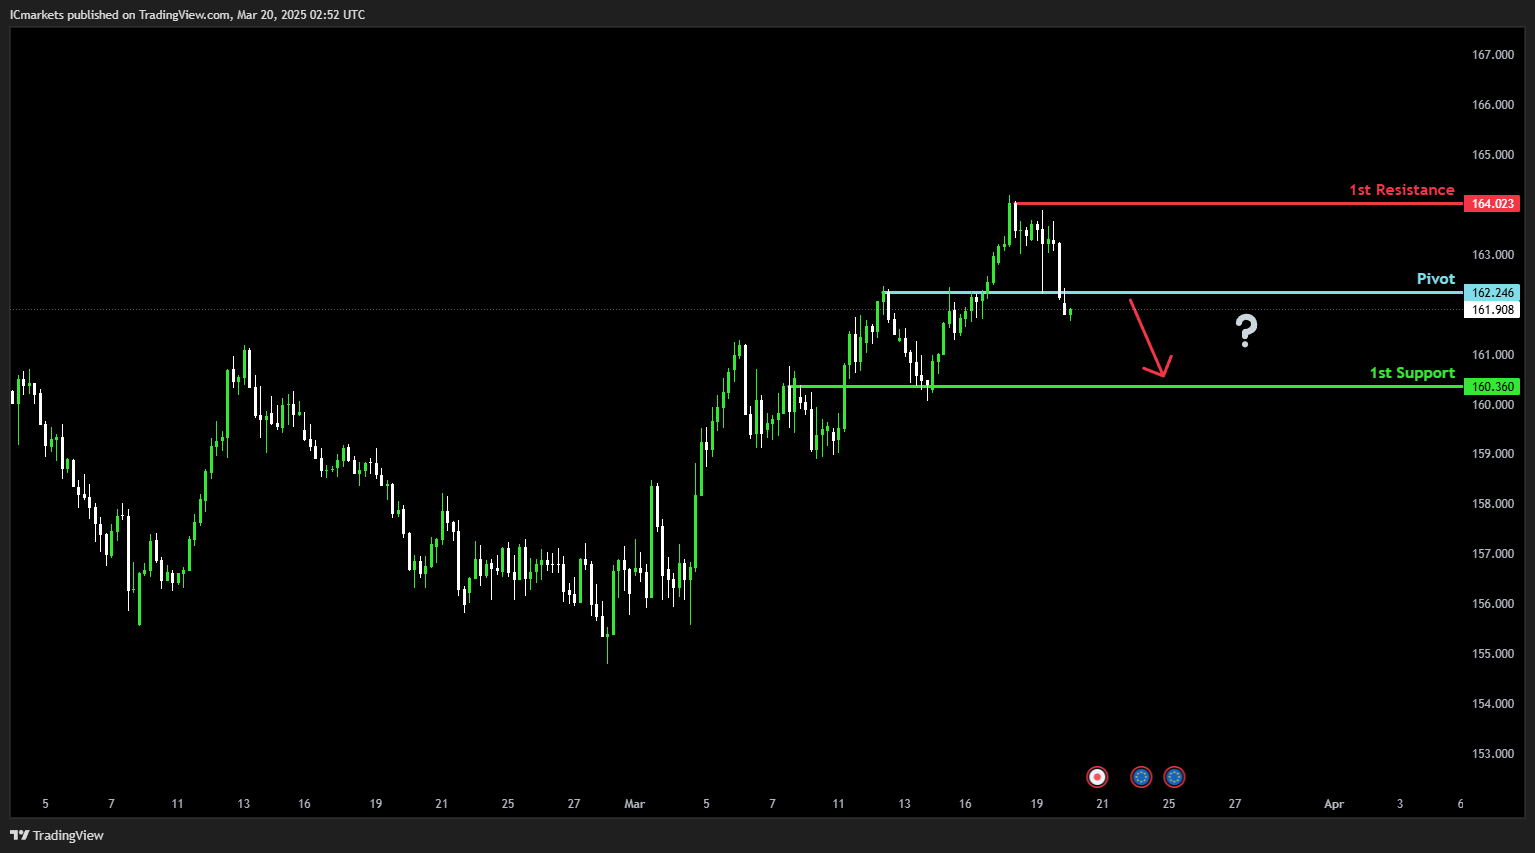
EUR/JPY:
Potential Direction: Bearish
Overall momentum of the chart: Bullish
Price could potentially make a bearish breakout toward the 1st support
Pivot: 162.24
Supporting reasons: Identified as a pullback resistance, indicating a potential area where selling pressures could intensify.
1st support: 160.36
Supporting reasons: Identified as an overlap support, indicating a potential area where the price could stabilize once again.
1st resistance: 164.02
Supporting reasons: Identified as a swing high resistance, indicating a potential area that could halt any further upward movement.
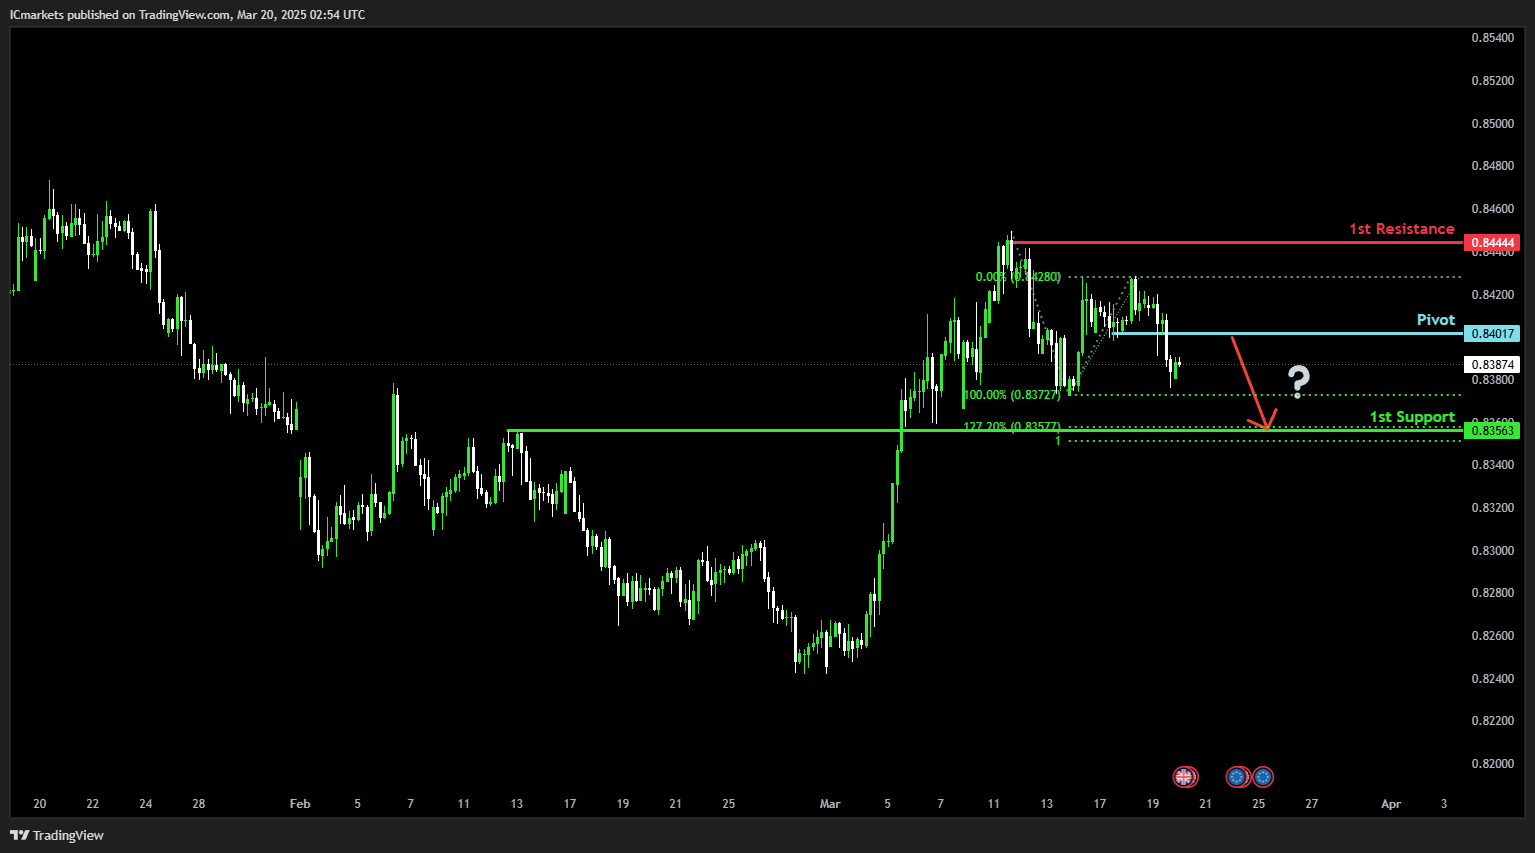
EUR/GBP:
Potential Direction: Bearish
Overall momentum of the chart: Bullish
Price is rising towards the pivot and it could potentially make a bearish reversal off this level to fall towards the 1st support.
Pivot: 0.8401
Supporting reasons: Identified as an overlap resistance, indicating a potential area where selling pressures could intensify.
1st support: 0.8356
Supporting reasons: Identified as a pullback support that aligns close to the 50% Fibonacci retracement and the 100% Fibonacci projection, indicating a potential area where the price could stabilize once more.
1st resistance: 0.8444
Supporting reasons: Identified as a swing high resistance, indicating a potential level that could cap further upward movement.
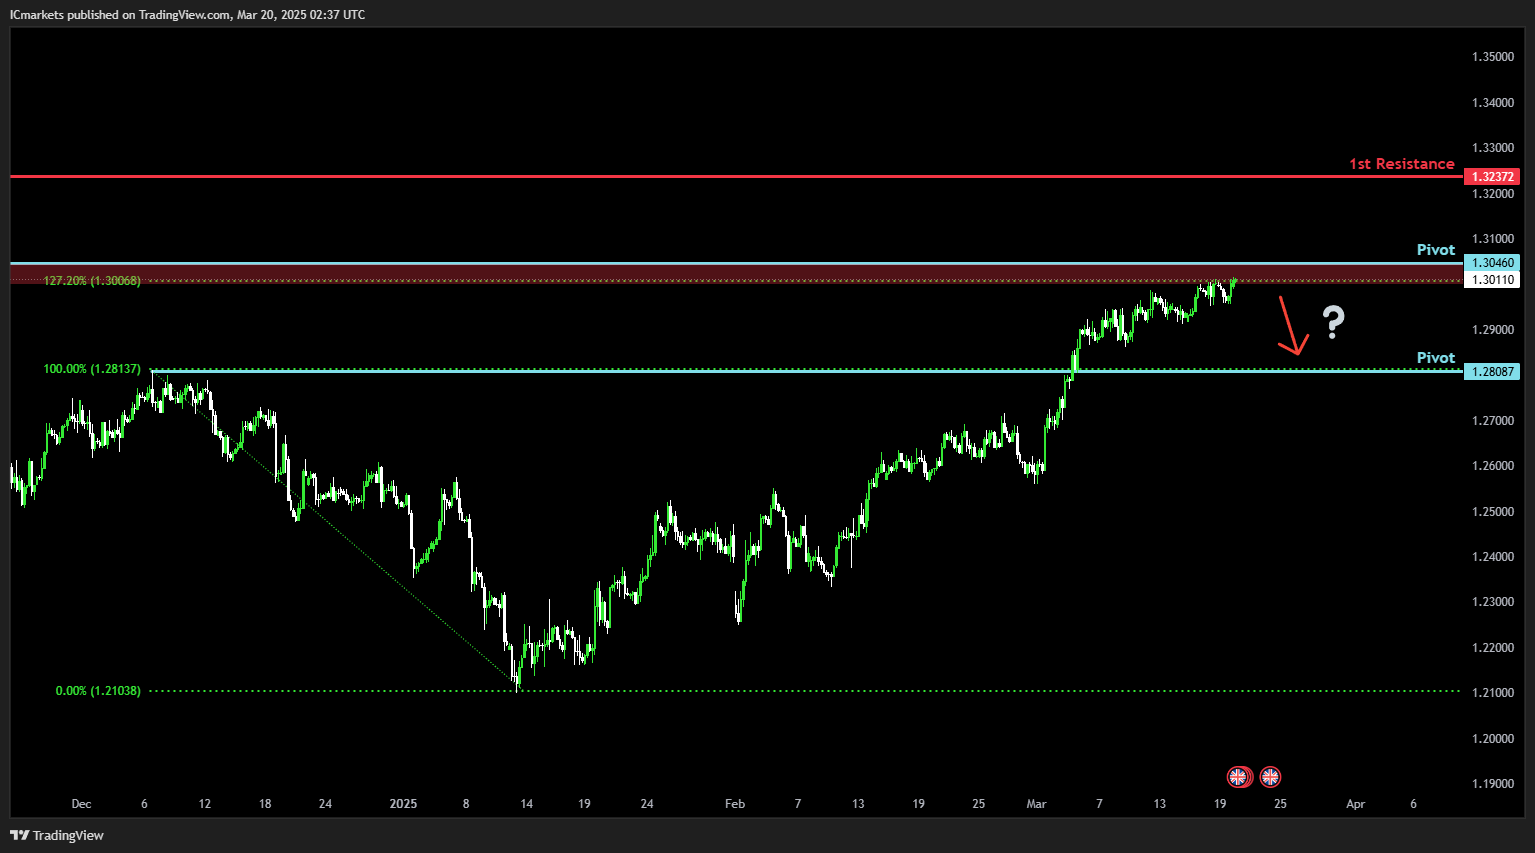
GBP/USD:
Potential Direction: Bearish
Overall momentum of the chart: Bullish
Price could potentially make a bearish reversal off this level to fall towards the 1st support.
Pivot: 1.3046
Supporting reasons: Identified as a multi-swing high resistance that aligns close to the 127.2% Fibonacci extension, indicating a potential area where selling pressures could intensify.
1st support: 1.2808
Supporting reasons: Identified as a pullback support, acting as a potential level where the price could stabilize once again.
1st resistance: 1.3237
Supporting reasons: Identified as an overlap resistance, indicating a potential level that could cap further upward movement.
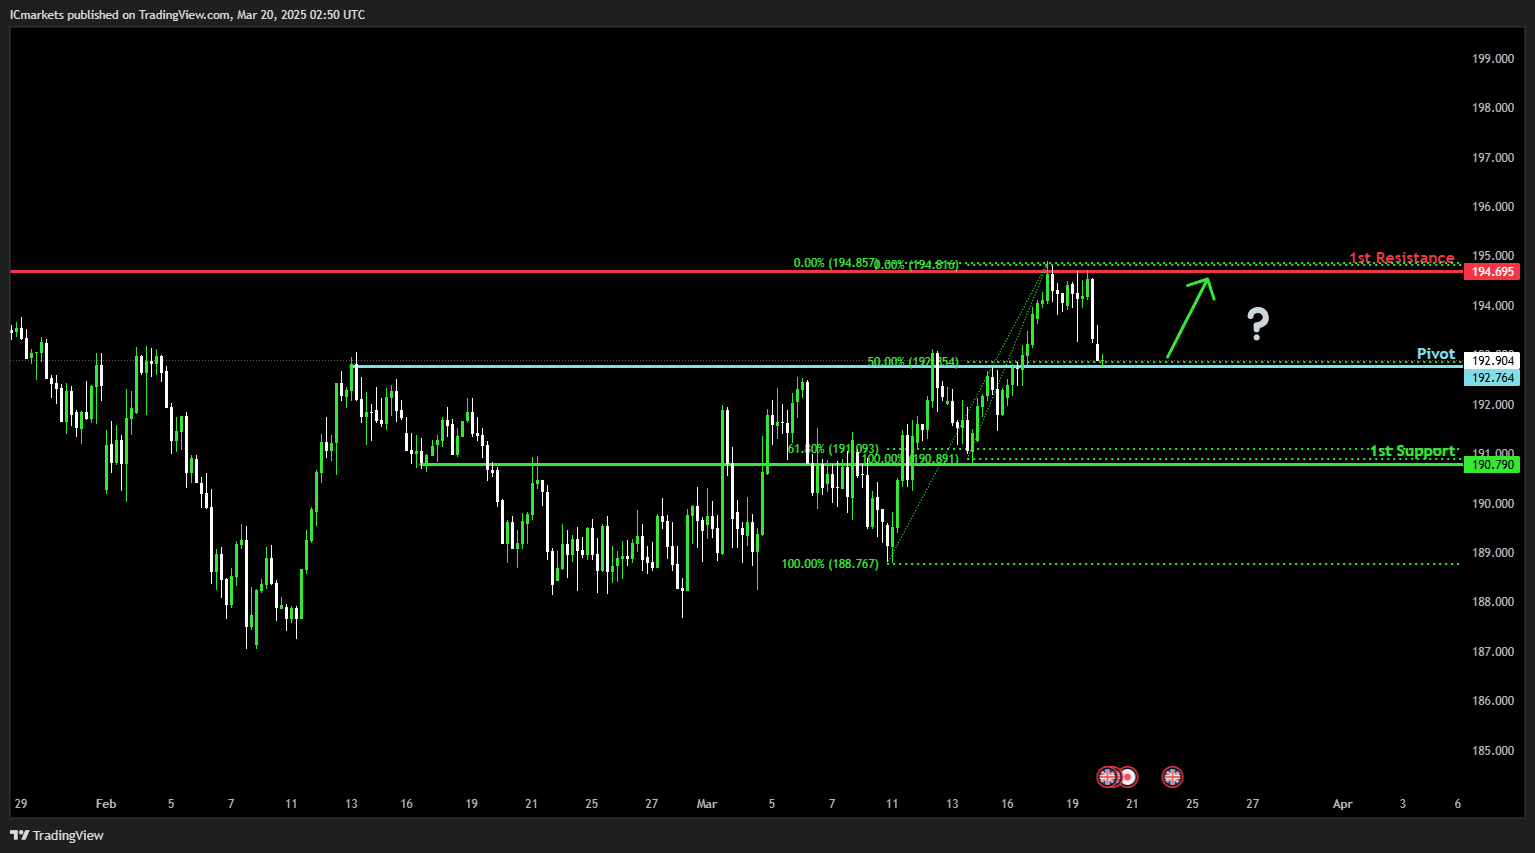
GBP/JPY:
Potential Direction: Bullish
Overall momentum of the chart: Bullish
Price could potentially make a bullish bounce off this level and rise towards the 1st resistance.
Pivot: 192.76
Supporting reasons: Identified as a pullback support that aligns with the 50% Fibonacci retracement, indicating a potential area where buying interests could pick up to stage a rebound.
1st support: 19079
Supporting reasons: Identified as a pullback support that aligns with the 61.8% Fibonacci retracement, indicating a potential level where the price could stabilize once more.
1st resistance: 194.69
Supporting reasons: Identified as a pullback resistance, indicating a potential level that could cap further upward movement.
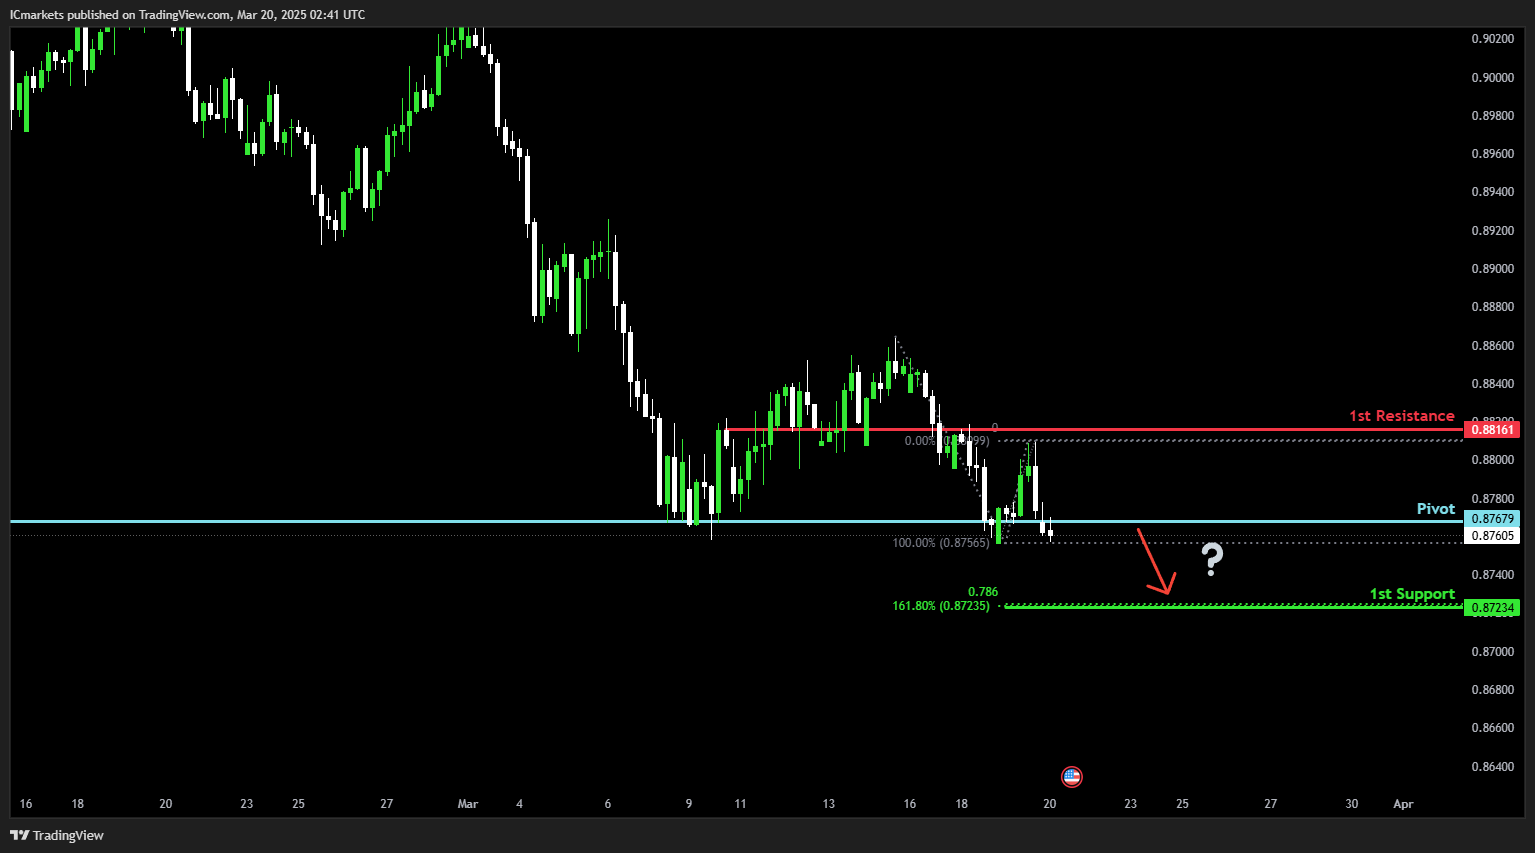
USD/CHF:
Potential Direction: Bearish
Overall momentum of the chart: Bearish
Price could potentially make a bearish breakout at this level to fall towards the 1st support.
Pivot: 0.8767
Supporting reasons: Identified as a pullback resistance, indicating a potential area where selling pressures could intensify
1st support: 0.8723
Supporting reasons: Identified as a support that aligns with the 161.8% Fibonacci extension and the 78.6% Fibonacci projection, indicating a potential level where the price could stabilize once again.
1st resistance: 0.8816
Supporting reasons: Identified as a pullback resistance, indicating a potential level that could cap further upward movement.
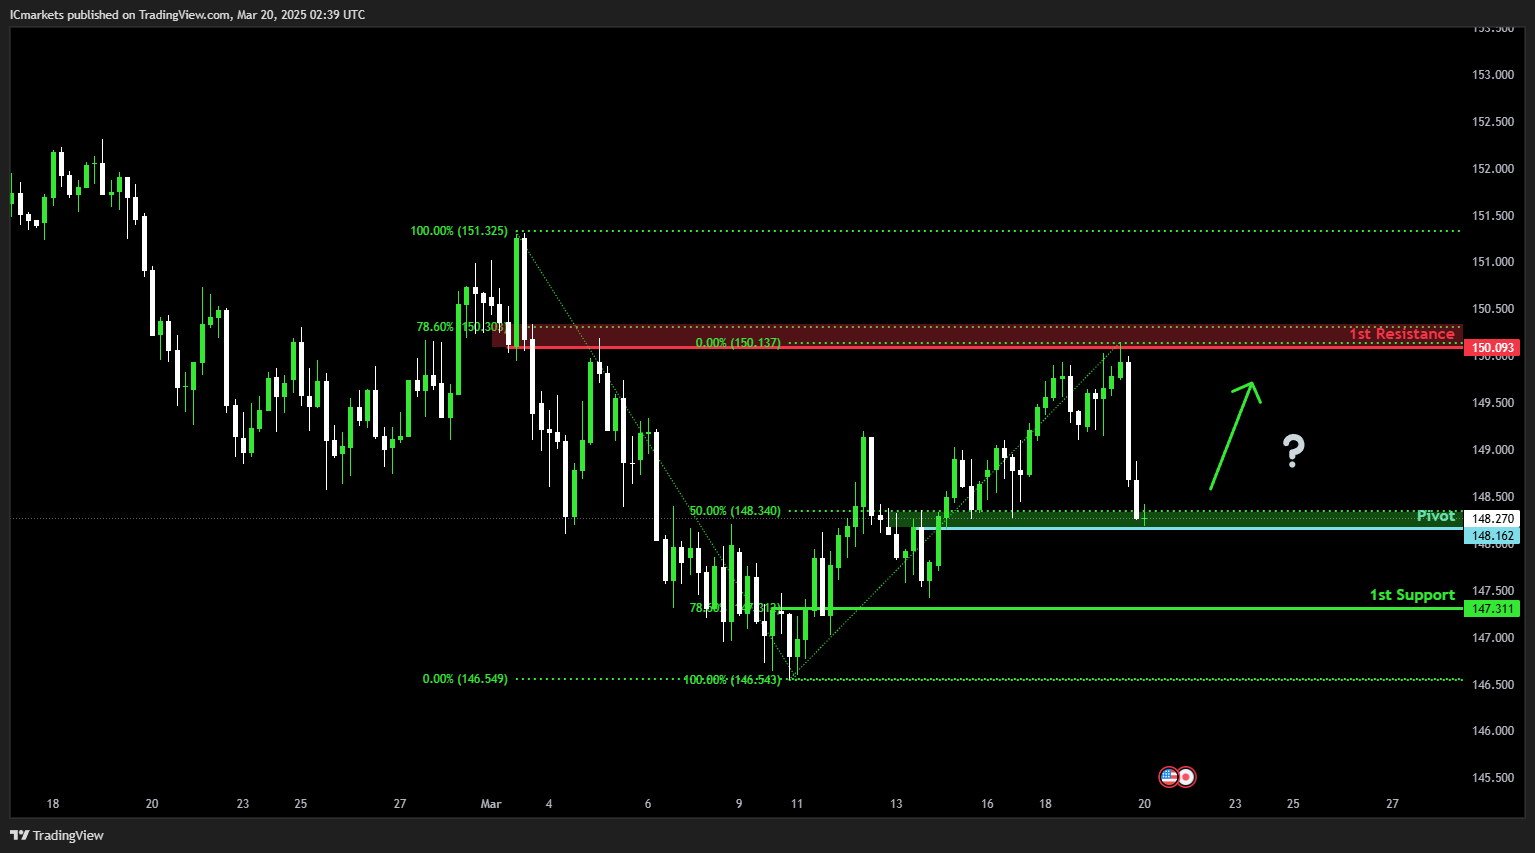
USD/JPY:
Potential Direction: Bullish
Overall momentum of the chart: Bearish
Price could potentially make a bullish bounce off this level and rise towards the 1st resistance.
Pivot: 148.16
Supporting reasons: Identified as a pullback support that aligns with the 50% Fibonacci retracement, indicating a potential area where buying interests could pick up to stage a rebound.
1st support: 147.31
Supporting reasons: Identified as a pullback support that aligns close to the 78.6% Fibonacci retracement, suggesting a potential area where the price could stabilize once more.
1st resistance: 150.09
Supporting reasons: Identified as an overlap resistance that aligns close to the 78.6% Fibonacci retracement, indicating a potential level that could cap further upward movement.
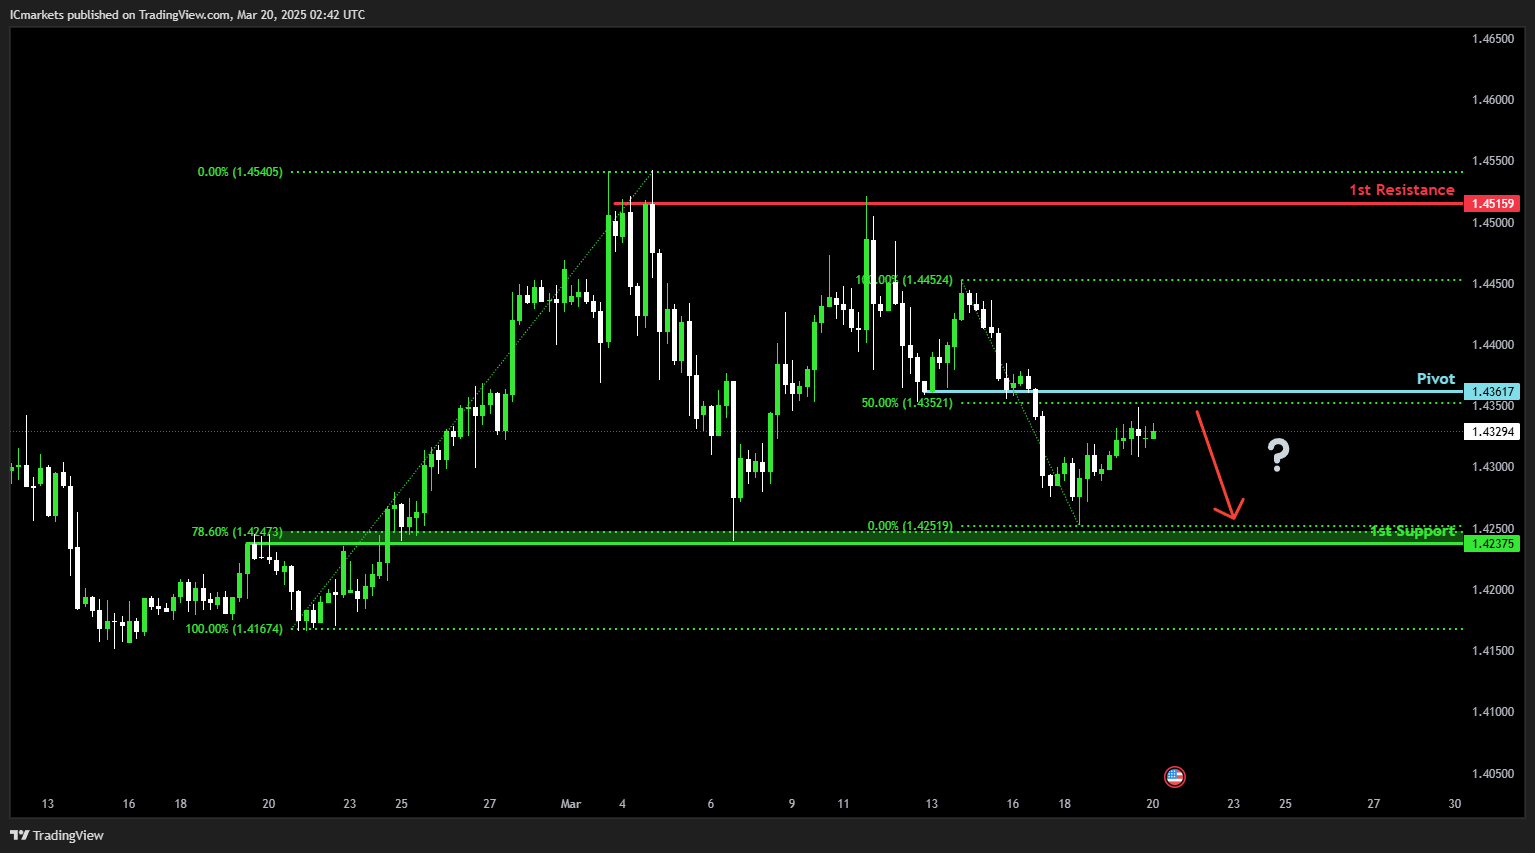
USD/CAD:
Potential Direction: Bearish
Overall momentum of the chart: Bullish
PPrice is rising towards the pivot and it could potentially make a bearish reversal off this level to fall towards the 1st support.
Pivot: 1.4361
Supporting reasons: Identified as a pullback resistance, that aligns close to the 50% Fibonacci retracement, indicating a potential area where selling pressures could intensify.
1st support: 1.4237
Supporting reasons: Identified as an overlap support that aligns with the 78.6% Fibonacci retracement, indicating a key level where the price could stabilize once more.
1st resistance: 1.4515
Supporting reasons: Identified as a multi swing-high resistance, indicating a potential area that could halt any further upward movement.
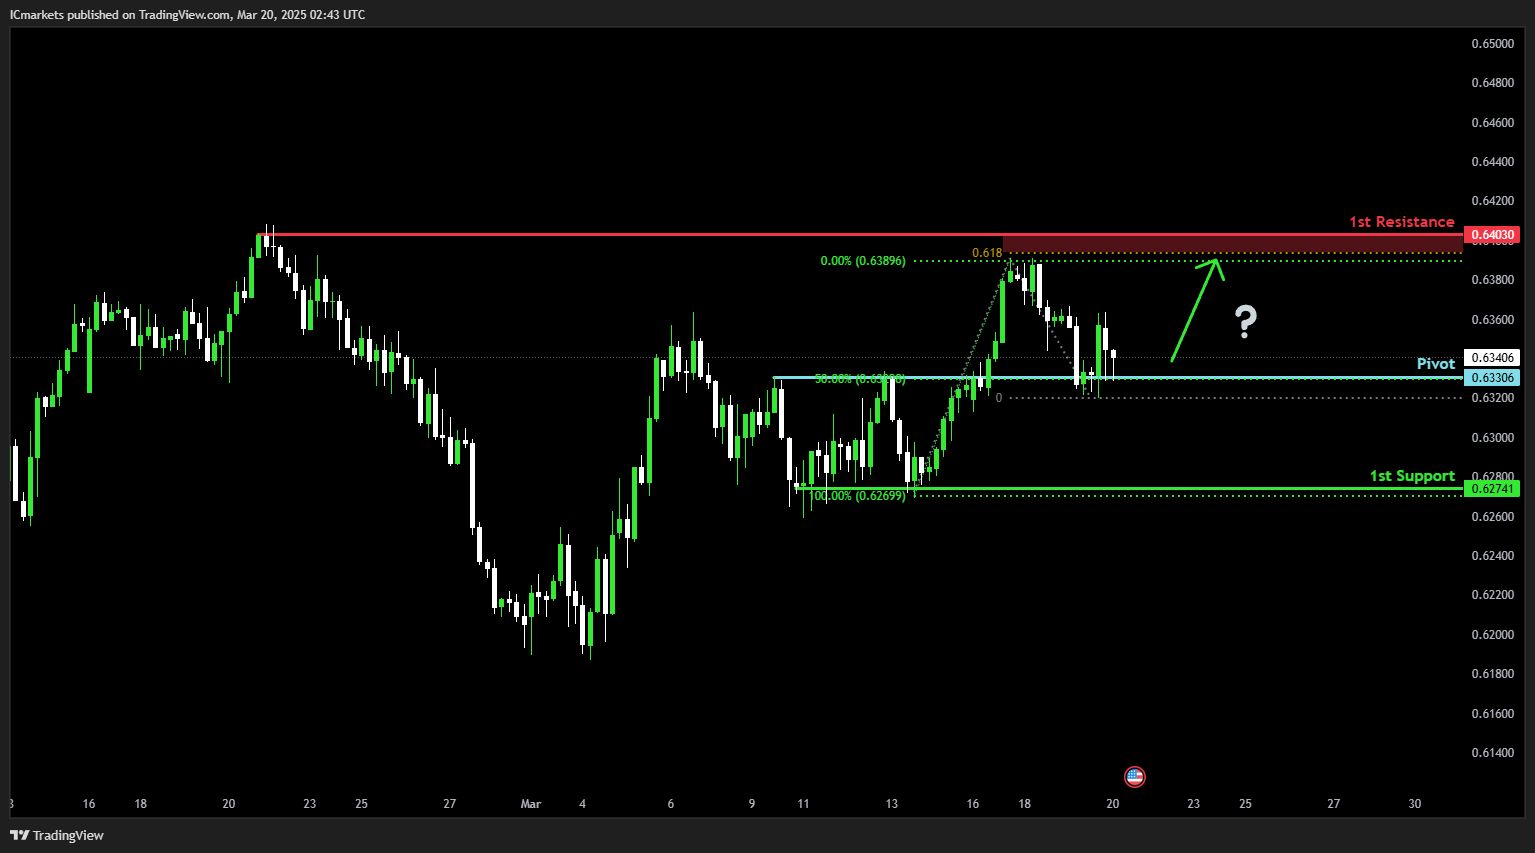
AUD/USD:
Potential Direction: Bullish
Overall momentum of the chart: Bearish
Price could potentially make a bullish bounce off this level to rise towards the 1st resistance.
Pivot: 0.6330
Supporting reasons: Identified as a pullback support that aligns with the 50% FIbonacci retracement, indicating a potential area where buying interests could pick up to stage a rebound.
1st support: 0.6274
Supporting reasons: Identified as a multi-swing low support, suggesting a potential area where the price could stabilize once again.
1st resistance: 0.6403
Supporting reasons: Identified as a swing high resistance that aligns with the 61.8% Fibonacci projection, indicating a potential area that could halt any further upward movement.
NZD/USD
Potential Direction: Bearish
Overall momentum of the chart: Neutral
Price could potentially make a bearish reversal off this level to fall towards the 1st support.
Pivot: 0.5829
Supporting reasons: Identified as a pullback resistance that aligns close to the 127.2 Fibonacci extension, indicating a potential area where selling pressures could intensify.
1st support: 0.5771
Supporting reasons: Identified as a pullback support, suggesting a potential area where the price could stabilize once more.
1st resistance: 0.5883
Supporting reasons: Identified as an overlap resistance that aligns with the 161.8% Fibonacci extension, indicating a potential area that could halt any further upward movement.
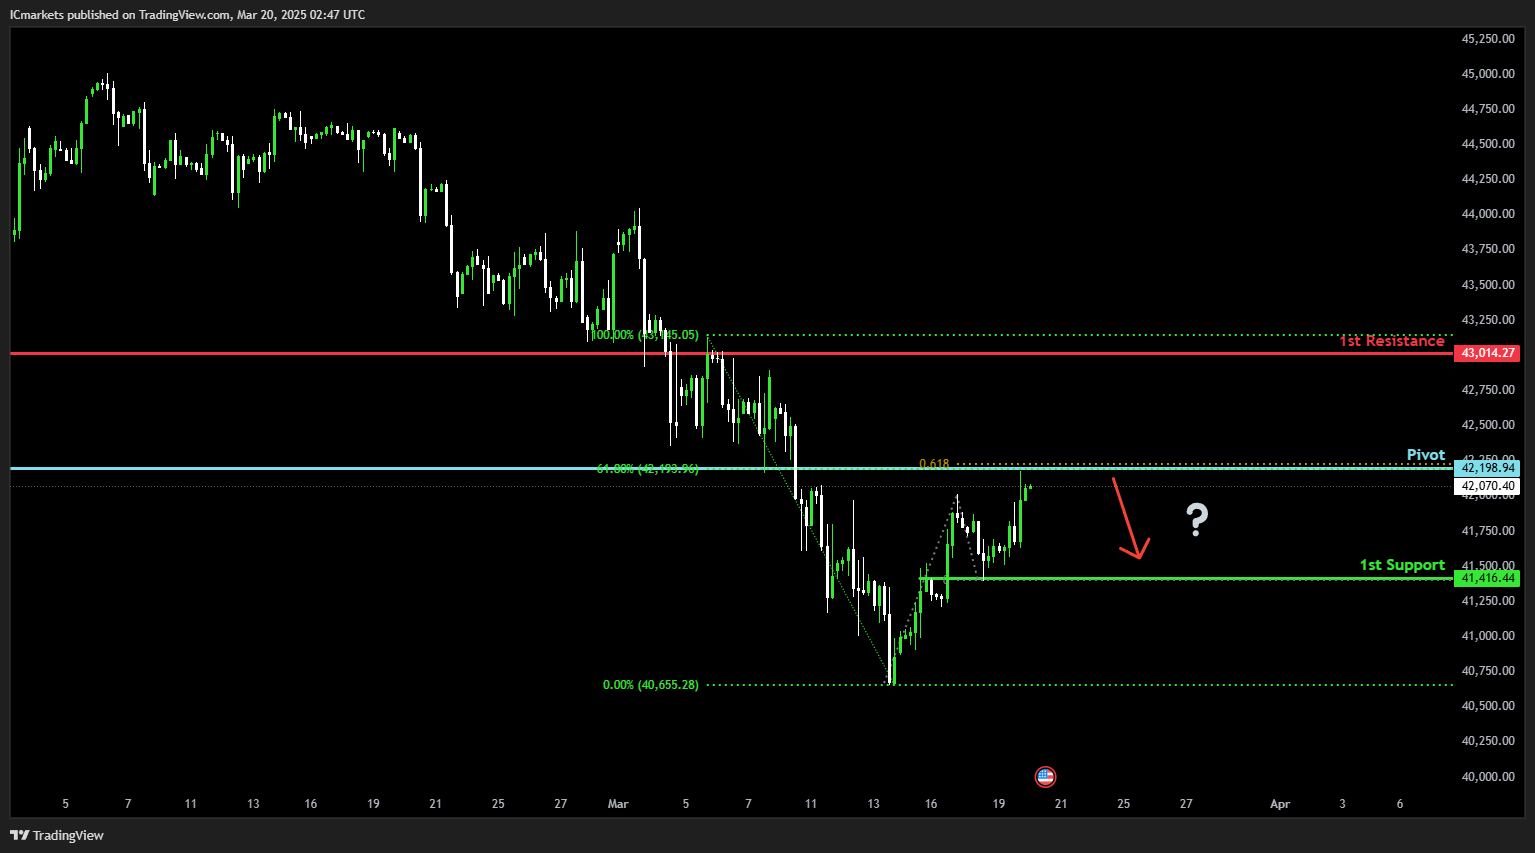
US30 (DJIA):
Potential Direction: Bearish
Overall momentum of the chart: Bearish
Price could potentially make a bearish reversal off this level to fall towards the 1st support.
Pivot: 42,198.94
Supporting reasons: Identified as a pullback resistance that aligns with the 61.8% Fibonacci retracement and the 61.8% Fibonacci projection, indicating a potential area where selling pressures could intensify..
1st support: 41,416.44
Supporting reasons: Identified as an overlap support, indicating a potential level where the price could stabilize once again.
1st resistance: 43,014.27
Supporting reasons: Identified as an overlap resistance, indicating a potential area that could halt any further upward movement.
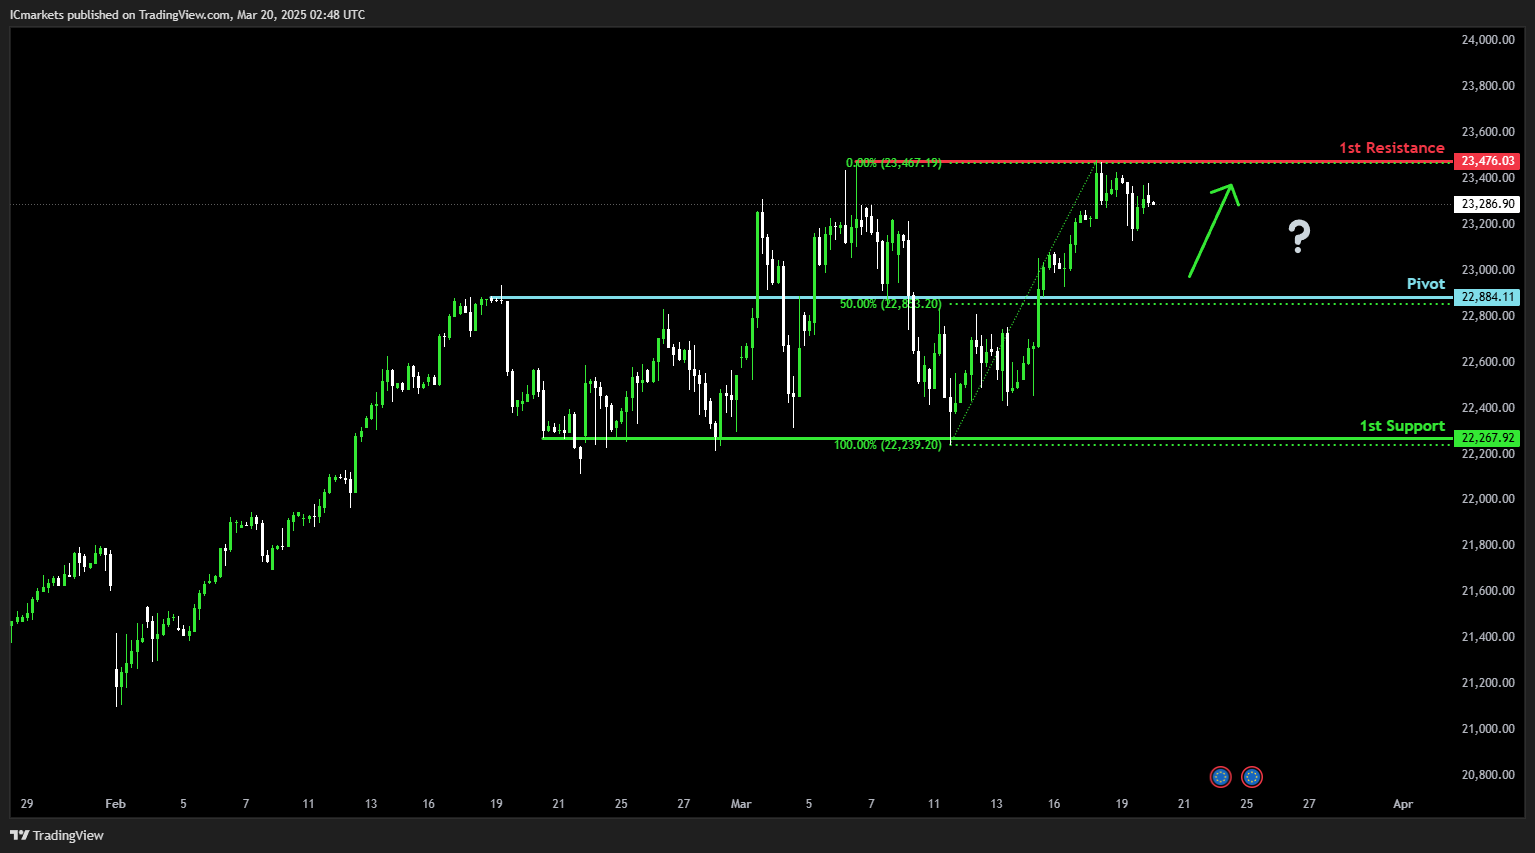
DE40 (DAX):
Potential Direction: Bullish
Overall momentum of the chart: Bearish
Price could fall towards the pivot and potentially make a bullish bounce off this level to rise towards the 1st resistance.
Pivot: 22,884.11
Supporting reasons: Identified as a pullback support that aligns close to the 50% Fibonacci retracement, indicating a potential area where buying interests could pick up to stage a rebound.
1st support: 22,267.92
Supporting reasons: Identified as a multi swing low support, indicating a key level where the price could stabilize once more.
1st resistance: 23,476.03
Supporting reasons: Identified as a swing-high resistance, indicating a potential area that could halt any further upward movement.
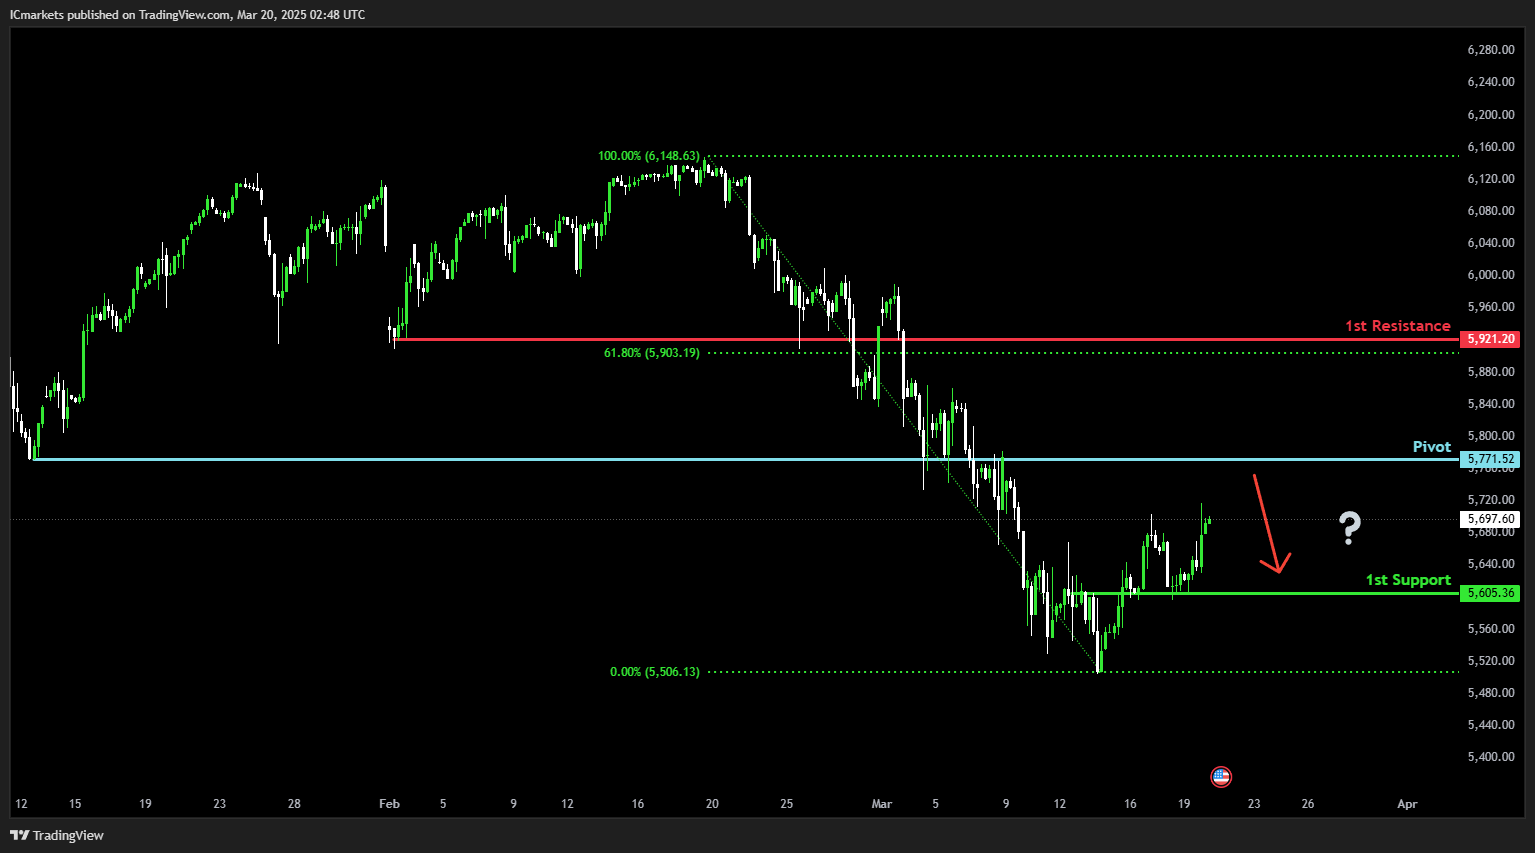
US500 (S&P 500):
Potential Direction: Bearish
Overall momentum of the chart: Bearish
Price could rise towards the pivot and potentially make a bearish reversal off this level to fall towards the 1st support.
Pivot: 5,771.52
Supporting reasons: Identified as a pullback resistance, indicating a potential area where selling pressures could intensify.
1st support: 5,605.36
Supporting reasons: Identified as an overlap support, indicating a potential level where the price could stabilize once again.
1st resistance: 5,921.20
Supporting reasons: Identified as a pullback resistance that aligns close to the 61.8% Fibonacci retracement, indicating a potential area that could halt any further upward movement.
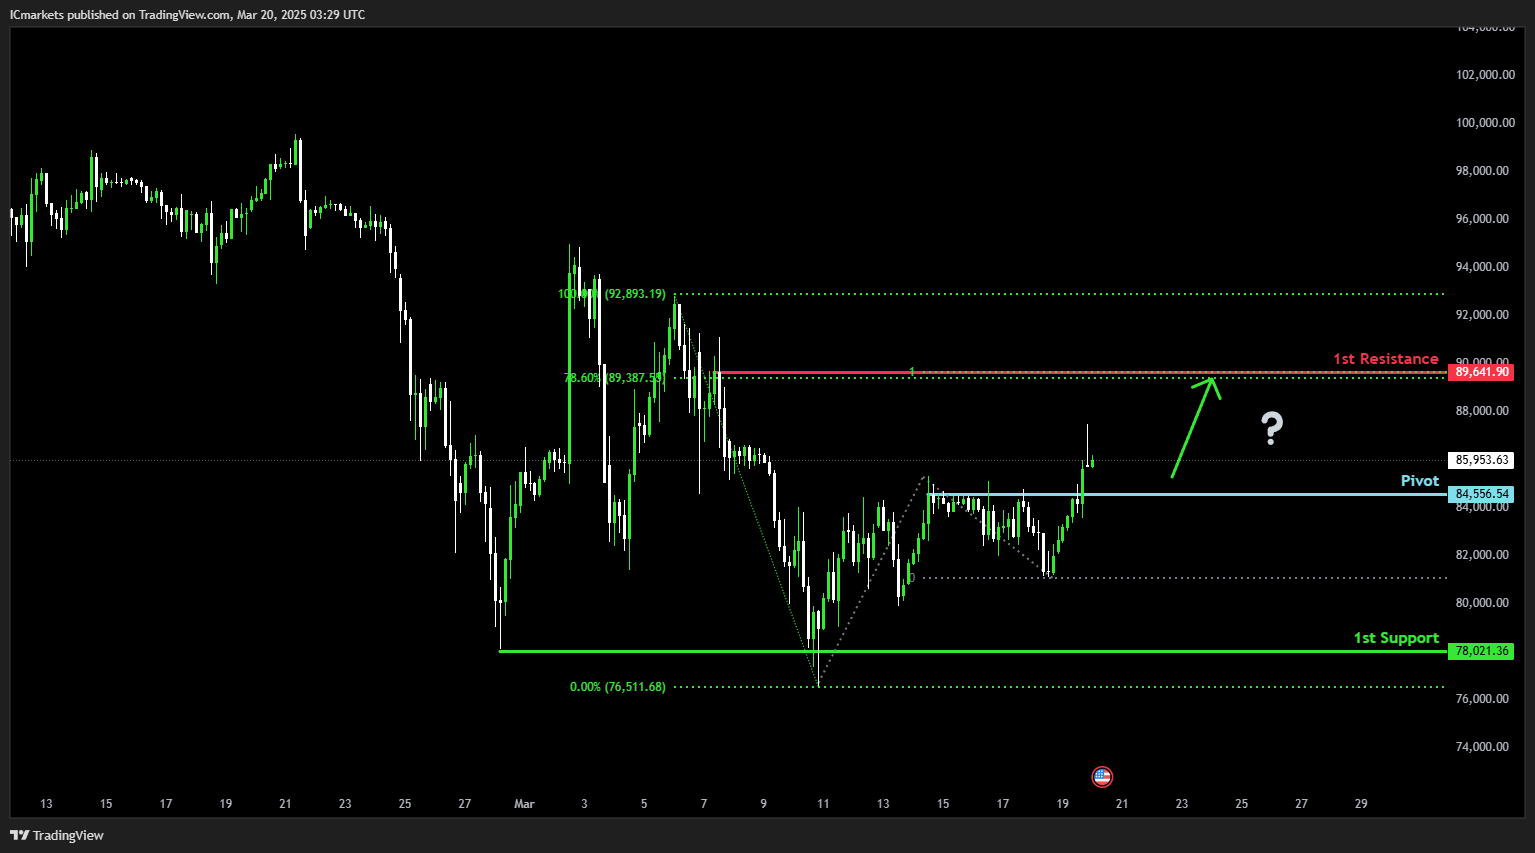
BTC/USD (Bitcoin):
Potential Direction: Bullish
Overall momentum of the chart: Bearish
Price could fall towards the pivot and potentially make a bullish bounce off this level to rise towards the 1st resistance.
Pivot: 84,556.54
Supporting reasons: Identified as a pullback support, indicating a potential area where buying interests could pick up to stage a rebound.
1st support: 78.021.36
Supporting reasons: Identified as a swing low support, indicating a potential level where the price could stabilize once more.
1st resistance: 89,641.90
Supporting reasons: Identified as a pullback resistance that aligns with the 78.6% Fibonacci retracement and the 100% Fibonacci porjection, indicating a potential area that could halt any further upward movement.
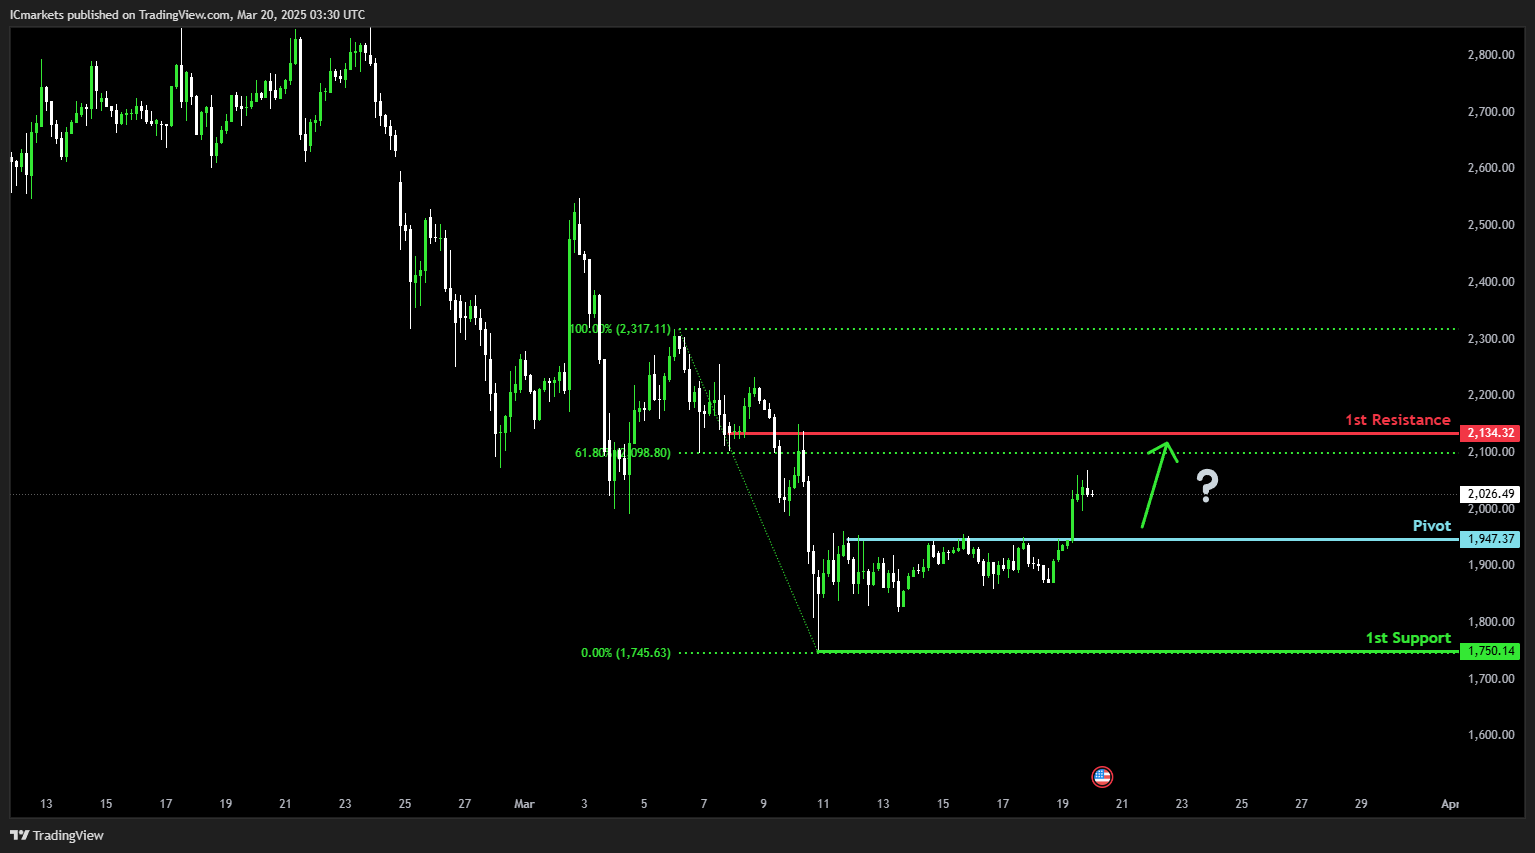
ETH/USD (Ethereum):
Potential Direction: Bullish
Overall momentum of the chart: Bearish
Price could fall towards the pivot and potentially make a bullish bounce off this level to rise towards the 1st resistance.
Pivot: 1,947.37
Supporting reasons: Identified as a pullback support, indicating a potential area where buying interests could pick up to stage a rebound.
1st support: 1,750.14
Supporting reasons: Identified as a swing-low support, indicating a potential level where the price could stabilize once again.
1st resistance: 2,134.32
Supporting reasons: Identified as an overlap resistance that aligns close to the 61.8% Fibonacci retrtacement, indicating a potential area that could halt any further upward movement.
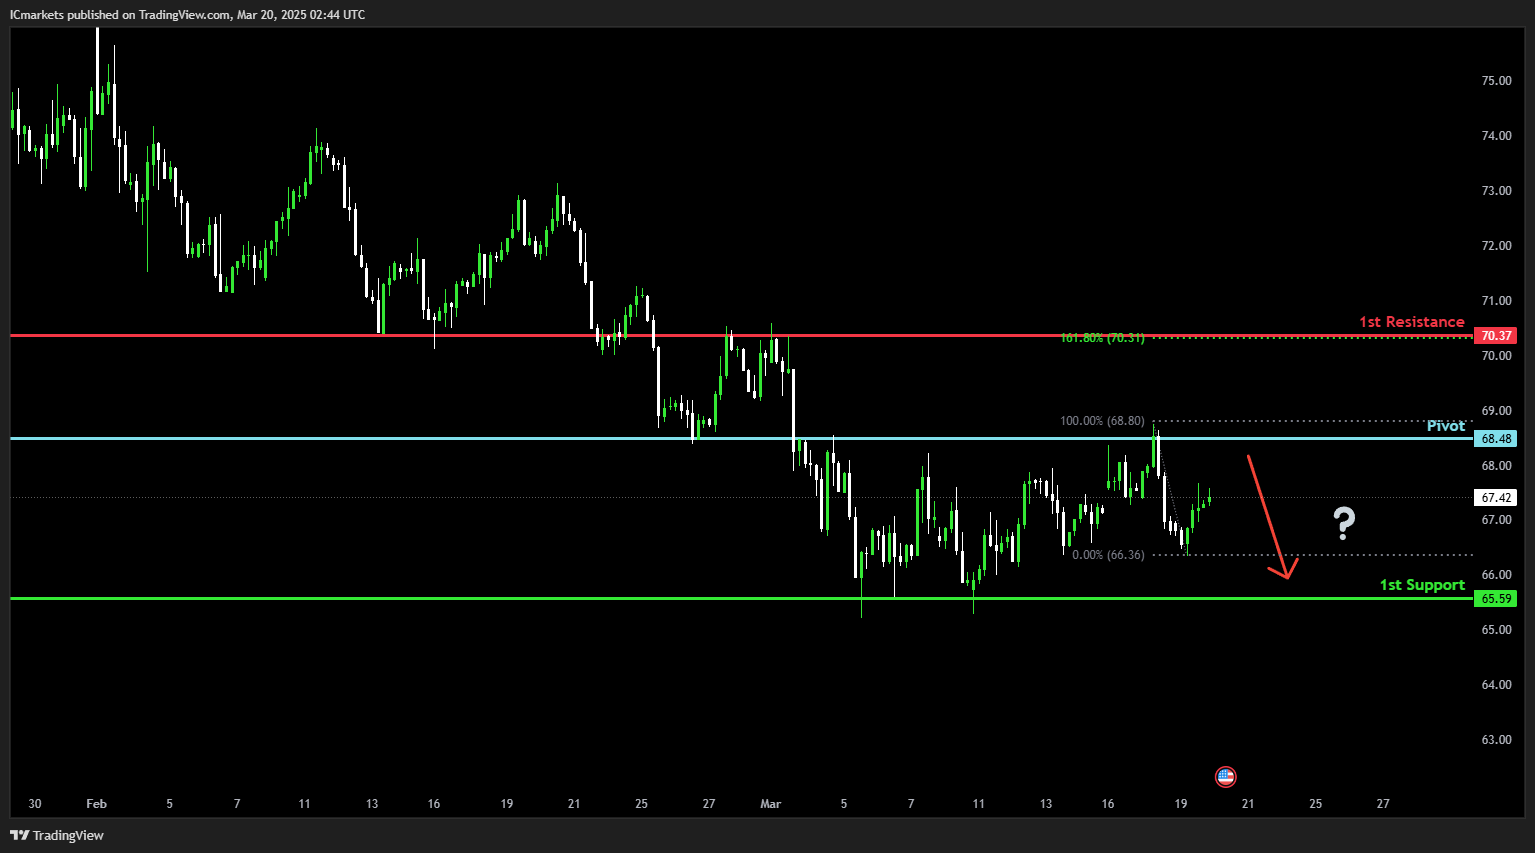
WTI/USD (Oil):
Potential Direction: Bearish
Overall momentum of the chart: Bearish
Price could make a bearish contination toward the 1st support.
Pivot: 68.48
Supporting reasons: Identified as a pullback resistance, indicating a potential area where selling pressures could intensify.
1st support: 65.59
Supporting reasons: Identified as a multi-swing-low support, indicating a key level where the price could stabilize once more.
1st resistance: 70.37
Supporting reasons: Identified as an overlap resistance that aligns with the 161.8% Fibonacci extension, indicating a potential area that could halt any further upward movement.
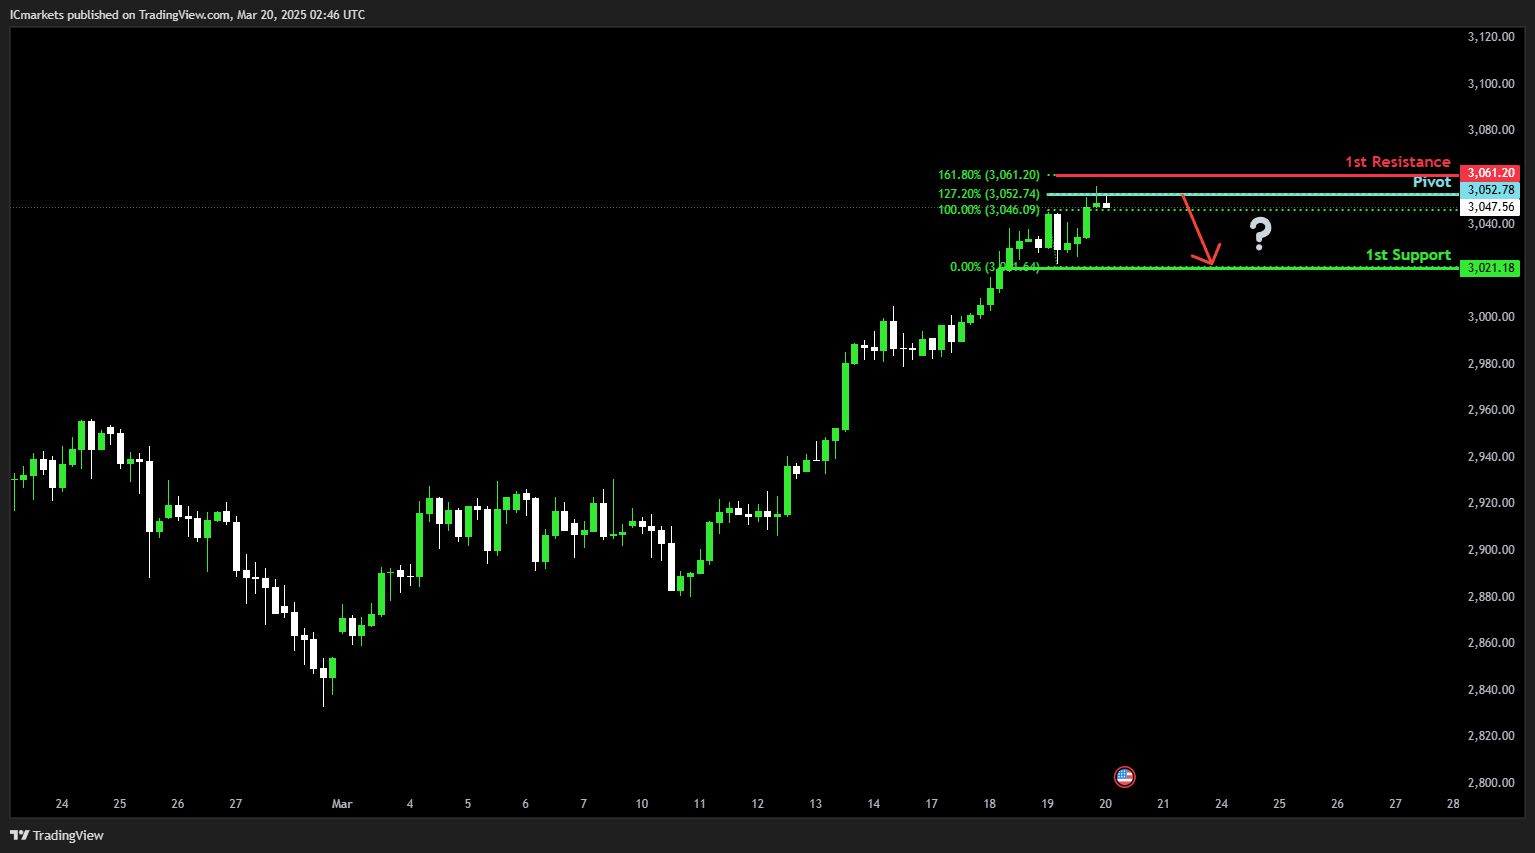
XAU/USD (GOLD):
Potential Direction: Bearish
Overall momentum of the chart: Bullish
Price could potentially make a bearish reversal off this level to fall towards the 1st support.
Pivot: 3052.78
Supporting reasons: Identified as a swing high resistance that aligns with the 127.2% Fibonacci extension, indicating a potential area where selling pressures could intensify.
1st support: 3021.18
Supporting reasons: Identified as a swing low support, acting as a potential level where price could stabilize once again.
1st resistance: 3061.20
Supporting reasons: Identified as a resistance that aligns with the 161.8% Fibonacci extension, indicating a potential area that could halt any further upward movement.
The accuracy, completeness and timeliness of the information contained on this site cannot be guaranteed. IC Trading does not warranty, guarantee or make any representations, or assume any liability regarding financial results based on the use of the information in the site.
News, views, opinions, recommendations and other information obtained from sources outside of www.ictrading.com, used in this site are believed to be reliable, but we cannot guarantee their accuracy or completeness. All such information is subject to change at any time without notice. IC Trading assumes no responsibility for the content of any linked site.
The fact that such links may exist does not indicate approval or endorsement of any material contained on any linked site. IC Trading is not liable for any harm caused by the transmission, through accessing the services or information on this site, of a computer virus, or other computer code or programming device that might be used to access, delete, damage, disable, disrupt or otherwise impede in any manner, the operation of the site or of any user’s software, hardware, data or property.