
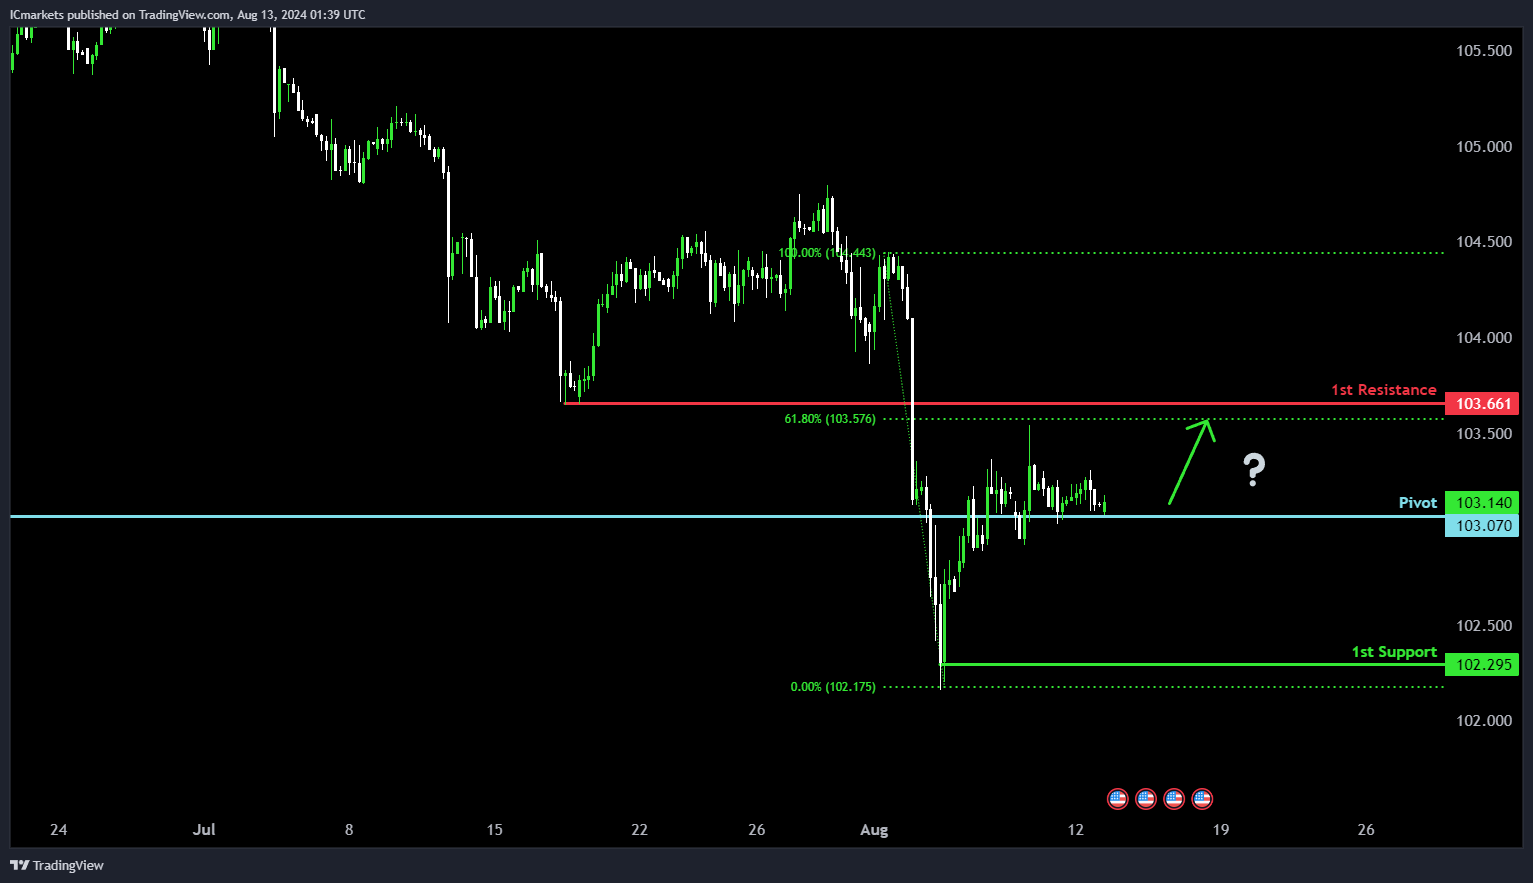
DXY (US Dollar Index):
Potential Direction: Bullish
Overall momentum of the chart: Bullish
Price could potentially make a bullish bounce off the pivot and head towards the 1st resistance.
Pivot: 103.07
Supporting reasons: Identified as an overlap support, indicating a level where the price may find buying interest and reverse upwards.
1st support: 102.29
Supporting reasons: Identified as a swing low support, suggesting an area where the price previously found support and may do so again.
1st resistance: 103.66
Supporting reasons: Supported by a 61.80% Fibonacci retracement, indicating a potential area where the price could encounter resistance as it retraces upward.
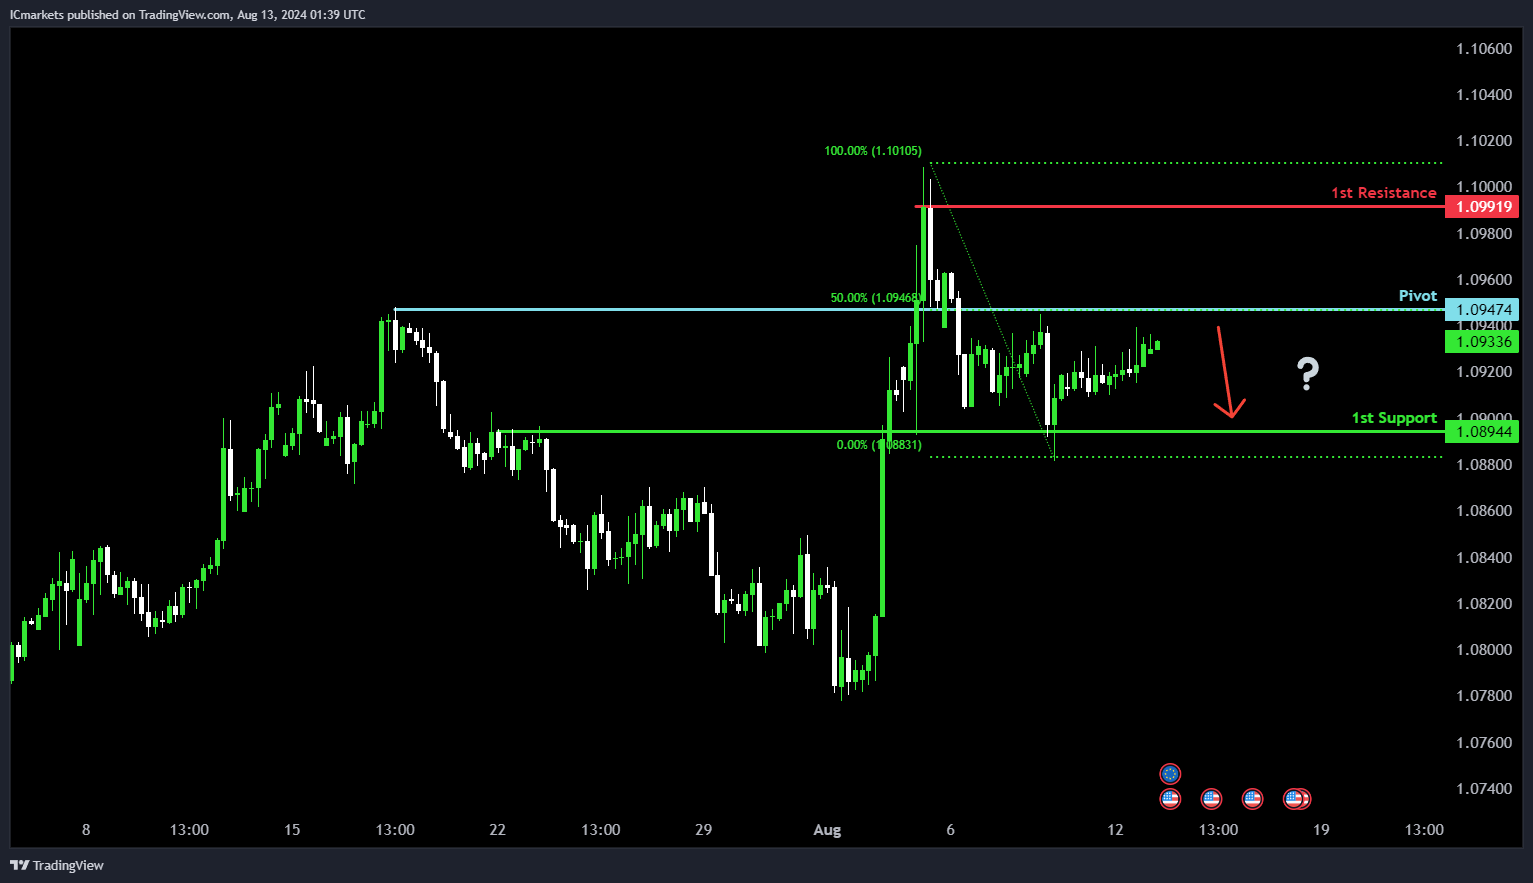
EUR/USD:
Potential Direction: Bearish
Overall momentum of the chart: Bearish
Price could potentially make a bearish reaction off the pivot and drop to the 1st support.
Pivot: 1.0947
Supporting reasons: Identified as an overlap resistance level, reinforced by the 50% Fibonacci retracement, indicating a potential area where sellers could enter the market.
1st support: 1.0894
Supporting reasons: Identified as an overlap support level, suggesting a significant area where previous declines have found support.
1st resistance: 1.0991
Supporting reasons: Identified as swing high resistance, indicating a historical point where previous rallies have faced selling pressure or reversed.
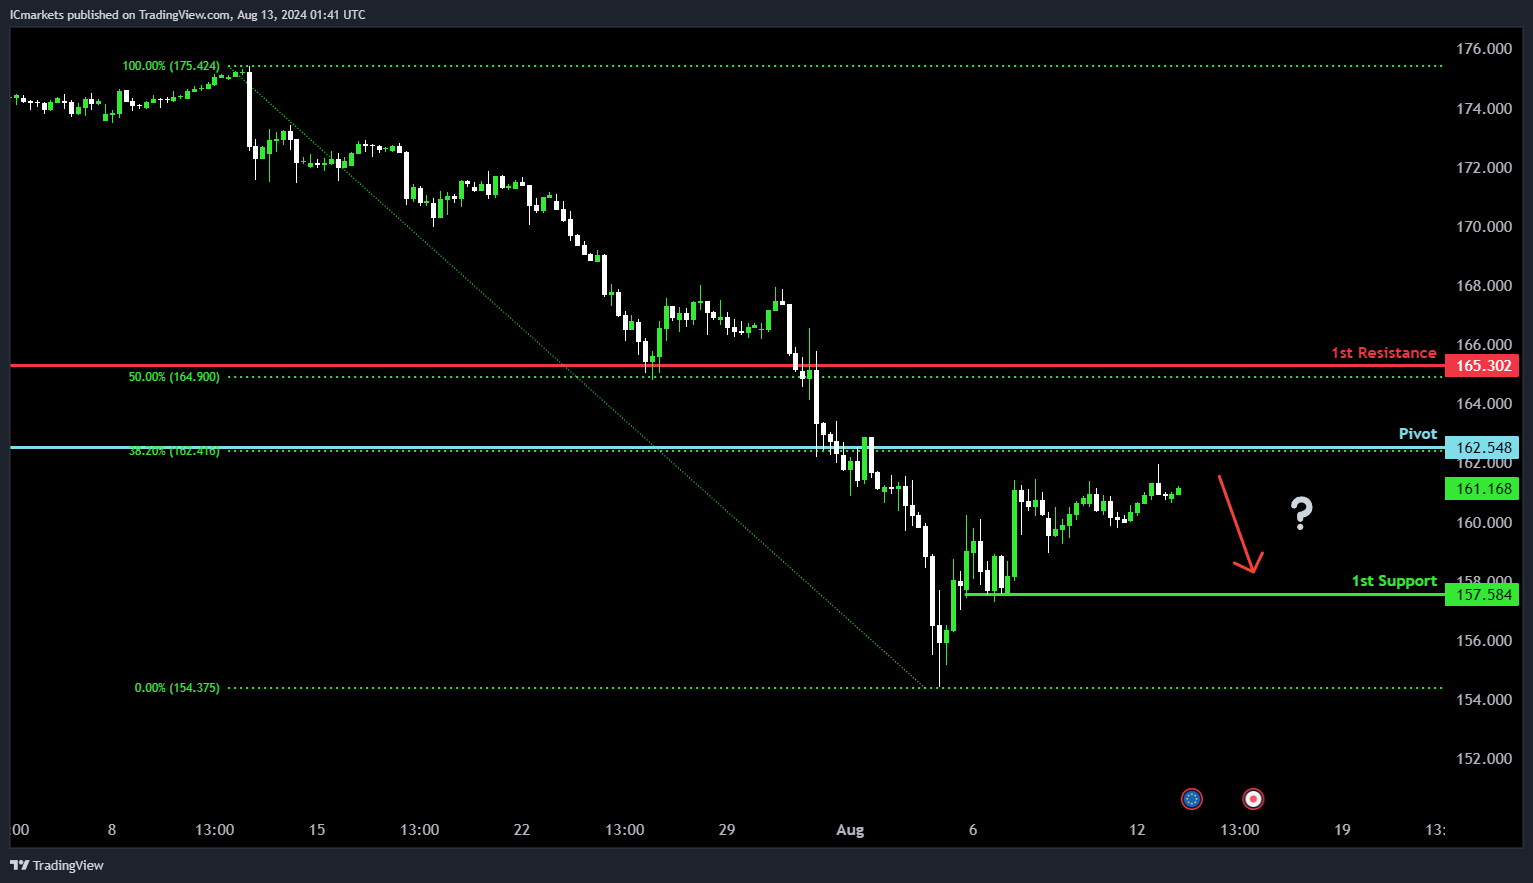
EUR/JPY:
Potential Direction: Bearish
Overall momentum of the chart: Bearish
Price could potentially make a bearish reaction off the pivot and drop to the 1st support.
Pivot: 162.54
Supporting reasons: Identified as an overlap resistance level, reinforced by the 38.20% Fibonacci retracement, indicating a potential area where sellers could enter the market.
1st support: 157.58
Supporting reasons: Identified as a swing low support level, suggesting a significant area where previous declines have found support.
1st resistance: 165.30
Supporting reasons: Identified as an overlap resistance level, reinforced by the 50% Fibonacci retracement, indicating a historical point where previous rallies have faced selling pressure or reversed.
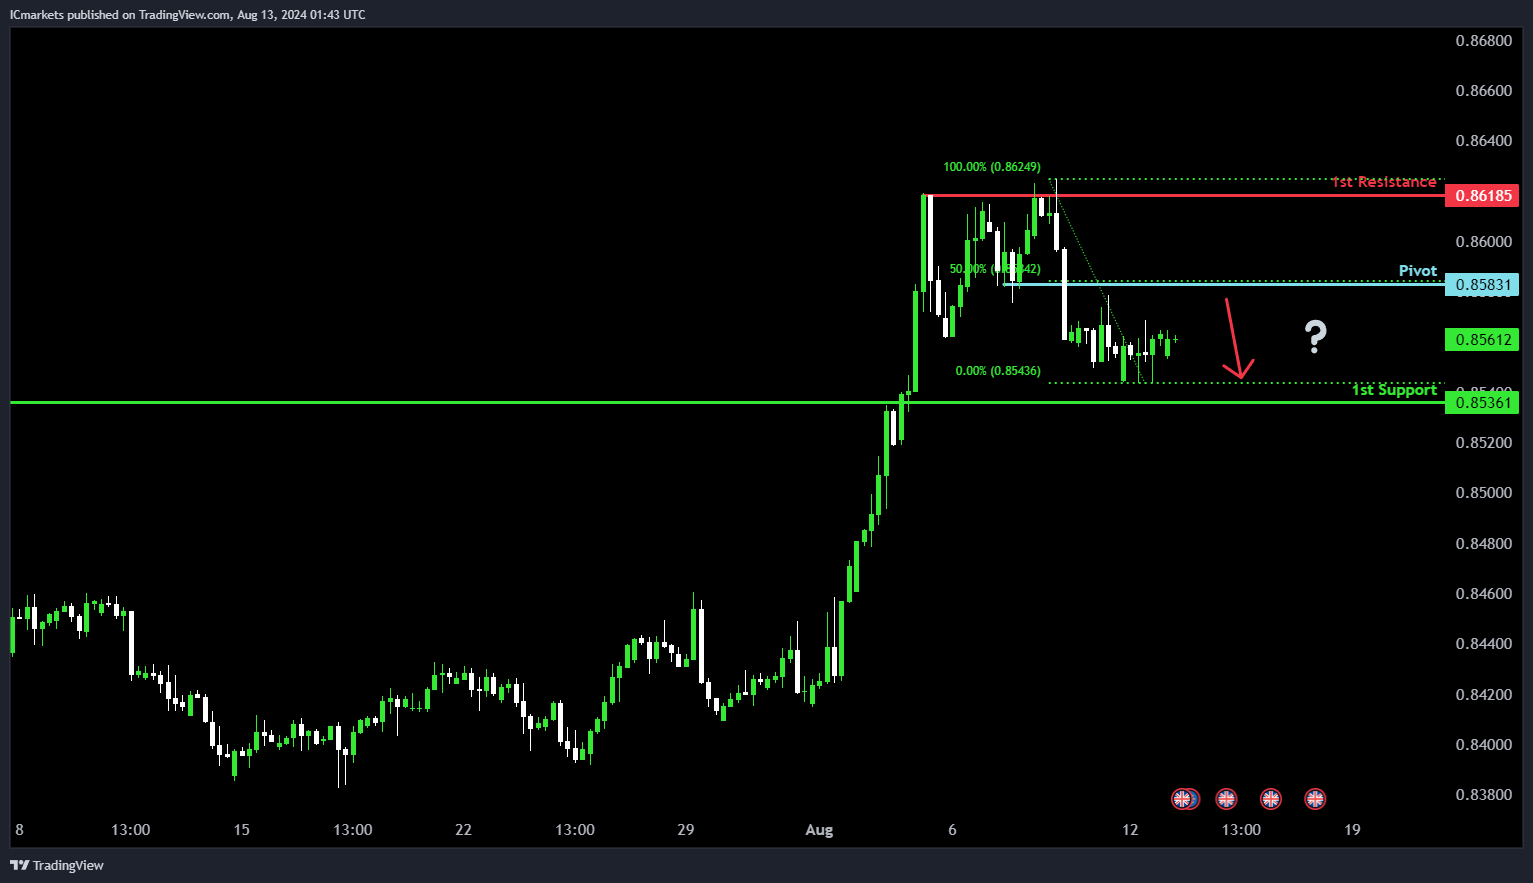
EUR/GBP:
Potential Direction: Bearish
Overall momentum of the chart: Bearish
Price could potentially make a bearish reaction off the pivot and drop to the 1st support.
Pivot: 0.8583
Supporting reasons: Identified as a pullback resistance level, reinforced by the 50% Fibonacci retracement, indicating a potential area where sellers could enter the market.
1st support: 0.8536
Supporting reasons: Identified as a pullback support level, suggesting a significant area where previous declines have found support.
1st resistance: 0.8618
Supporting reasons: Identified as a multi-swing high resistance level, indicating a historical point where previous rallies have faced selling pressure or reversed.
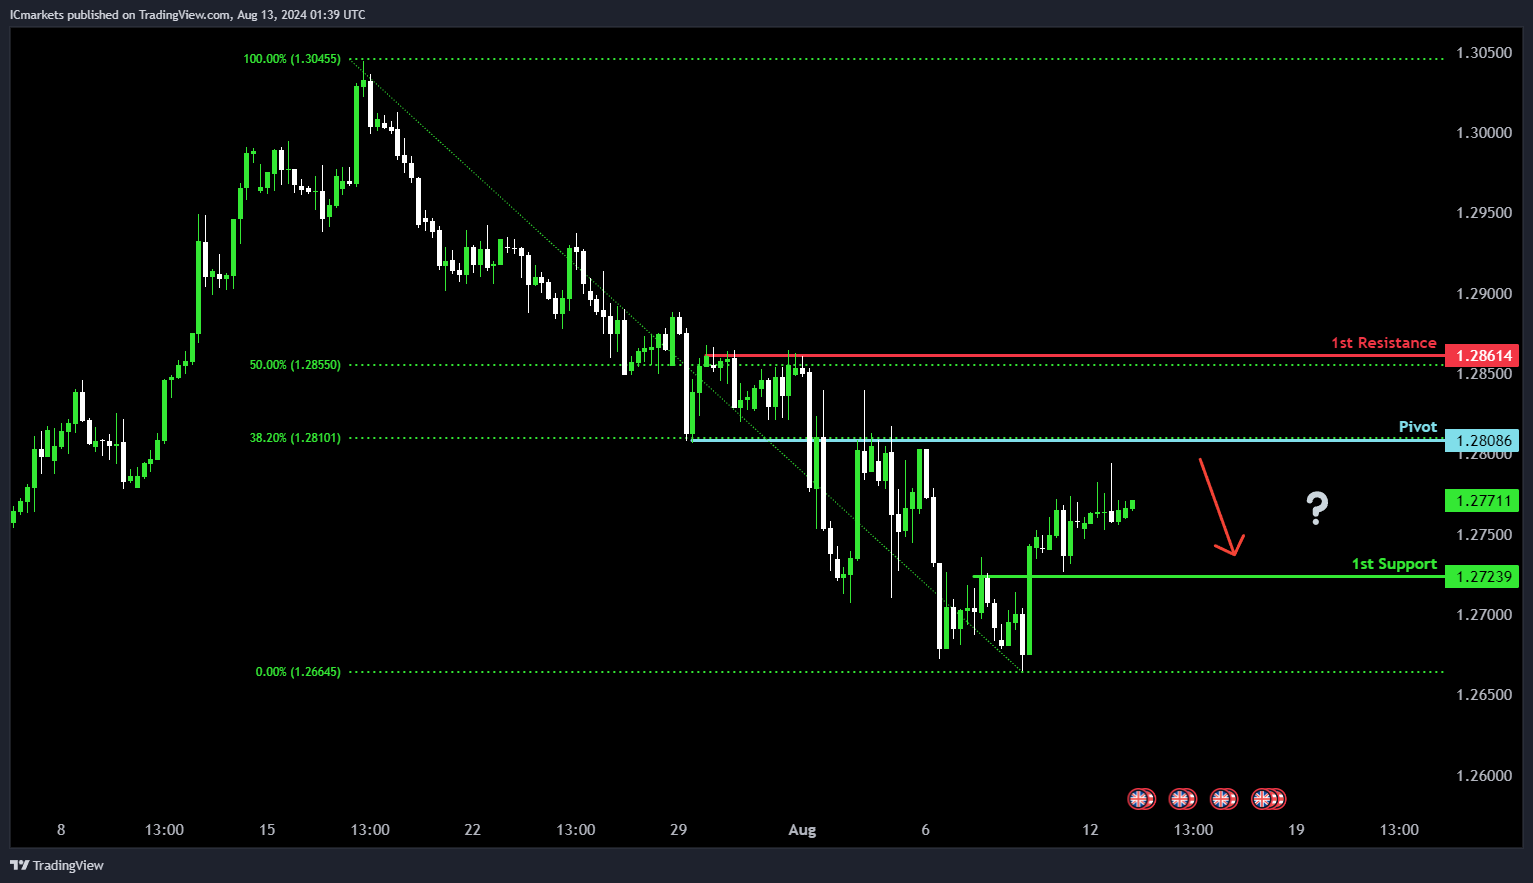
GBP/USD:
Potential Direction: Bearish
Overall momentum of the chart: Bearish
Price could potentially make a bearish reaction off the pivot and drop to the 1st support.
Pivot: 1.2808
Supporting reasons: Identified as an overlap resistance level, reinforced by the 38.20% Fibonacci retracement, indicating a potential area where sellers could enter the market.
1st support: 1.2723
Supporting reasons: Identified as an overlap support level, suggesting a significant area where previous declines have found support.
1st resistance: 1.2861
Supporting reasons: Identified as an overlap resistance level, reinforced by the 50% Fibonacci retracement, indicating a historical point where previous rallies have faced selling pressure or reversed.
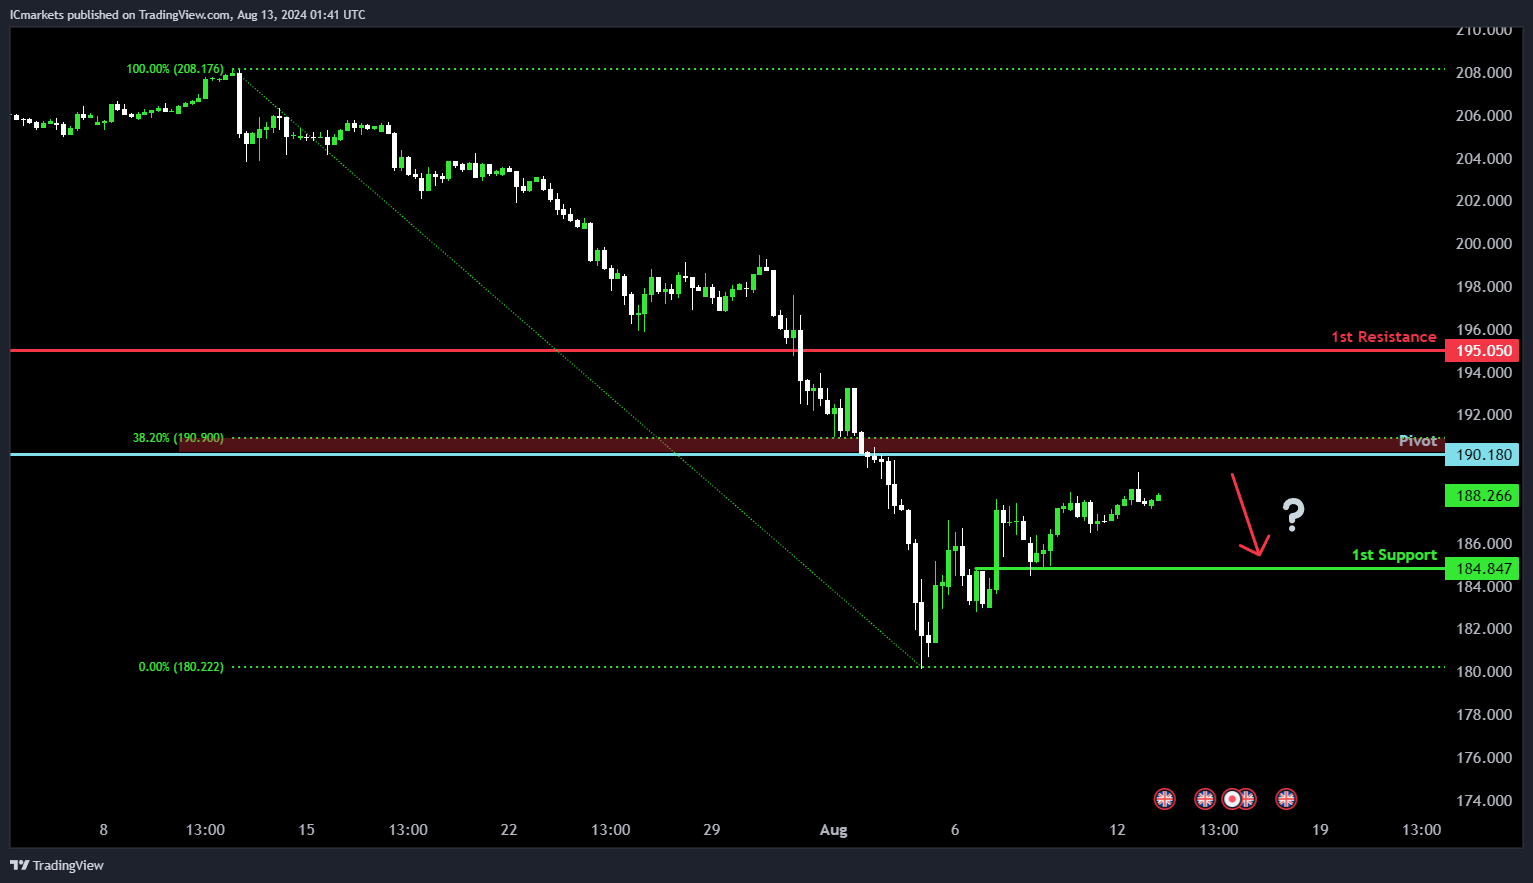
GBP/JPY:
Potential Direction: Bearish
Overall momentum of the chart: Bearish
Price could potentially make a bearish reaction off the pivot and drop to the 1st support.
Pivot: 190.18
Supporting reasons: Identified as pullback resistance, reinforced by the 38.20% Fibonacci retracement, indicating a potential area where sellers could re-enter the market.
1st support: 184.84
Supporting reasons: Identified as an overlap support level, suggesting a significant area where previous declines have found support.
1st resistance: 195.05
Supporting reasons: Identified as pullback resistance, indicating a historical point where previous rallies have faced selling pressure or reversed.
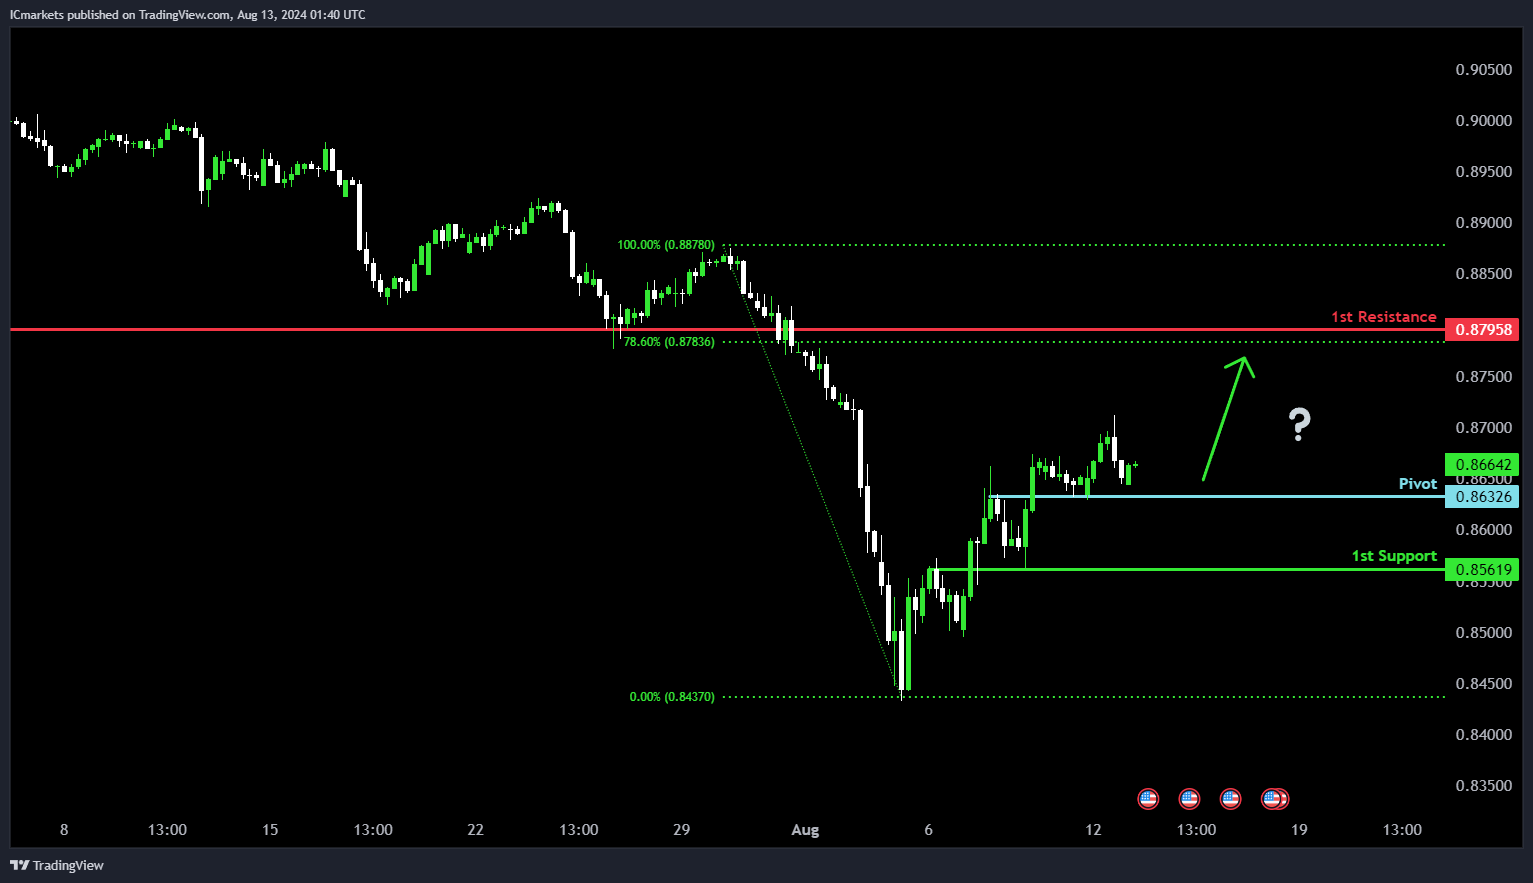
USD/CHF:
Potential Direction: Bullish
Overall momentum of the chart: Bullish
Price could potentially make a bullish bounce off the pivot and head towards the 1st resistance.
Pivot: 0.8632
Supporting reasons: Identified as an overlap support level, reinforced by the 50% Fibonacci retracement, indicating a potential area where buyers could enter the market.
1st support: 0.8561
Supporting reasons: Identified as an overlap support level, suggesting a significant area where previous declines have found support.
1st resistance: 0.8795
Supporting reasons: Identified as pullback resistance, reinforced by the 78.60% Fibonacci retracement, indicating a historical point where previous rallies have faced selling pressure or reversed.
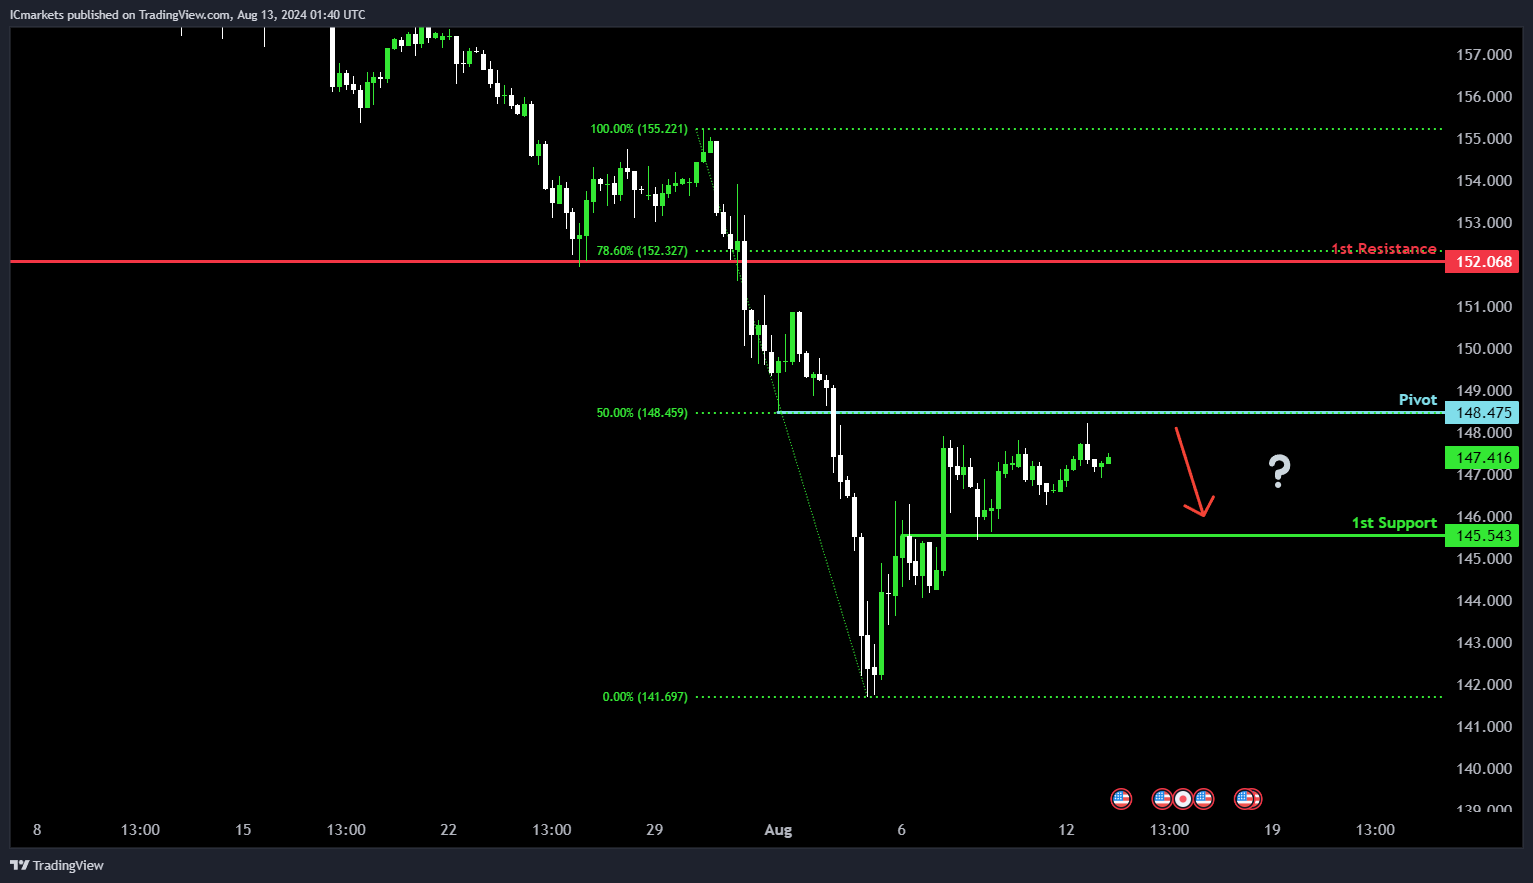
USD/JPY:
Potential Direction: Bearish
Overall momentum of the chart: Bearish
Price could potentially make a bearish reaction off the pivot and drop to the 1st support.
Pivot: 148.47
Supporting reasons: Identified as pullback resistance, reinforced by the 50% Fibonacci retracement, indicating a potential area where sellers could enter the market.
1st support: 145.54
Supporting reasons: Identified as an overlap support level, suggesting a significant area where previous declines have found support.
1st resistance: 152.06
Supporting reasons: Identified as pullback resistance, reinforced by the 78.60% Fibonacci retracement, indicating a historical point where previous rallies have faced selling pressure or reversed.
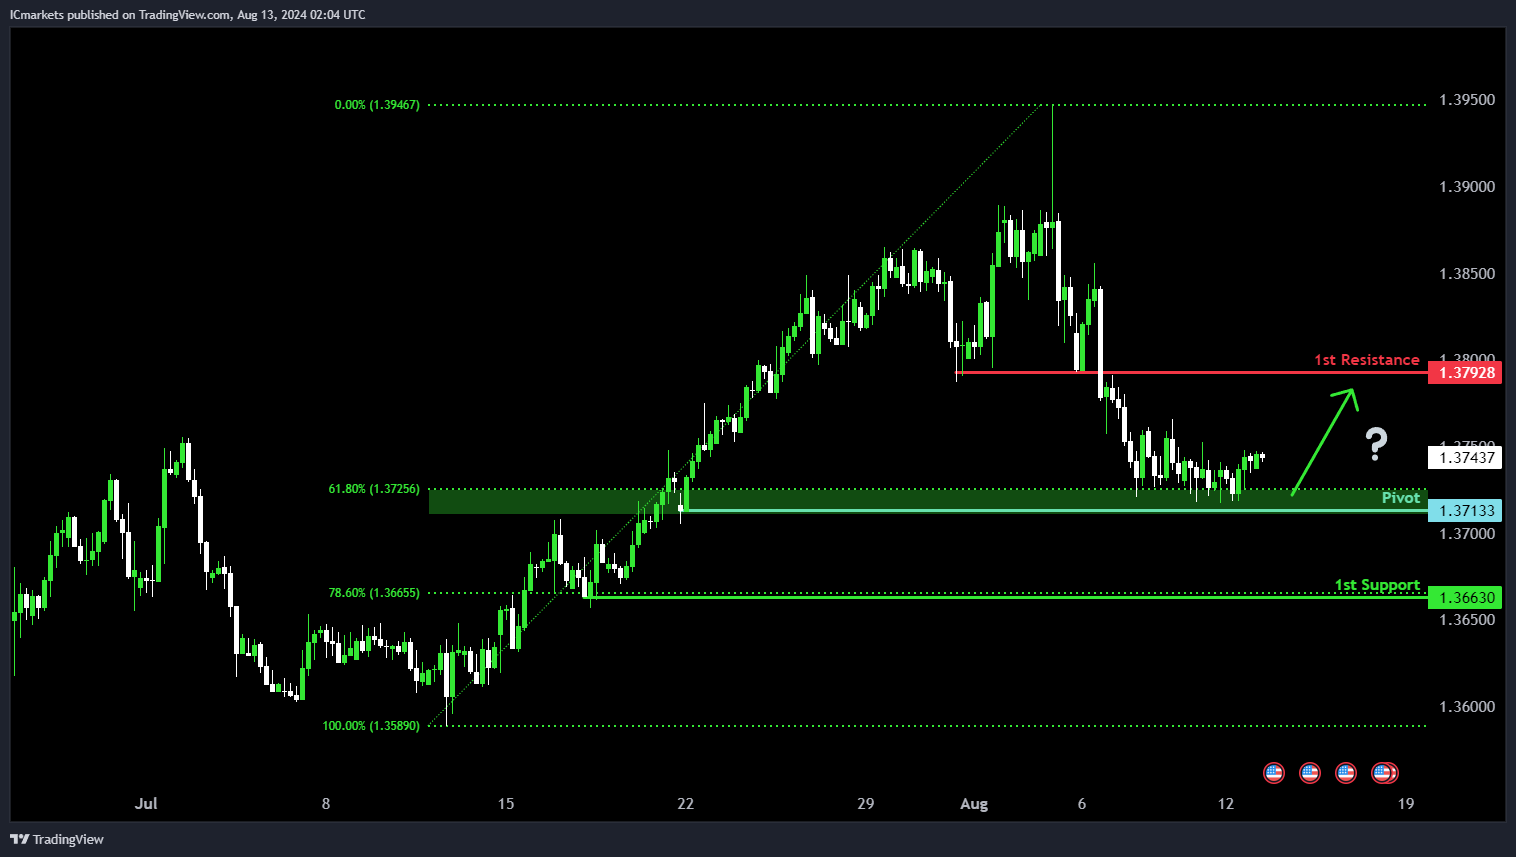
USD/CAD:
Potential Direction: Bullish
Overall momentum of the chart: Bearish
Price has made a bullish bounce of the pivot and could potentially rise towards the 1st resistance.
Pivot: 1.3713
Supporting reasons: Identified as a pullback support that aligns close to a 61.8% Fibonacci retracement level, indicating a potential area where buying interests could pick up to stage a minor rebound.
1st support: 1.3663
Supporting reasons: Identified as a pullback support that aligns with a 78.6% Fibonacci retracement level, indicating a potential area where price has found support in the past.
1st resistance: 1.3792
Supporting reasons: Identified as a pullback resistance, indicating a potential area that could halt any further upward movement.
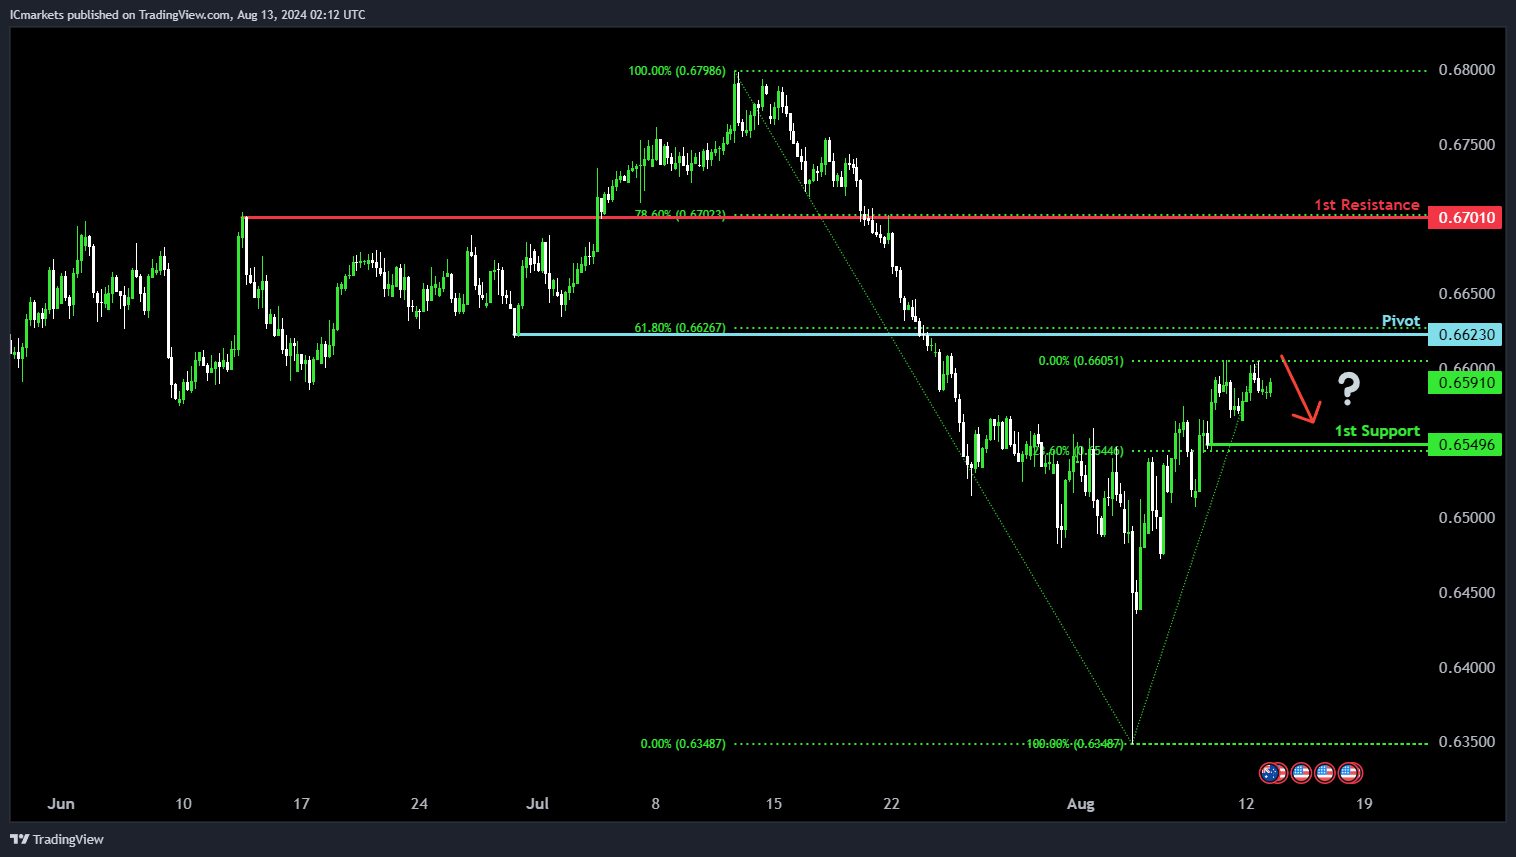
AUD/USD:
Potential Direction: Bearish
Overall momentum of the chart: Bullish
Price could rise towards the pivot and potentially make a bearish reversal off this level to pull back towards the 1st support.
Pivot: 0.6623
Supporting reasons: Identified as a pullback resistance that aligns with a 61.8% Fibonacci retracement level, indicating a potential area where selling pressures could intensify.
1st support: 0.6549
Supporting reasons: Identified as a pullback support that aligns with a 23.6% Fibonacci retracement level, suggesting a significant area where price has recently found support.
1st resistance: 0.6701
Supporting reasons: Identified as an overlap resistance that aligns with a 78.6% Fibonacci retracement level, indicating a significant area that could halt further upward movement.
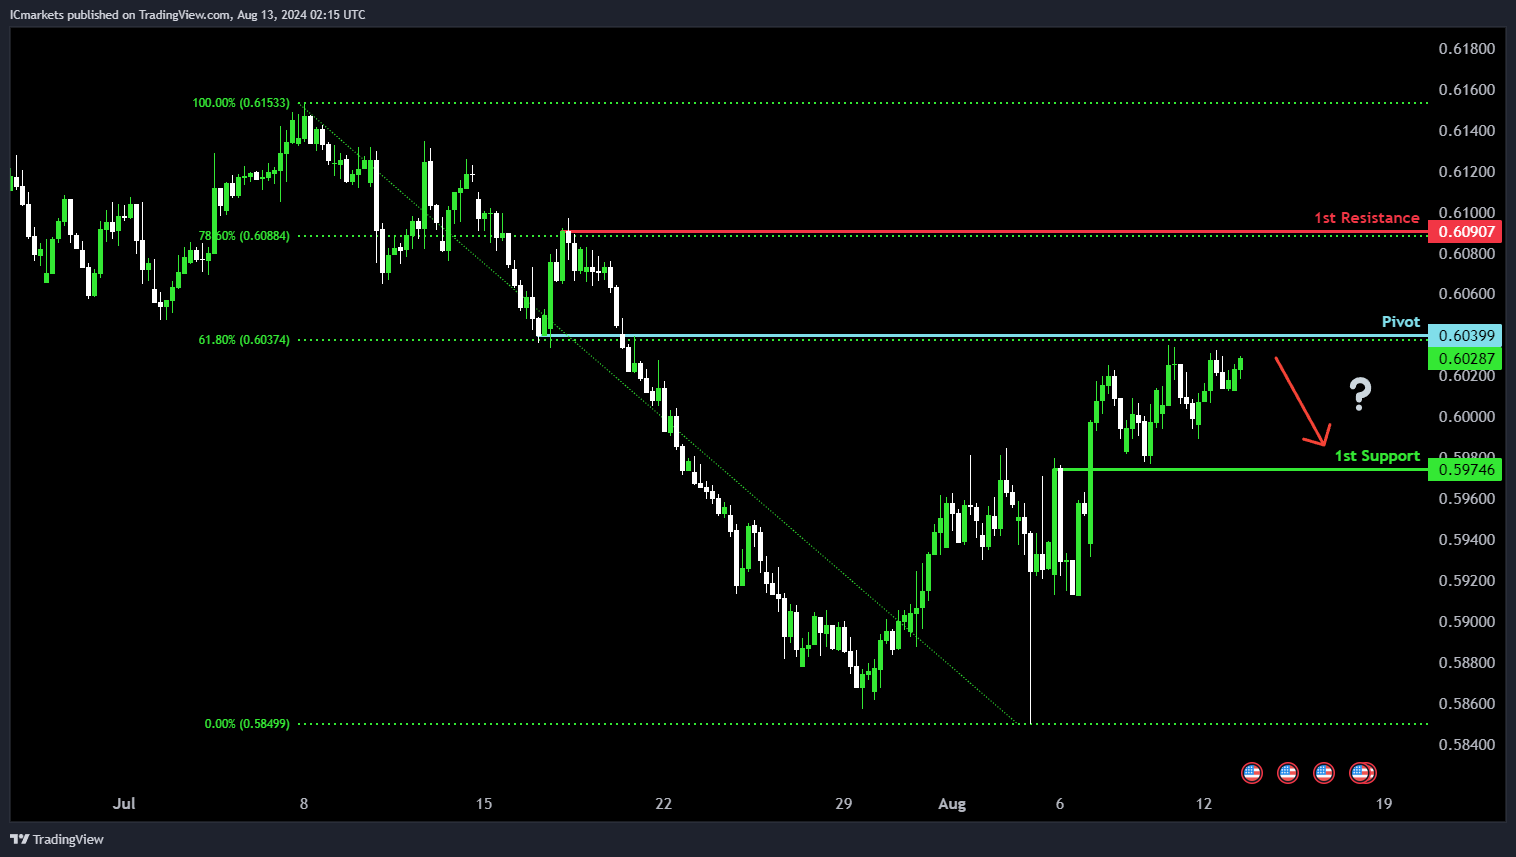
NZD/USD
Potential Direction: Bearish
Overall momentum of the chart: Bullish
Price could rise towards the pivot and potentially make a bearish reversal off this level to pull back towards the 1st support.
Pivot: 0.6039
Supporting reasons: Identified as a pullback resistance that aligns with a 61.8% Fibonacci retracement level, indicating a potential area where selling pressures could intensify.
1st support: 0.5974
Supporting reasons: Identified as a pullback support, suggesting a potential area where price could find strong support.
1st resistance: 0.6090
Supporting reasons: Identified as a pullback resistance that aligns with a 78.6% Fibonacci retracement level, indicating a significant area that could halt further upward movement.
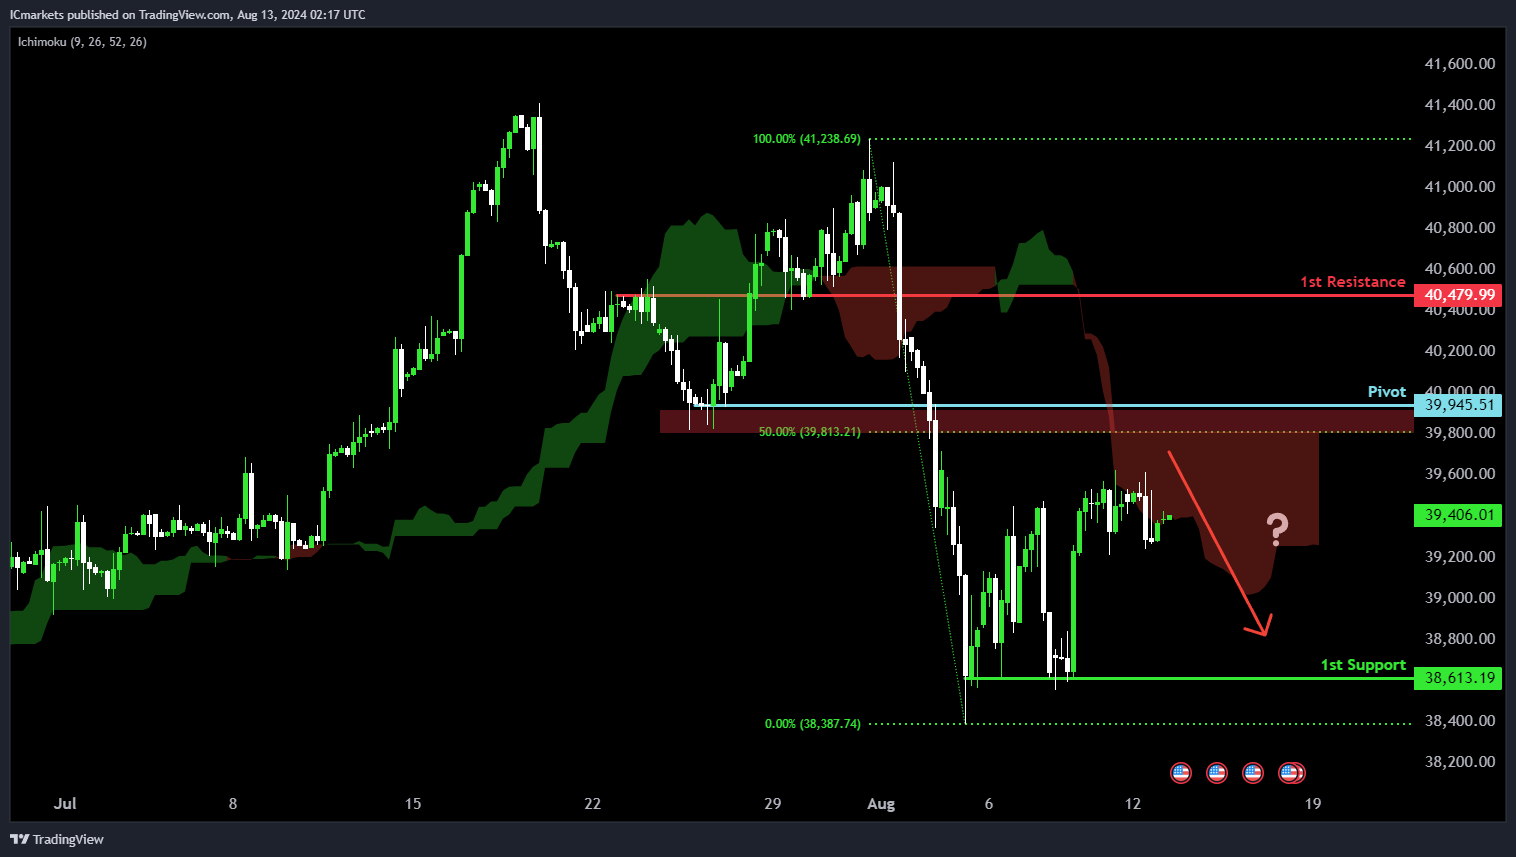
US30 (DJIA):
Potential Direction: Bearish
Overall Momentum of the Chart: Neutral
Price is rising towards the pivot and could potentially make a bearish reversal off this level to fall towards the 1st support.
Pivot: 39,945.51
Supporting reasons: Identified as a pullback resistance that aligns close to a 50% Fibonacci retracement level, indicating a potential area where selling pressures could intensify. The presence of a bearish Ichimoku Cloud adds further significance to the strength of this resistance zone.
1st Support: 38,613.19
Supporting Reasons: Identified as a pullback support, suggesting a significant area where price has recently found support.
1st Resistance: 40,479.99
Supporting Reasons: Identified as an overlap resistance, indicating a significant area that could halt further upward movement.
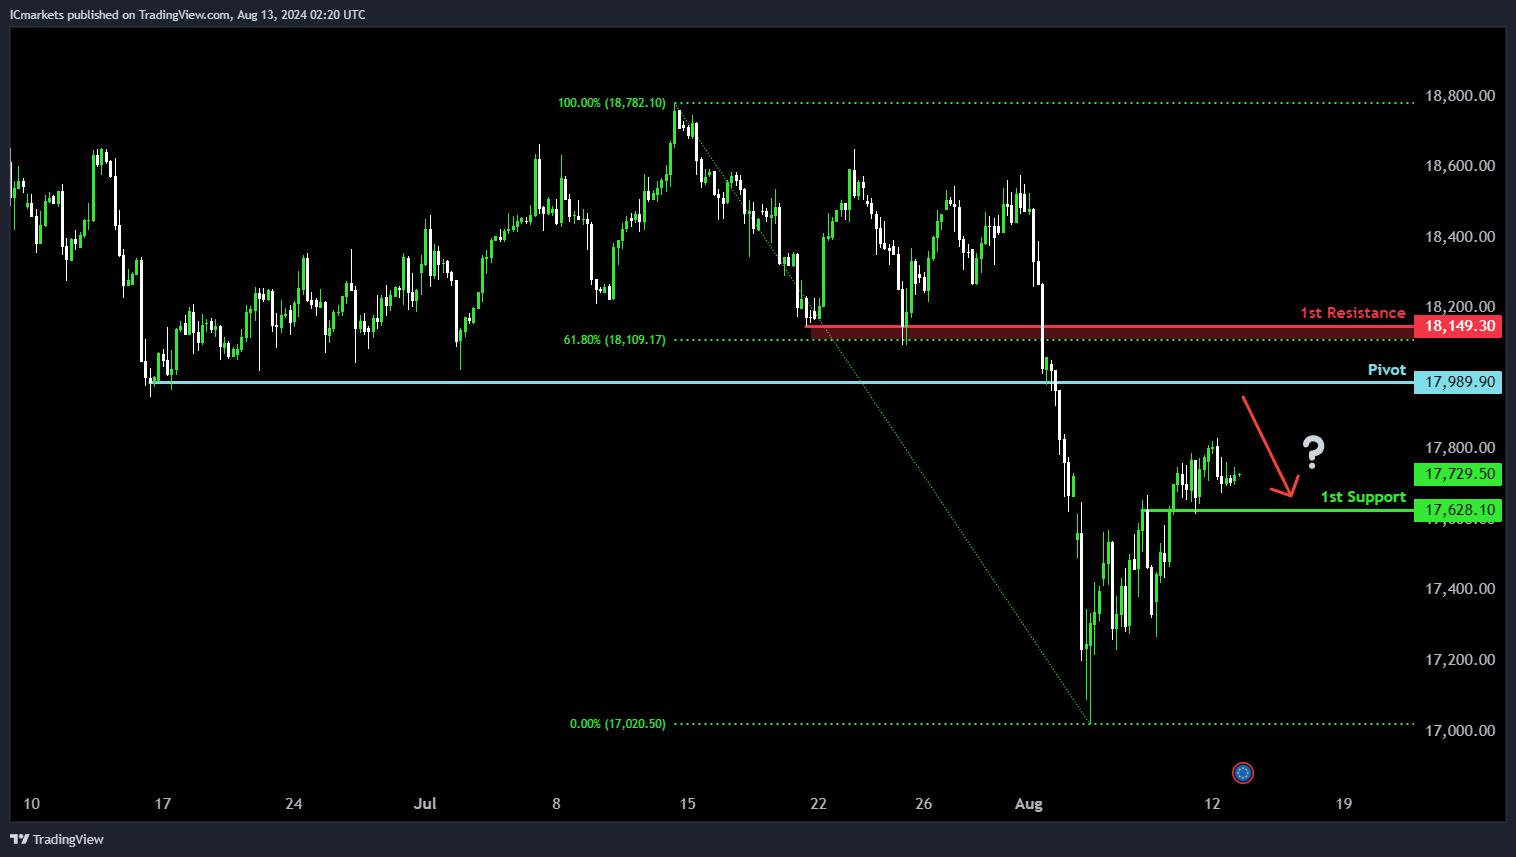
DE40 (DAX):
Potential Direction: Bearish
Overall Momentum of the Chart: Neutral
Price is rising towards the pivot and could potentially make a bearish reversal off this level to fall towards the 1st support.
Pivot: 17,989.90
Supporting reasons: Identified as a pullback resistance, indicating a potential area where selling pressures could intensify.
1st Support: 17,628.10
Supporting Reasons: Identified as an overlap support, indicating a significant area where price has recently found support.
1st Resistance: 18,149.30
Supporting Reasons: Identified as a pullback resistance that aligns close to a 61.8% Fibonacci retracement level, indicating a significant area that could halt further upward movement.
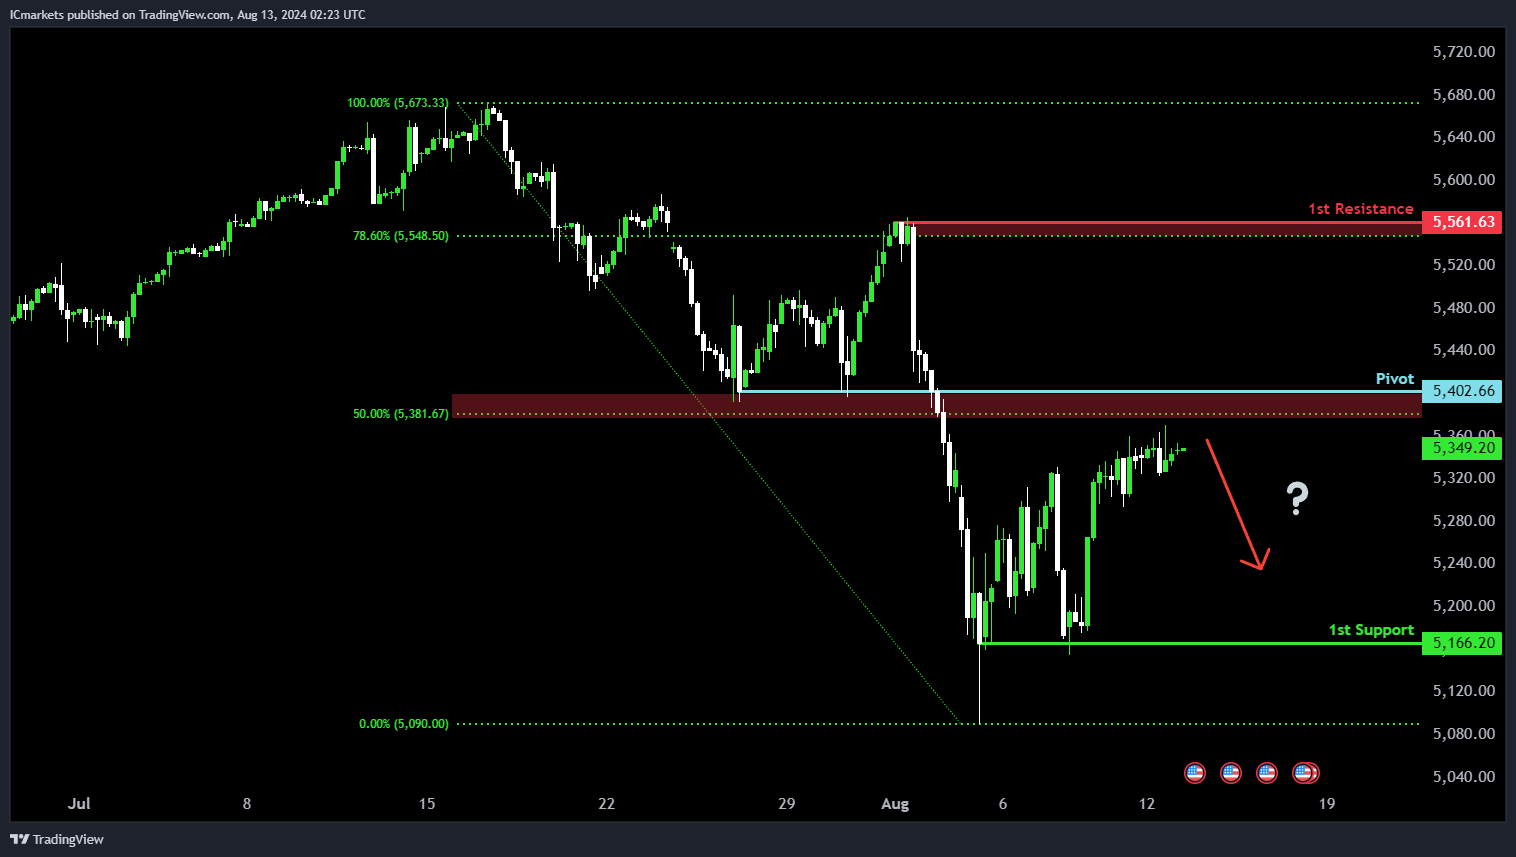
US500 (S&P 500):
Potential Direction: Bearish
Overall Momentum of the Chart: Neutral
Price is rising towards the pivot and could potentially make a bearish reversal off this level to fall towards the 1st support.
Pivot: 5,402.66
Supporting reasons: Identified as a pullback resistance that aligns close to a 50% Fibonacci retracement level, indicating a potential area where selling pressures could intensify.
1st support: 5,166.20
Supporting reasons: Identified as a pullback support, suggesting a significant area where price has recently found support.
1st resistance: 5,561.63
Supporting reasons: Identified as a pullback resistance that aligns close to a 78.6% Fibonacci retracement level, suggesting a critical area that could halt further upward movement.
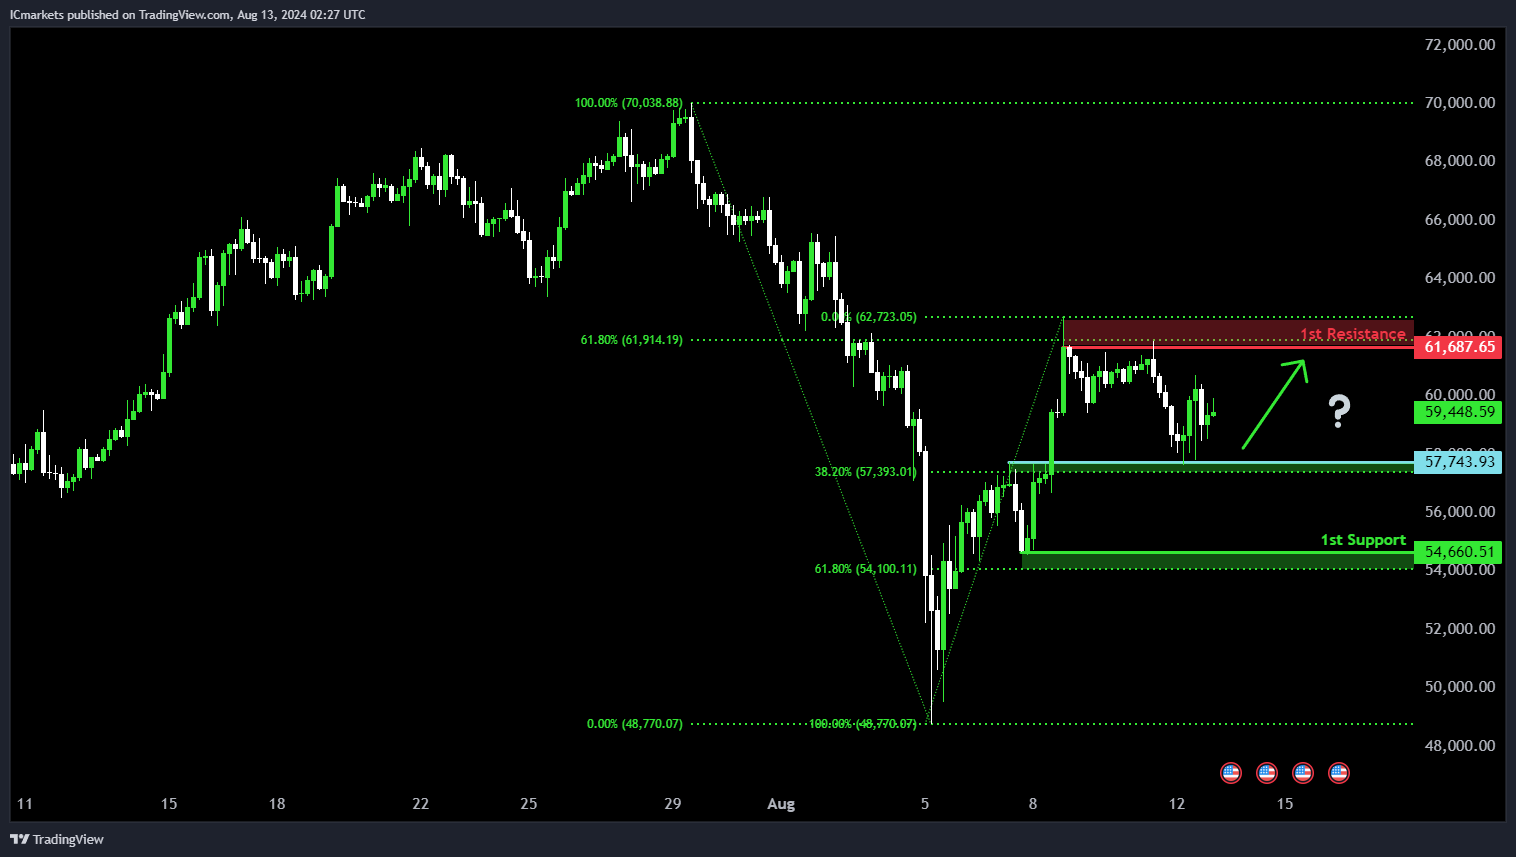
BTC/USD (Bitcoin):
Potential Direction: Bullish
Overall momentum of the chart: Neutral
Price could fall towards the pivot and potentially make a bullish bounce off this level to rise towards the 1st resistance.
Pivot: 57,743.93
Supporting reasons: Identified as an overlap support that aligns with a 38.2% Fibonacci retracement level, indicating a potential area where buying interests could pick up to stage a minor rebound.
1st support: 54,660.51
Supporting reasons: Identified as a pullback support that aligns close to a 61.8% Fibonacci retracement level, indicating a potential area where price could find support.
1st resistance: 61,687.65
Supporting reasons: Identified as an overlap resistance that aligns close to a 61.8% Fibonacci retracement level, indicating a potential barrier that could halt further upward movement.
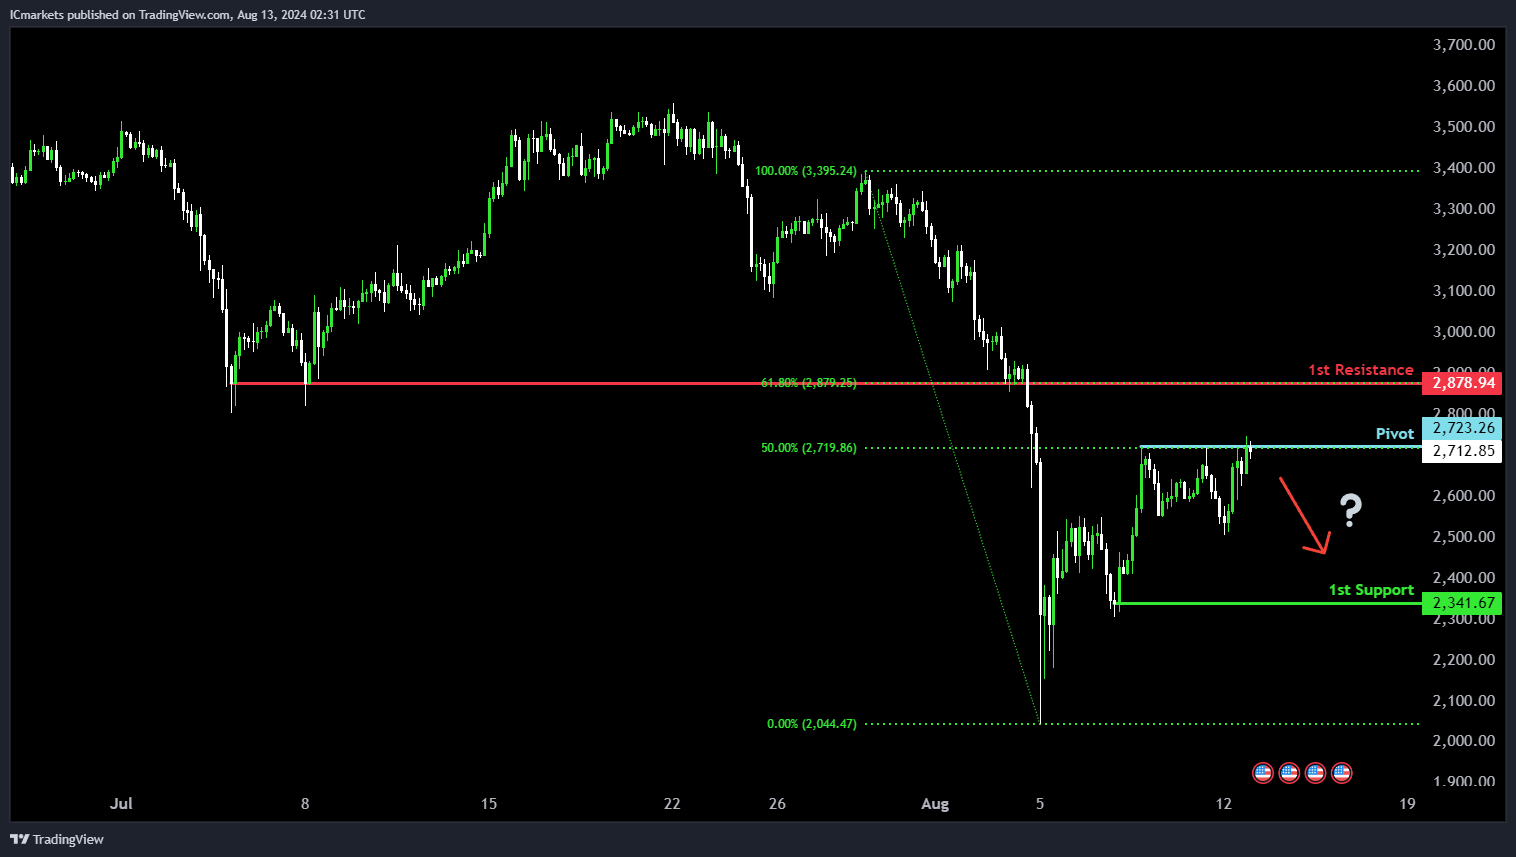
ETH/USD (Ethereum):
Potential Direction: Bearish
Overall momentum of the chart: Neutral
Price is trading close to the pivot and could potentially make a bearish reversal off this level to fall towards the 1st support.
Pivot: 2,723.26
Supporting reasons: Identified as a pullback resistance that aligns with a 50% Fibonacci retracement level, indicating a potential area where selling pressures could intensify.
1st Support: 2,341.67
Supporting Reasons: Identified as a pullback support, indicating a potential area where price could find support.
1st Resistance: 2,878.94
Supporting Reasons: Identified as a pullback resistance that aligns with a 61.8% Fibonacci retracement level, indicating a historical barrier where that could halt further upward movement.
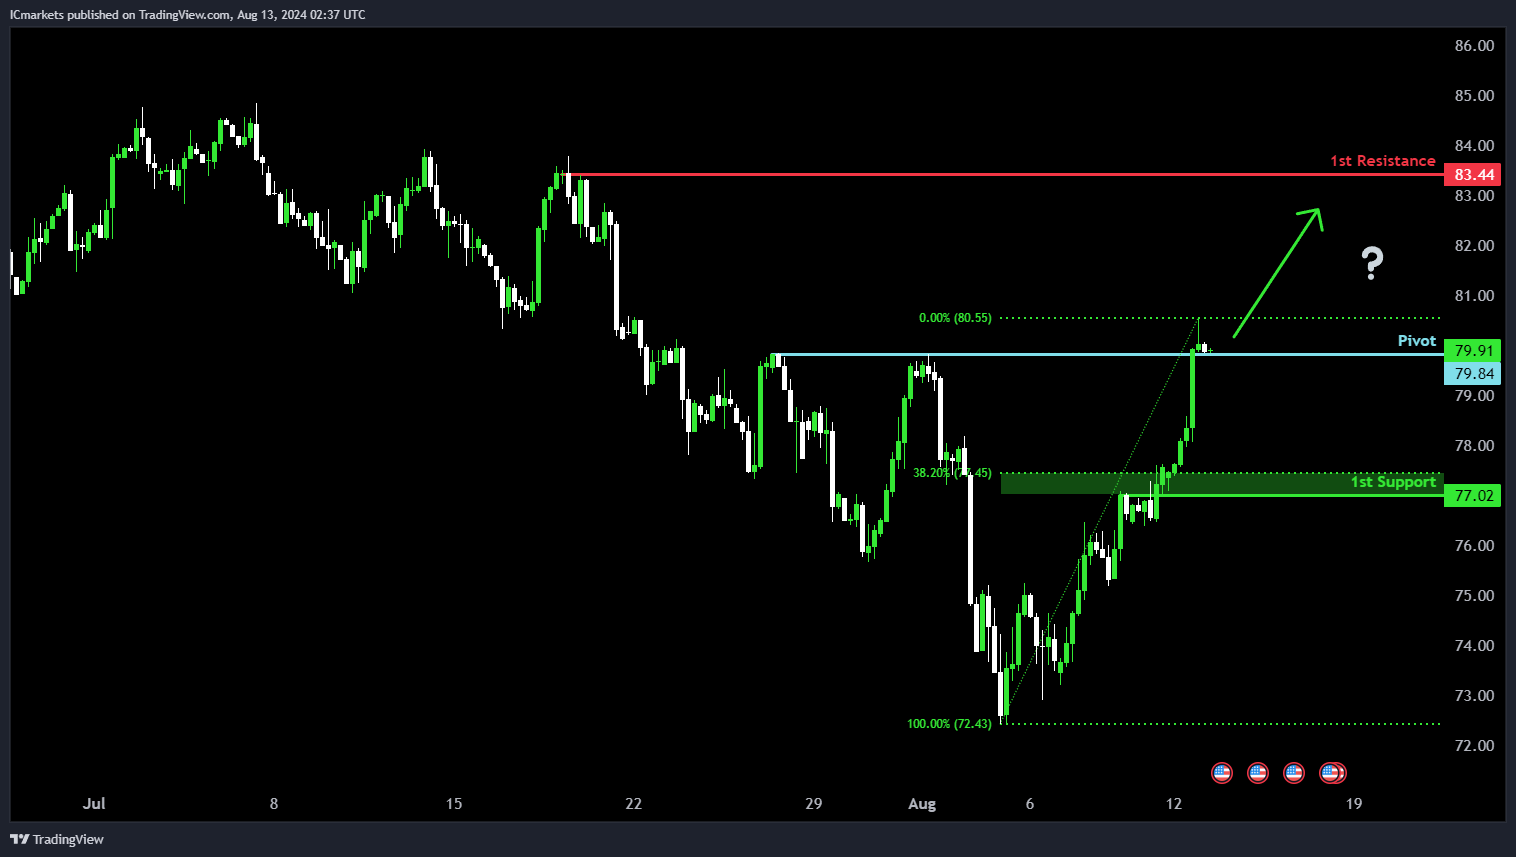
WTI/USD (Oil):
Potential Direction: Bullish
Overall Momentum of the Chart: Bullish
Price is trading close to the pivot and could potentially make a bullish bounce off this level to rise towards the 1st resistance.
Pivot: 79.84
Supporting Reasons: Identified as a pullback support, indicating a potential area where buying interests could pick up to resume the uptrend.
1st Support: 77.02
Supporting Reasons: Identified as a pullback support that algins close to a 38.2% Fibonacci retracement level, indicating a significant area where price could find support.
1st Resistance: 83.44
Supporting Reasons: Identified as a pullback resistance, indicating a potential barrier that could halt further upward movement.
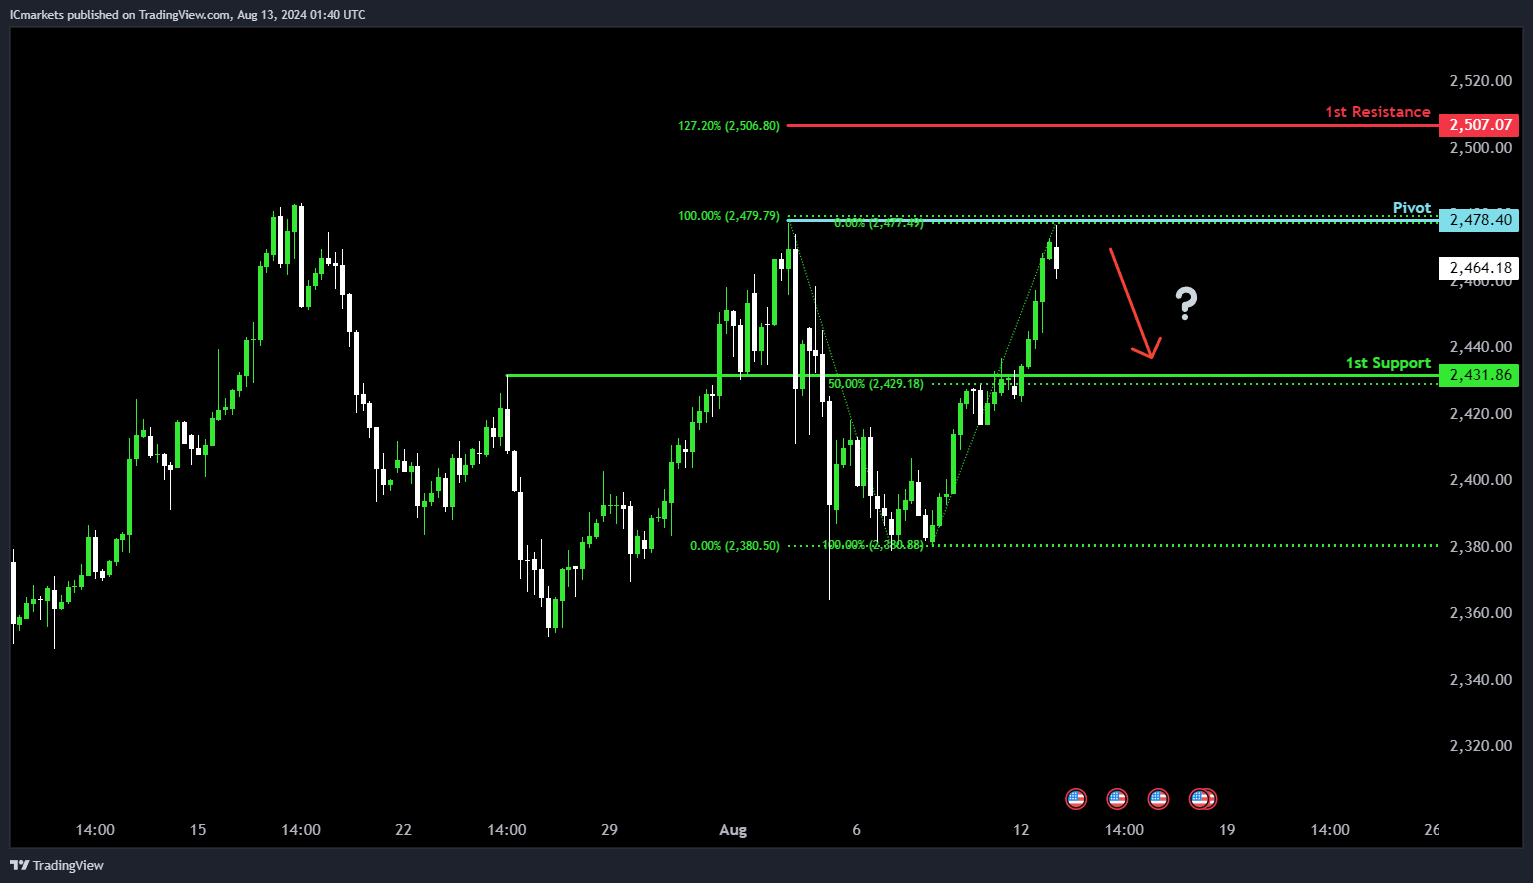
XAU/USD (GOLD):
Potential Direction: Bearish
Overall momentum of the chart: Bearish
Price could potentially make a bearish reaction off the pivot and drop to the 1st support.
Pivot: 2470.40
Supporting reasons: Identified as swing high resistance, indicating a potential area where sellers could enter the market.
1st support: 2431.86
Supporting reasons: Identified as pullback support, reinforced by the 50% Fibonacci retracement, suggesting a significant area where previous declines have found support.
1st resistance: 2507.07
Supporting reasons: Supported by the 127.20% Fibonacci extension, indicating a potential level where previous rallies have faced resistance or reversed.
The accuracy, completeness and timeliness of the information contained on this site cannot be guaranteed. IC Trading does not warranty, guarantee or make any representations, or assume any liability regarding financial results based on the use of the information in the site.
News, views, opinions, recommendations and other information obtained from sources outside of www.ictrading.com, used in this site are believed to be reliable, but we cannot guarantee their accuracy or completeness. All such information is subject to change at any time without notice. IC Trading assumes no responsibility for the content of any linked site.
The fact that such links may exist does not indicate approval or endorsement of any material contained on any linked site. IC Trading is not liable for any harm caused by the transmission, through accessing the services or information on this site, of a computer virus, or other computer code or programming device that might be used to access, delete, damage, disable, disrupt or otherwise impede in any manner, the operation of the site or of any user’s software, hardware, data or property.