
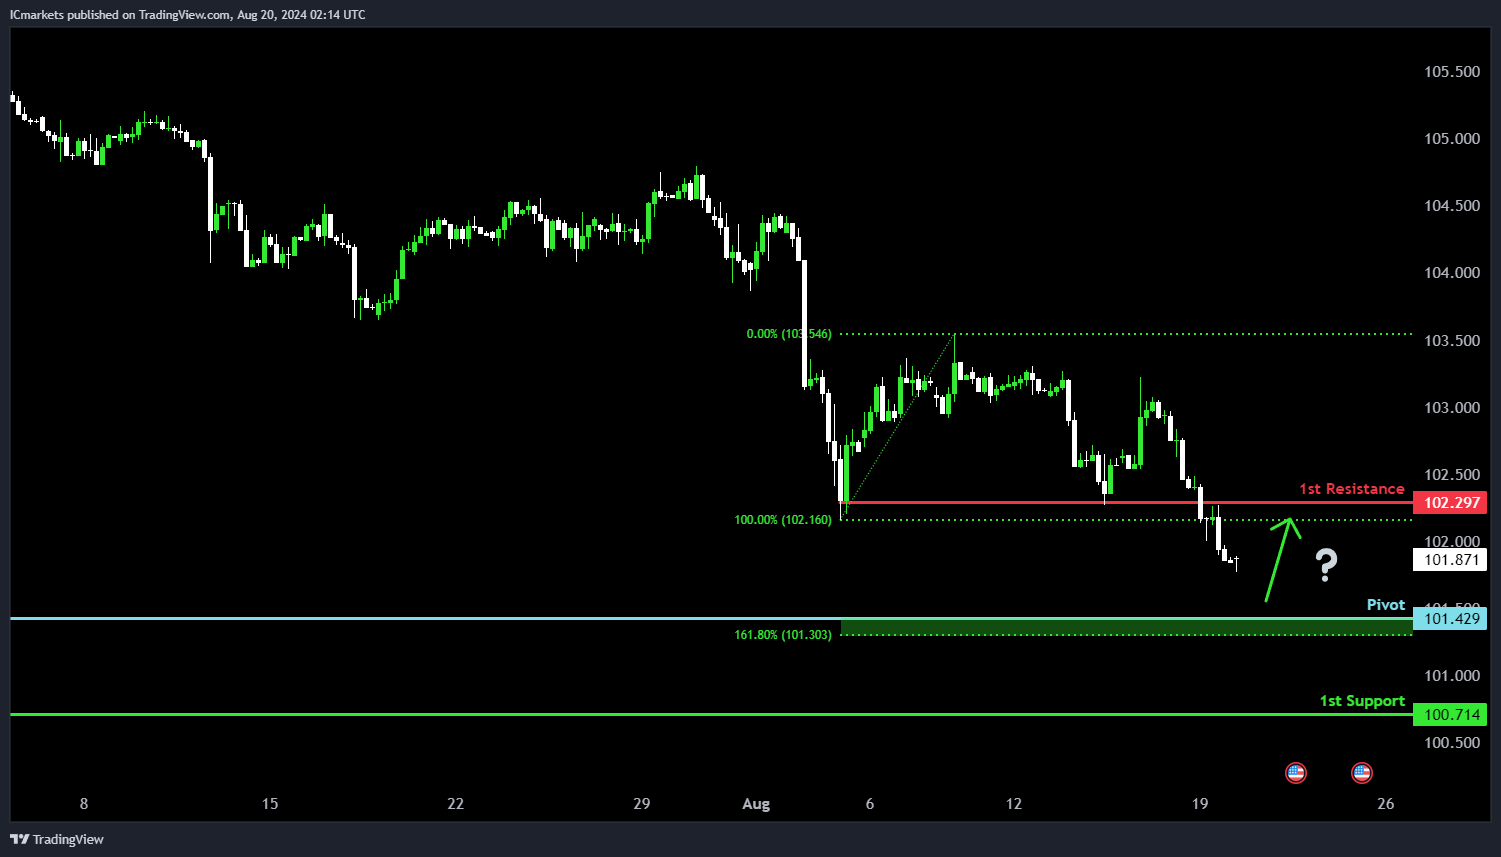
DXY (US Dollar Index):
Potential Direction: Bullish
Overall momentum of the chart: Bearish
Price could potentially make a bullish bounce off the pivot and head towards the 1st resistance.
Pivot: 101.42
Supporting reasons: Identified as an overlap support that aligns close to a 161.8% Fibonacci extension level, indicating a potential area where buying interests could pick up to stage a minor rebound.
1st support: 100.71
Supporting reasons: Identified as swing-low support, suggesting a significant area where previous declines have been halted.
1st resistance: 102.29
Supporting reasons: Identified as an overlap resistance, indicating a level that could halt any upward movement.
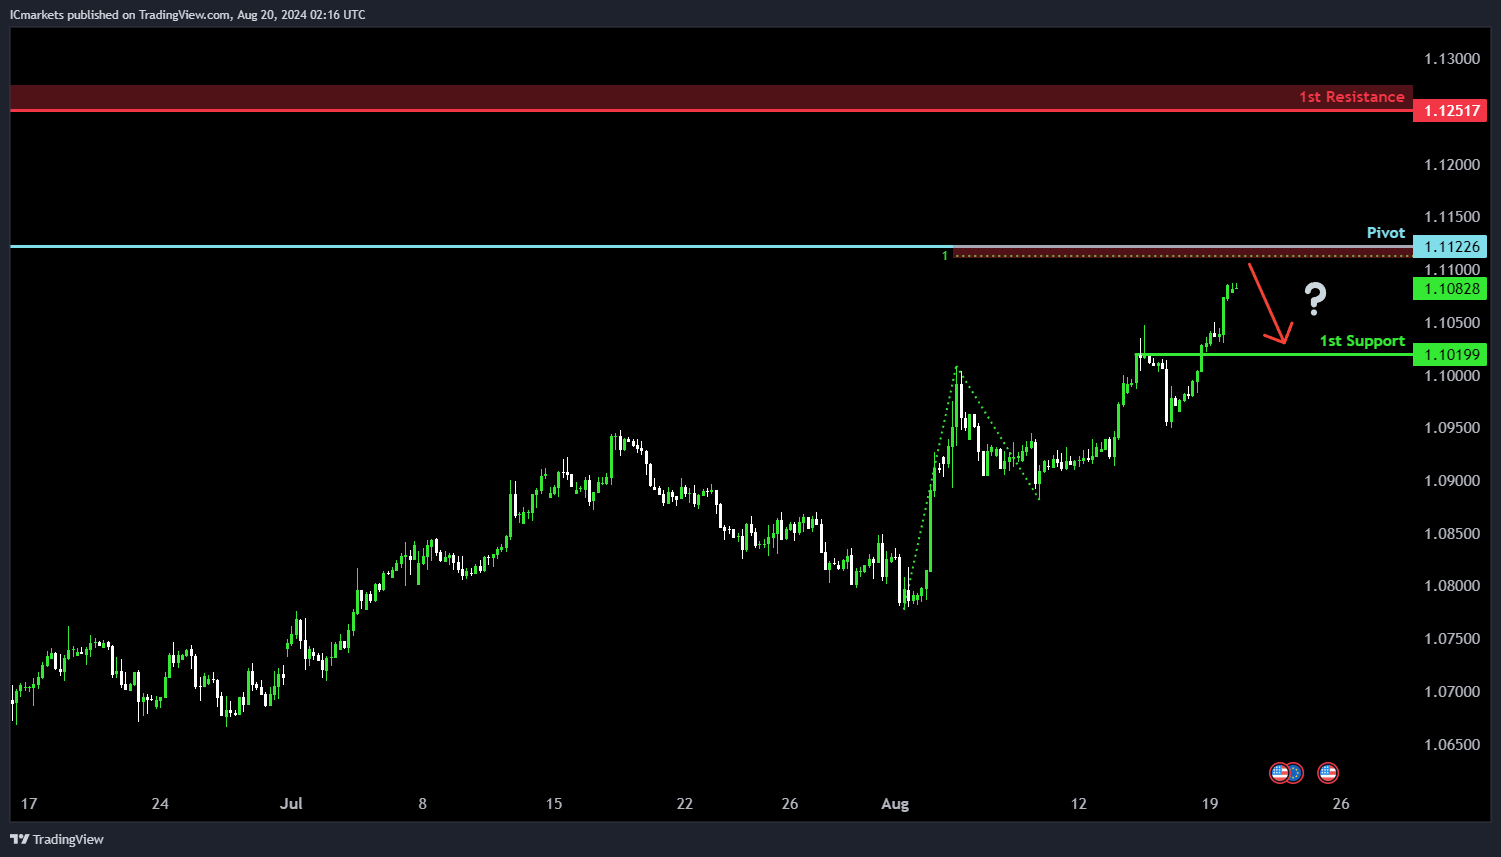
EUR/USD:
Potential Direction: Bearish
Overall momentum of the chart: Bullish
Price could potentially make a bearish reaction off the pivot and drop to the 1st support.
Pivot: 1.1122
Supporting reasons: Identified as a swing-high resistance that aligns close to a 100% Fibonacci projection level, suggesting a significant level where selling pressures could intensify.
1st support: 1.1019
Supporting reasons: Identified as a pullback support, indicating a potential area where price could find support.
1st resistance: 1.1251
Supporting reasons: Identified as a swing-high resistance, representing a level where previous bullish advances have faced selling pressure, making it a key level to watch if the price continues to rise.
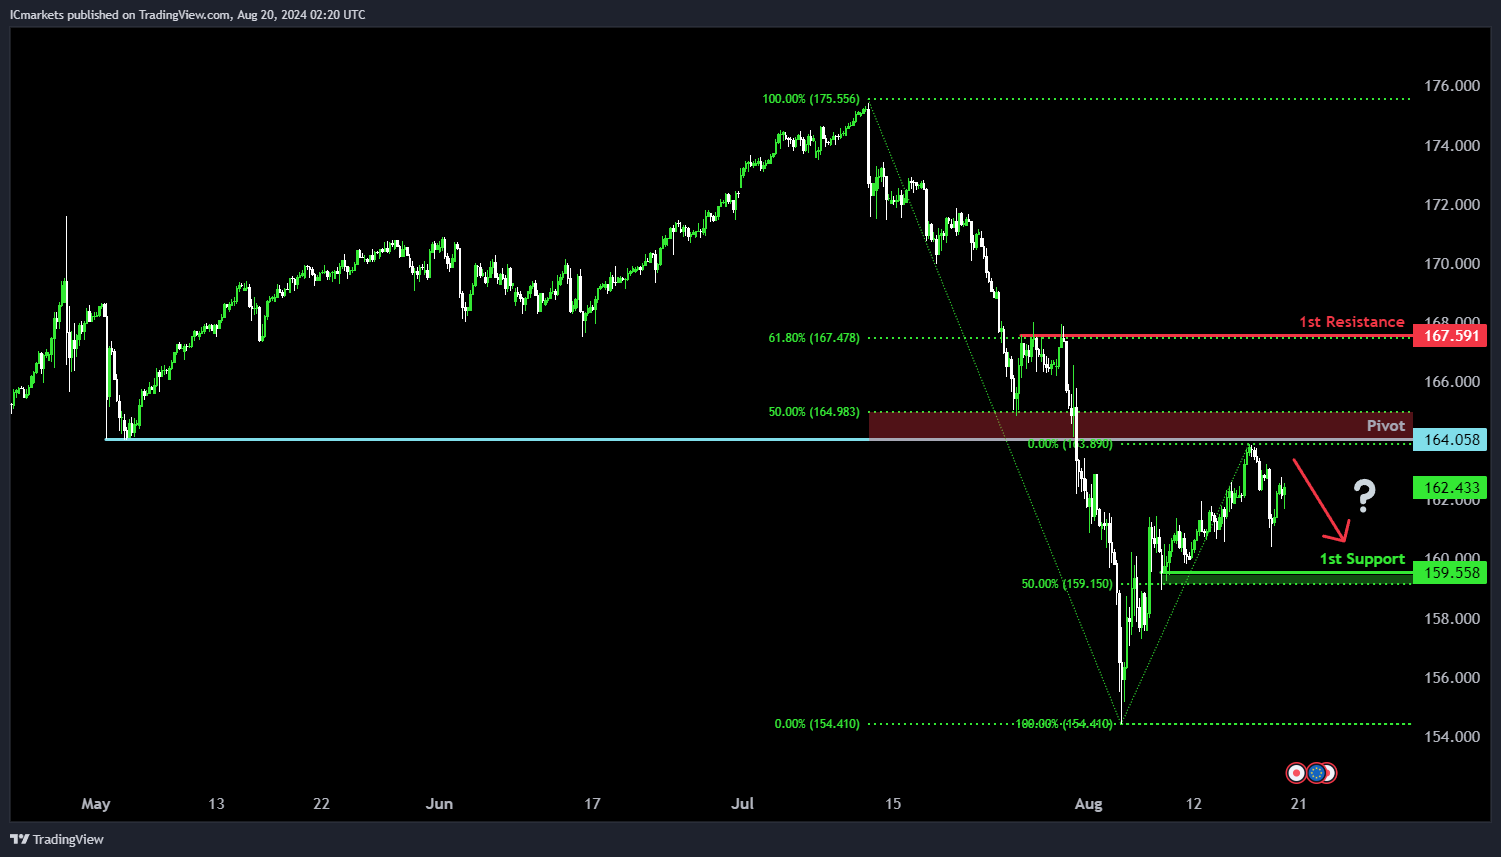
EUR/JPY:
Potential Direction: Bearish
Overall momentum of the chart: Neutral
Price could potentially make a bearish reaction off the pivot and drop to the 1st support.
Pivot: 164.05
Supporting reasons: Identified as an overlap resistance that aligns close to a 50% Fibonacci retracement level, indicating a significant area where selling pressures could intensify.
1st support: 159.55
Supporting reasons: Identified as a pullback support that aligns close to a 50% Fibonacci retracement level, marking an area where previous declines have stabilized.
1st resistance: 167.59
Supporting reasons: Identified as pullback resistance that aligns close to 61.8% Fibonacci retracement level, suggesting a significant level where bullish attempts may face selling pressure.
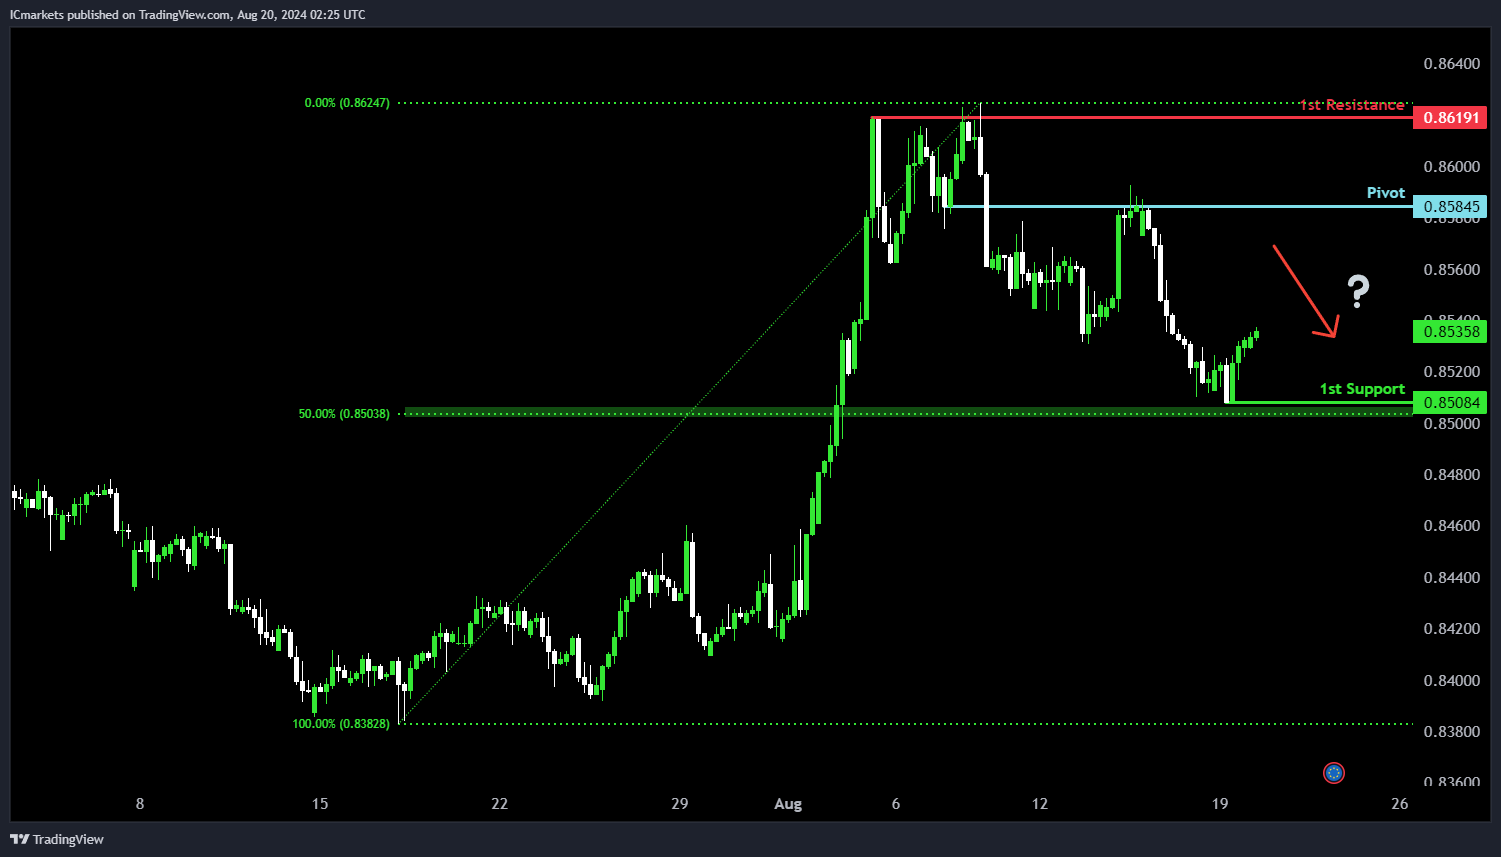
EUR/GBP:
Potential Direction: Bearish
Overall momentum of the chart: Neutral
Price could potentially make a bearish reaction off the pivot and drop to the 1st support.
Pivot: 0.8584
Supporting reasons: Identified as an overlap resistance, suggesting a potential area where selling pressures could intensify.
1st support: 0.8508
Supporting reasons: Identified as pullback support that aligns close to a 50% Fibonacci retracement level, indicating a key level where the price could find strong support.
1st resistance: 0.8619
Supporting reasons: Identified as a pullback resistance, marking a significant area where bullish movements may encounter selling pressure.
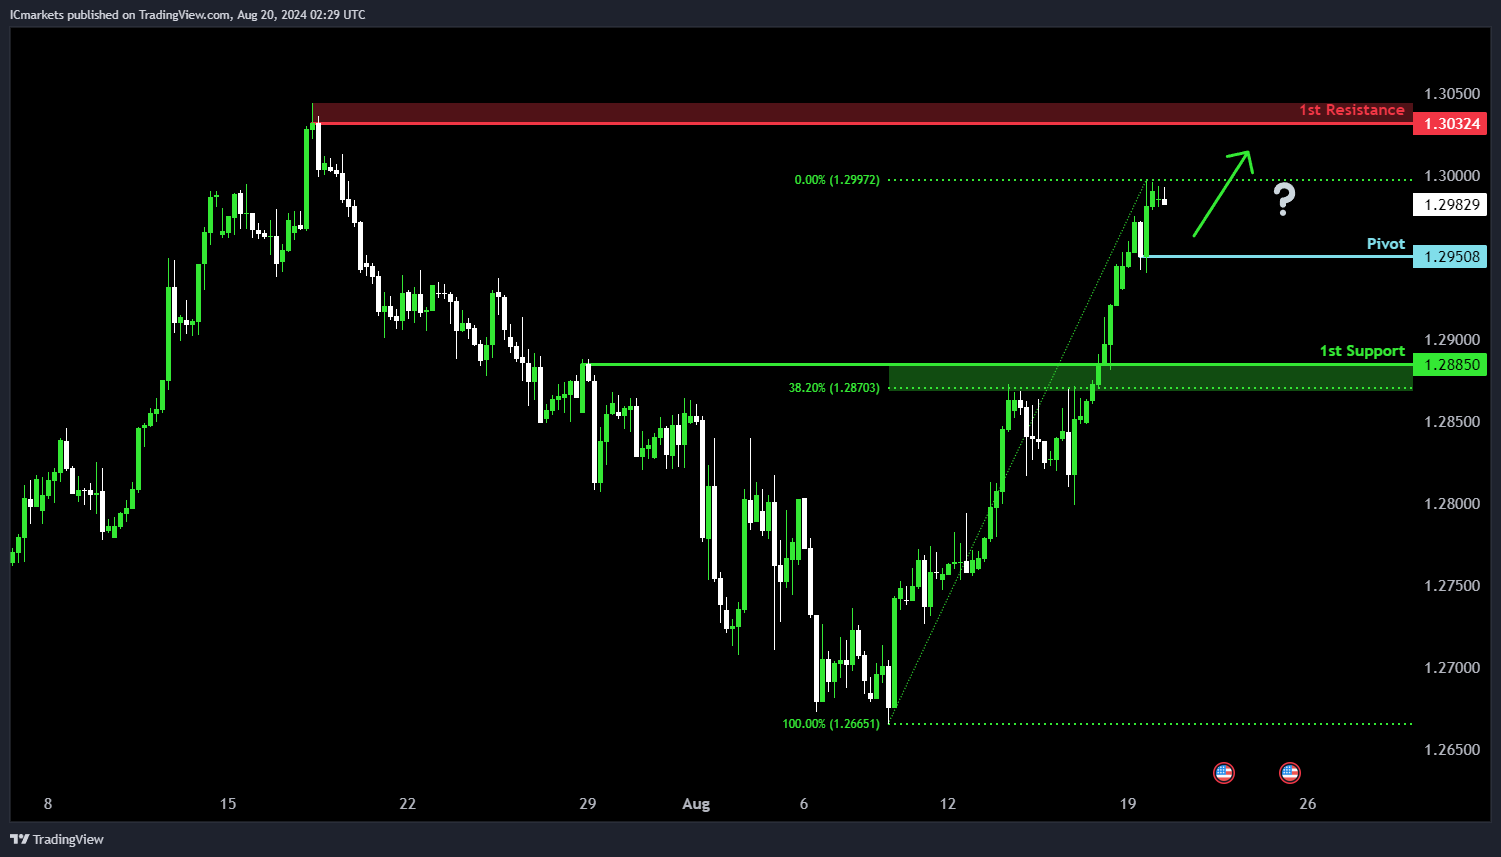
GBP/USD:
Potential Direction: Bullish
Overall momentum of the chart: Bullish
Price could potentially make a bullish reaction off the pivot and rise to the 1st resistance.
Pivot: 1.2950
Supporting reasons: Identified as pullback support, suggesting a potential area where buying interests could pick up to resume the uptrend.
1st support: 1.2885
Supporting reasons: Identified as pullback support that aligns close to a 38.2% Fibonacci retracement level, indicating a significant area where price may find support after a decline.
1st resistance: 1.3032
Supporting reasons: Identified as a swing-high resistance, marking a level where bullish movements may encounter selling pressure.
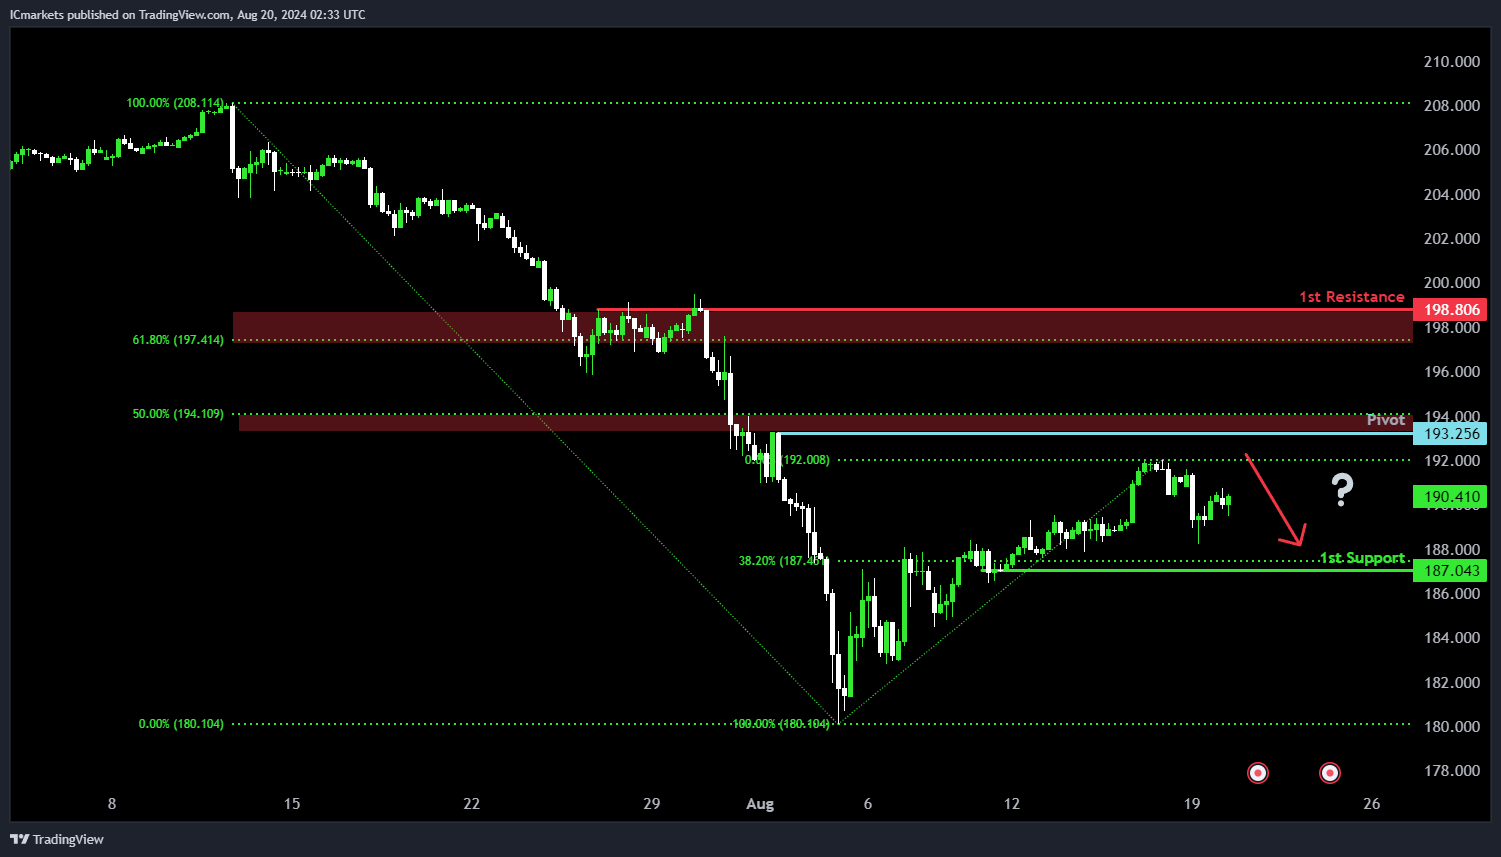
GBP/JPY:
Potential Direction: Bearish
Overall momentum of the chart: Neutral
Price could potentially make a bearish reversal off the pivot and drop towards the 1st support.
Pivot: 193.25
Supporting reasons: Identified as a pullback resistance that aligns close to a 50% Fibonacci retracement level, indicating a potential level where the price might face selling pressure.
1st support: 187.04
Supporting reasons: Identified as a pullback support that aligns close to a 38.2% Fibonacci retracement level, marking a significant area where previous declines have found support.
1st resistance: 198.80
Supporting reasons: Identified as pullback resistance that aligns close to a 61.80% Fibonacci retracement level, suggesting a potential reversal point where bullish attempts may falter.
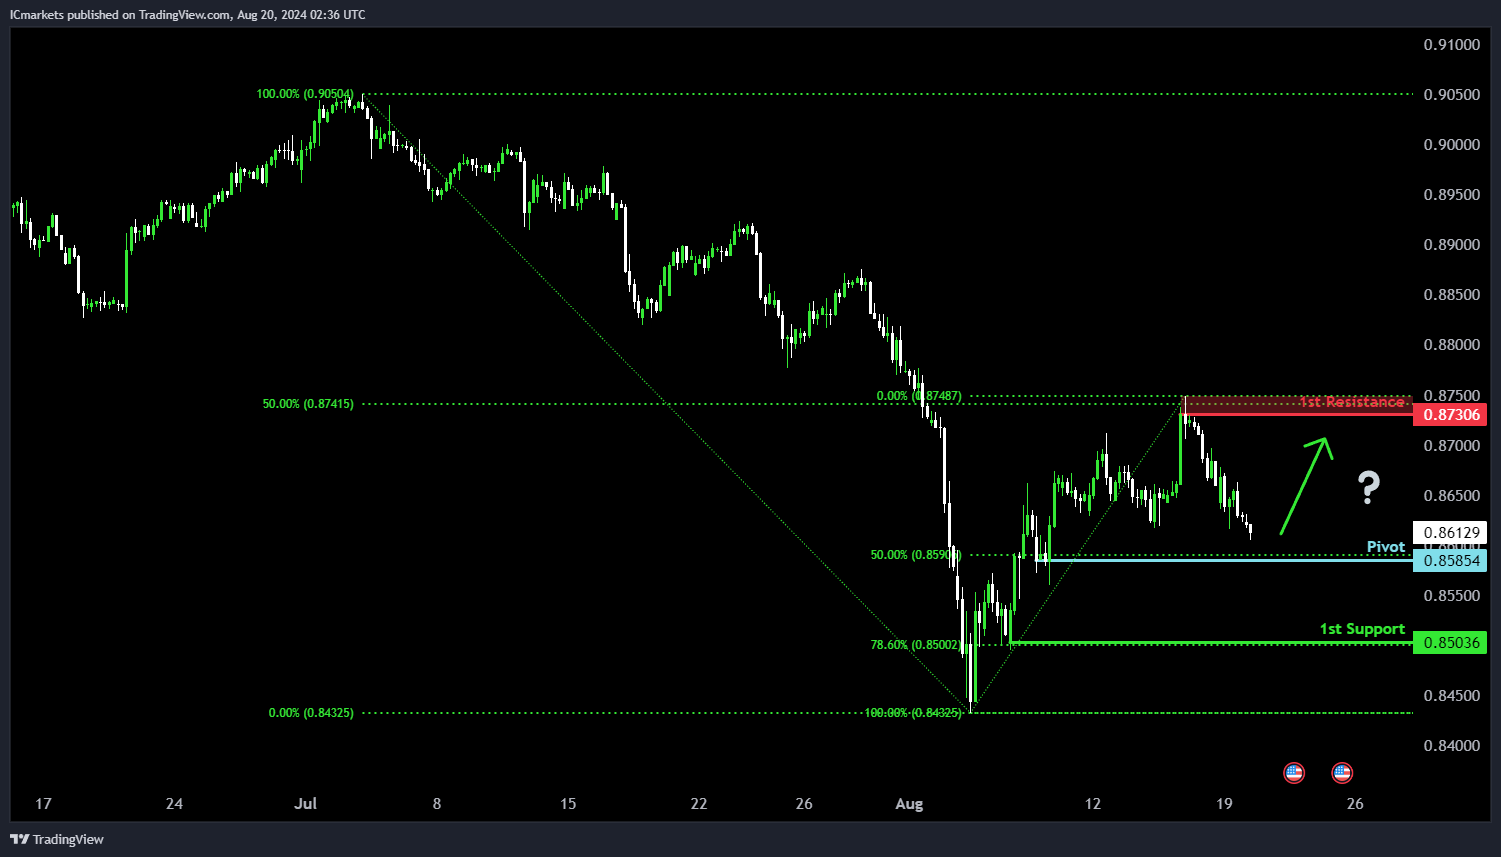
USD/CHF:
Potential Direction: Bullish
Overall momentum of the chart: Neutral
Price could potentially make a bullish bounce off the pivot and rise towards the 1st resistance.
Pivot: 0.8585
Supporting reasons: Identified as a pullback support that aligns with a 50% Fibonacci retracement level, indicating a potential level where buying interests could pick up.
1st support: 0.8503
Supporting reasons: Identified as a pullback support that aligns with a 78.6% Fibonacci retracement level, marking a significant area where previous declines have found support.
1st resistance: 0.8730
Supporting reasons: Identified as a pullback resistance that aligns close to a 50% Fibonacci retracement level, suggesting a potential reversal point where bullish attempts may struggle.
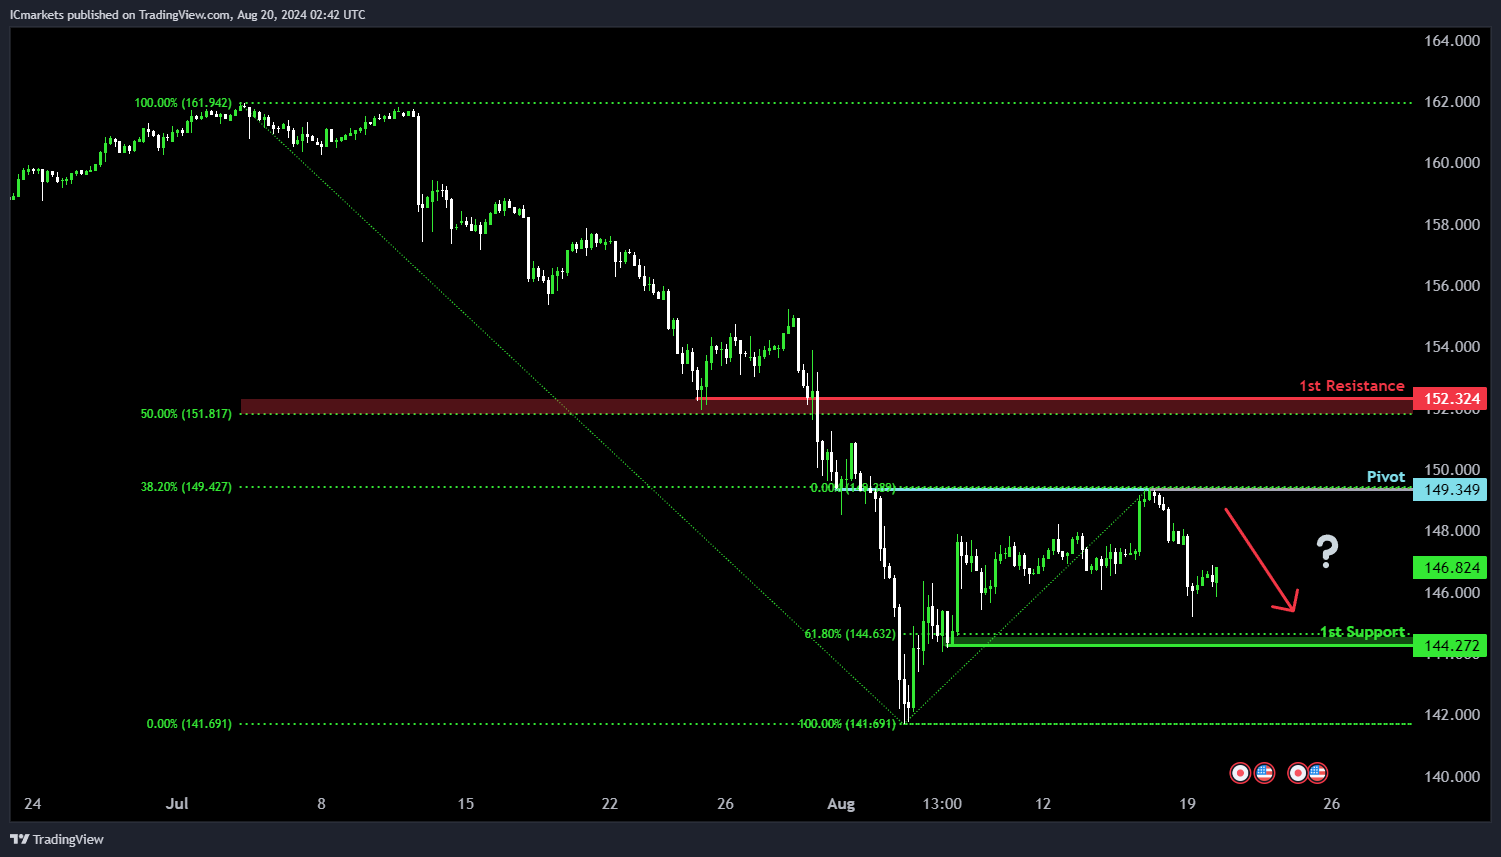
USD/JPY:
Potential Direction: Bearish
Overall momentum of the chart: Neutral
Price could potentially make a bearish reaction off the pivot and drop to the 1st support.
Pivot: 149.34
Supporting reasons: Identified as an overlap resistance that aligns with a 38.2% Fibonacci retracement level, indicating a potential level where selling pressures could intensify.
1st support: 144.27
Supporting reasons: Identified as a pullback support that aligns close to a 61.8% Fibonacci retracement level, suggesting a significant area where previous price declines have found buying interest.
1st resistance: 152.32
Supporting reasons: Identified as a pullback resistance that aligns close to a 50% Fibonacci retracement level, marking a potential area where bullish attempts might face selling pressure.
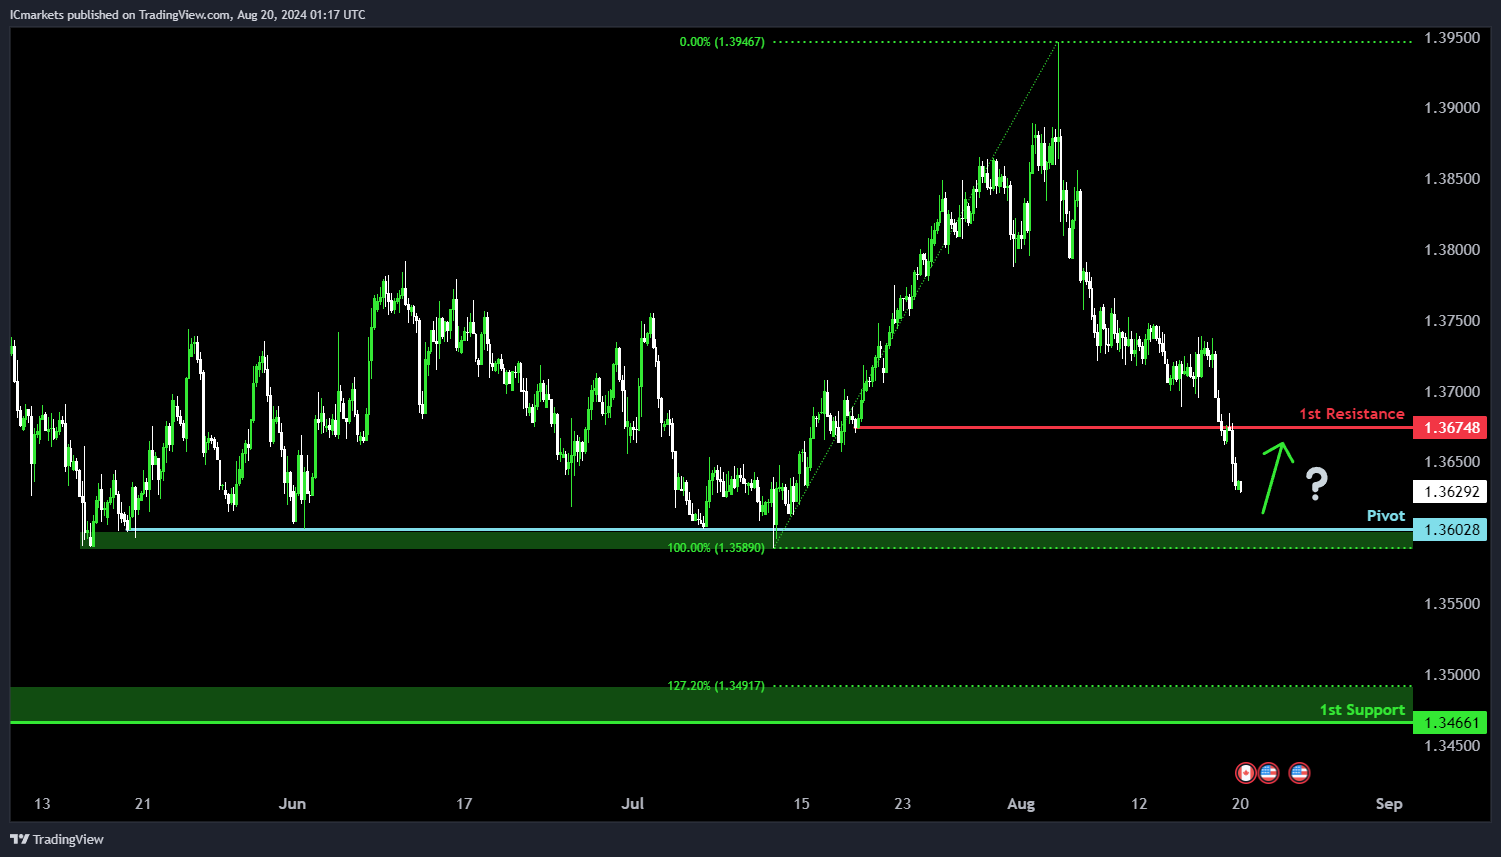
USD/CAD:
Potential Direction: Bullish
Overall momentum of the chart: Bearish
Price is falling towards the pivot and could potentially make a bullish bounce off this level to rise towards the 1st resistance.
Pivot: 1.3602
Supporting reasons: Identified as a pullback support, indicating a potential area where buying interests could pick up to stage a minor rebound.
1st support: 1.3466
Supporting reasons: Identified as a pullback support that aligns close to a 127.2% Fibonacci extension level, indicating a potential area where price could find strong support.
1st resistance: 1.3674
Supporting reasons: Identified as an overlap resistance, indicating a potential area that could halt any further upward movement.
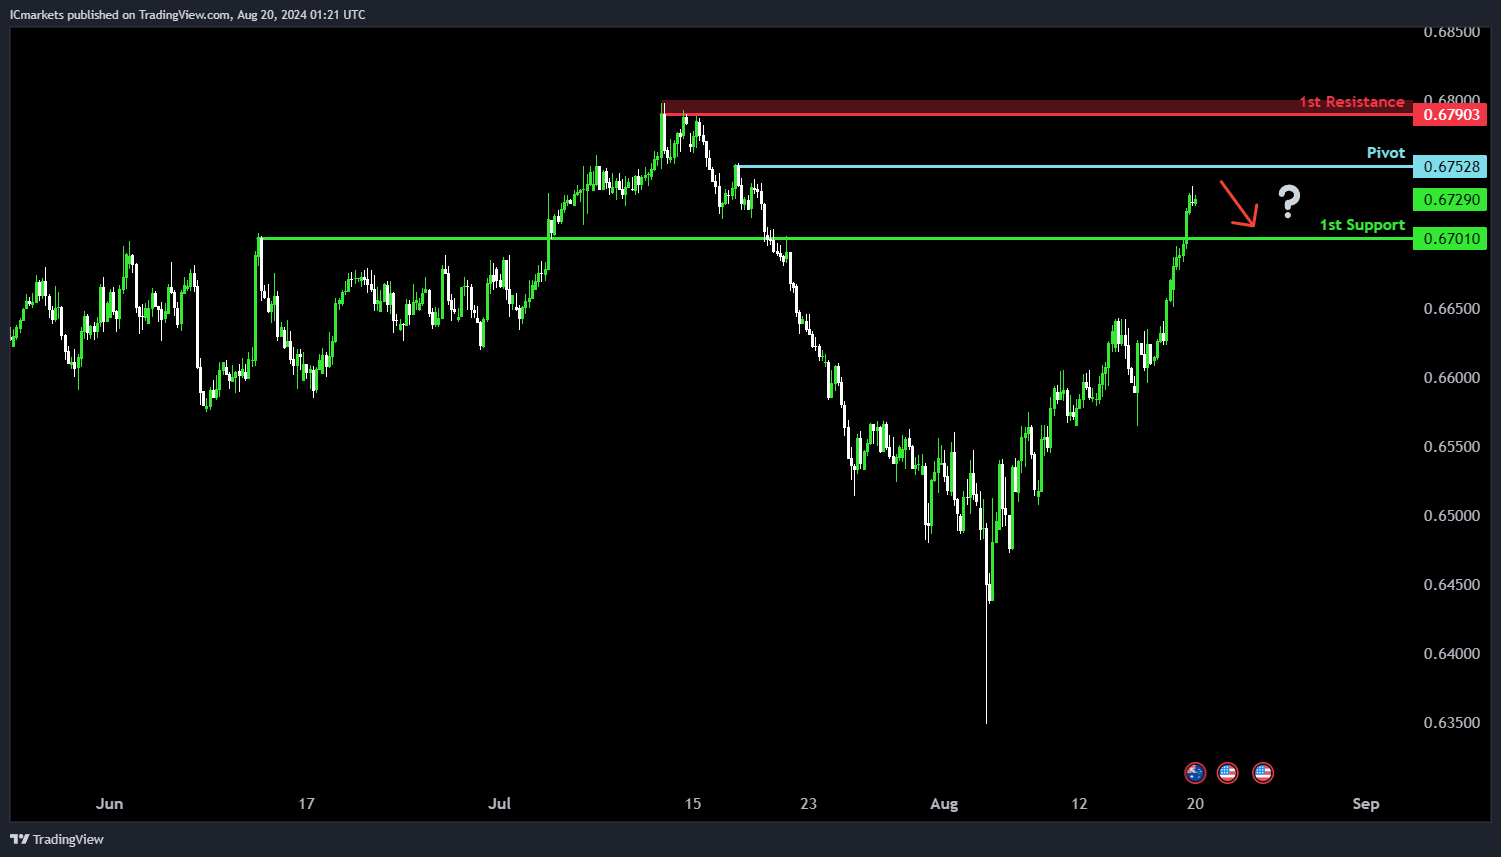
AUD/USD:
Potential Direction: Bearish
Overall momentum of the chart: Bullish
Price is rising towards the pivot and could potentially make a bearish reversal off this level to pull back towards the 1st support.
Pivot: 0.6752
Supporting reasons: Identified as a pullback resistance, indicating a potential area where selling pressures could intensify.
1st support: 0.6701
Supporting reasons: Identified as an overlap support, suggesting a potential area where price could find support.
1st resistance: 0.6790
Supporting reasons: Identified as a swing-high resistance, indicating a significant area that could halt further upward movement.
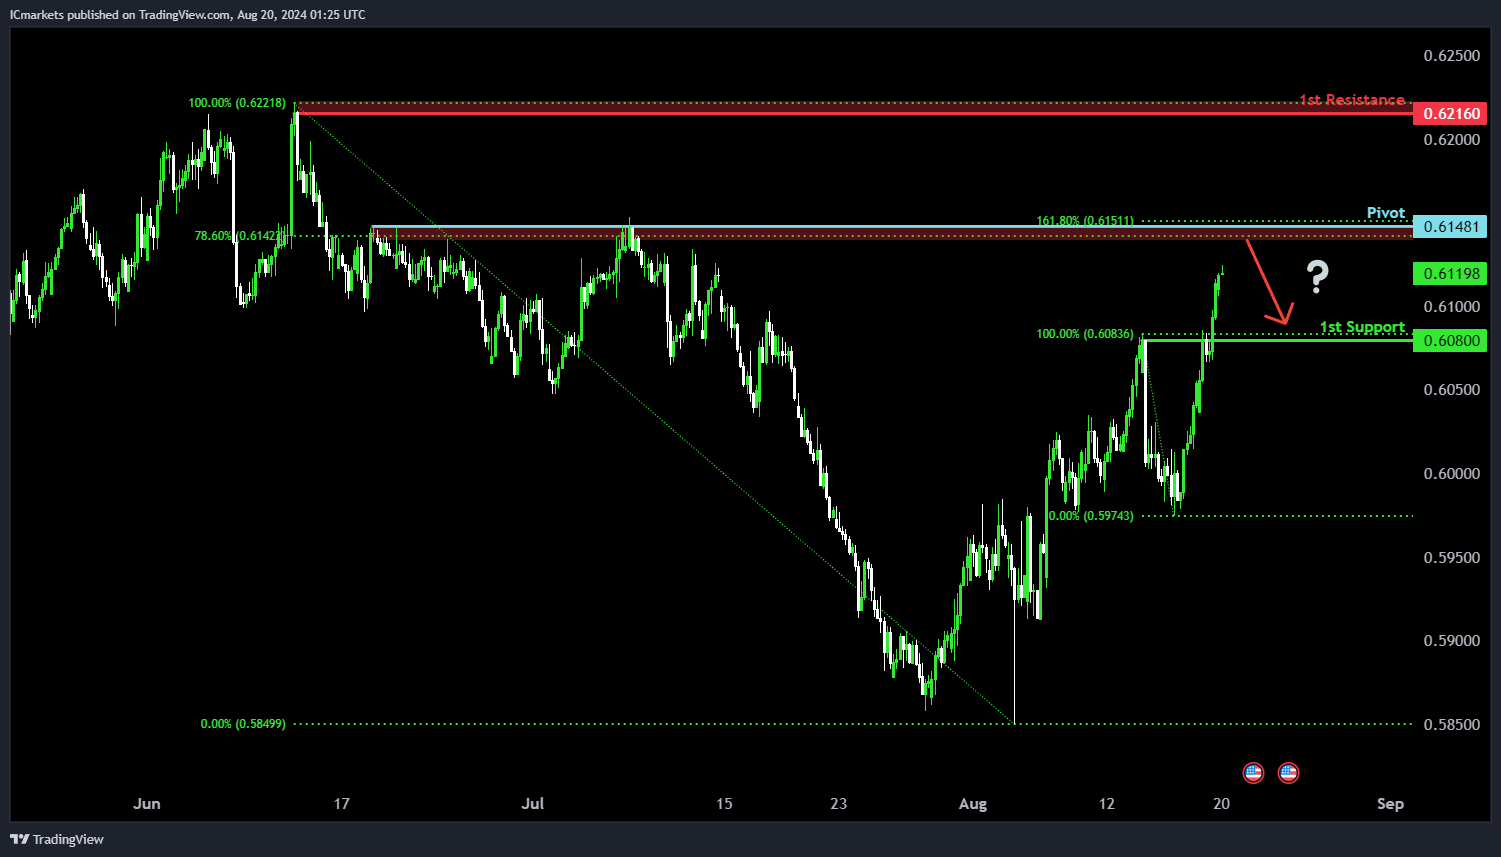
NZD/USD
Potential Direction: Bearish
Overall momentum of the chart: Bullish
Price is rising towards the pivot and could potentially make a bearish reversal off this level to pull back towards the 1st support.
Pivot: 0.6148
Supporting reasons: Identified as a pullback resistance that aligns with a confluence of Fibonacci levels i.e. the 78.6% retracement and the 161.8% extension levels, indicating a potential area where selling pressures could intensify.
1st support: 0.6080
Supporting reasons: Identified as a pullback support, suggesting a potential area where price could find strong support.
1st resistance: 0.6216
Supporting reasons: Identified as a swing-high resistance, indicating a significant area that could halt further upward movement.
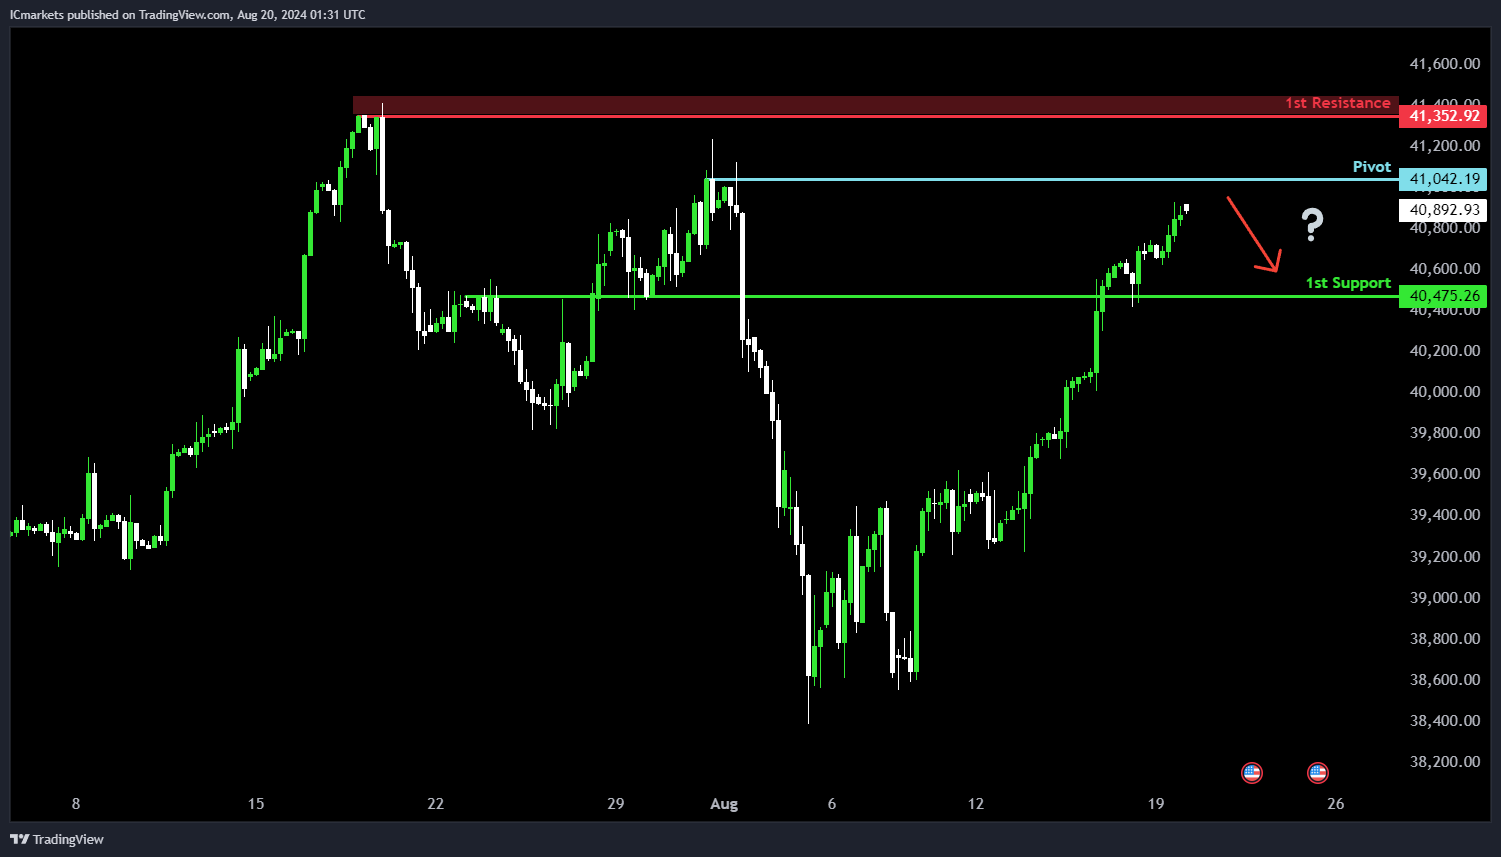
US30 (DJIA):
Potential Direction: Bearish
Overall Momentum of the Chart: Bullish
Price is rising towards the pivot and could potentially make a bearish reversal off this level to pull back towards the 1st support.
Pivot: 41,042.19
Supporting reasons: Identified as a pullback resistance, suggesting a potential area where selling pressures could intensify.
1st Support: 40,475.26
Supporting Reasons: Identified as an overlap support, suggesting a potential area where price could find support.
1st Resistance: 41,352.92
Supporting Reasons: Identified as a swing-high resistance that aligns close to the all-time high, indicating a significant area that could halt further upward movement.
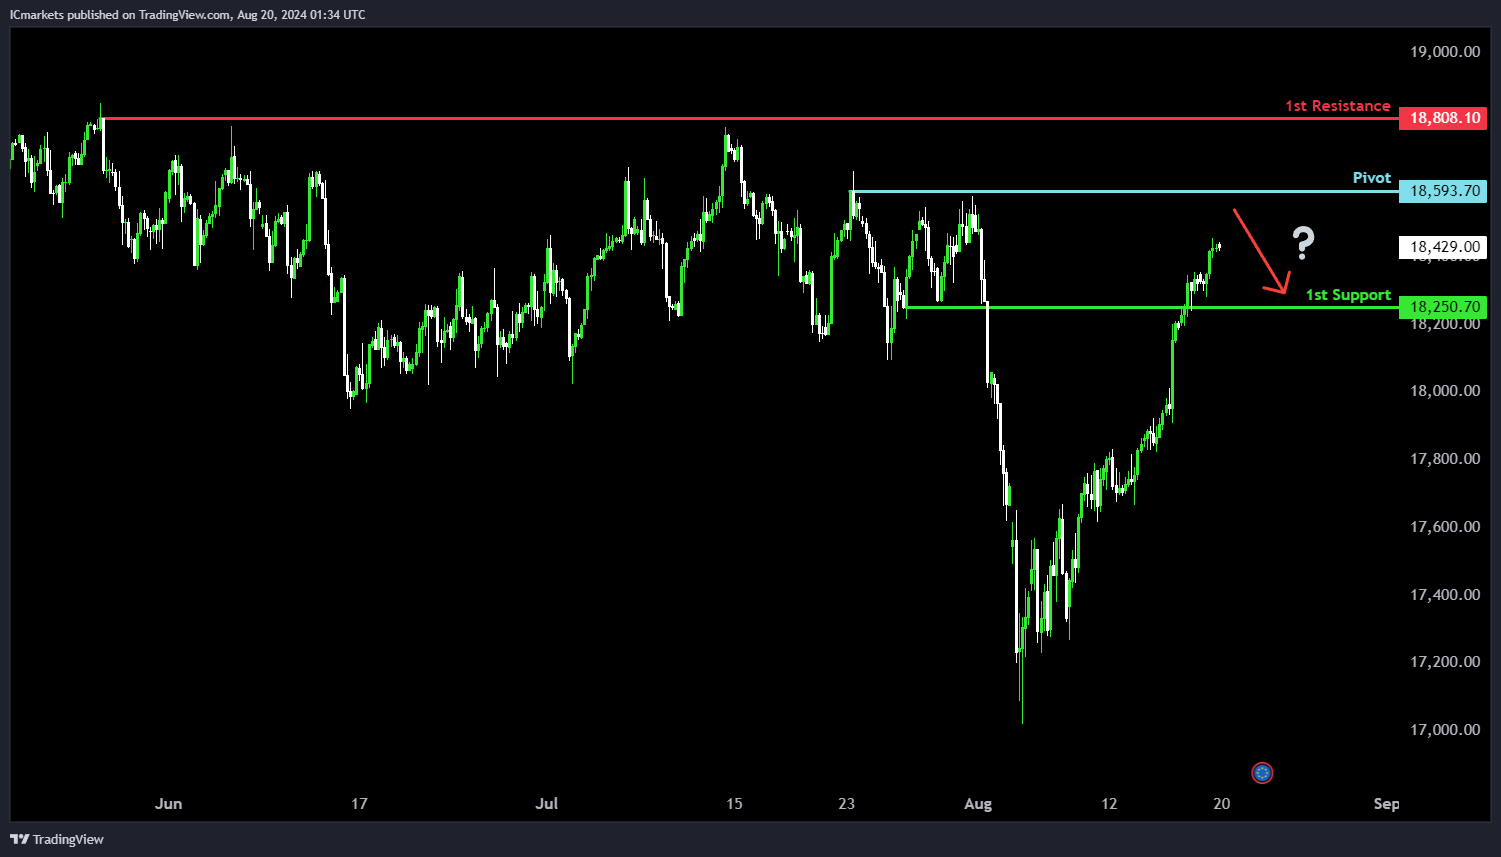
DE40 (DAX):
Potential Direction: Bearish
Overall Momentum of the Chart: Bullish
Price is rising towards the pivot and could potentially make a bearish reversal off this level to pull back towards the 1st support.
Pivot: 18,593.70
Supporting reasons: Identified as a pullback resistance, suggesting a potential area where selling pressures could intensify.
1st Support: 18,250.70
Supporting Reasons: Identified as a pullback support, indicating a potential area where price could find support.
1st Resistance: 18,808.10
Supporting Reasons: Identified as a pullback resistance, indicating a significant area that could halt further upward movement.
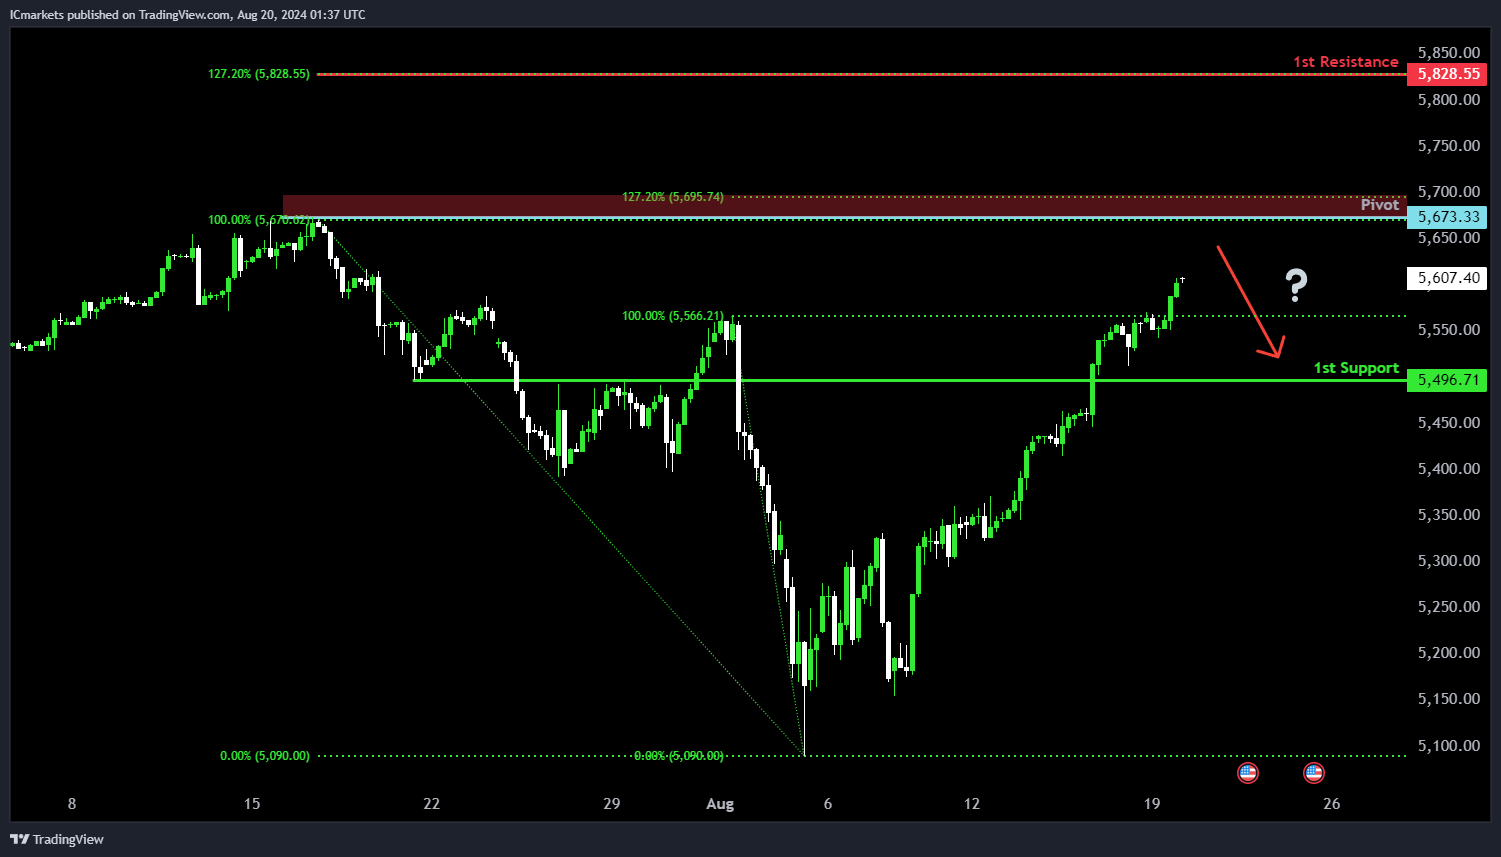
US500 (S&P 500):
Potential Direction: Bearish
Overall Momentum of the Chart: Bullish
Price is rising towards the pivot and could potentially make a bearish reversal off this level to pull back towards the 1st support.
Pivot: 5,673.33
Supporting reasons: Identified as a swing-high resistance that aligns close to a 127.2% Fibonacci extension level, suggesting a potential area where selling pressures could intensify.
1st support: 5,496.71
Supporting reasons: Identified as an overlap support, suggesting a potential area where price could find support.
1st resistance: 5,828.55
Supporting reasons: Identified as a resistance that aligns with a 127.2% extension Fibonacci level, suggesting a critical area that could halt further upward movement.
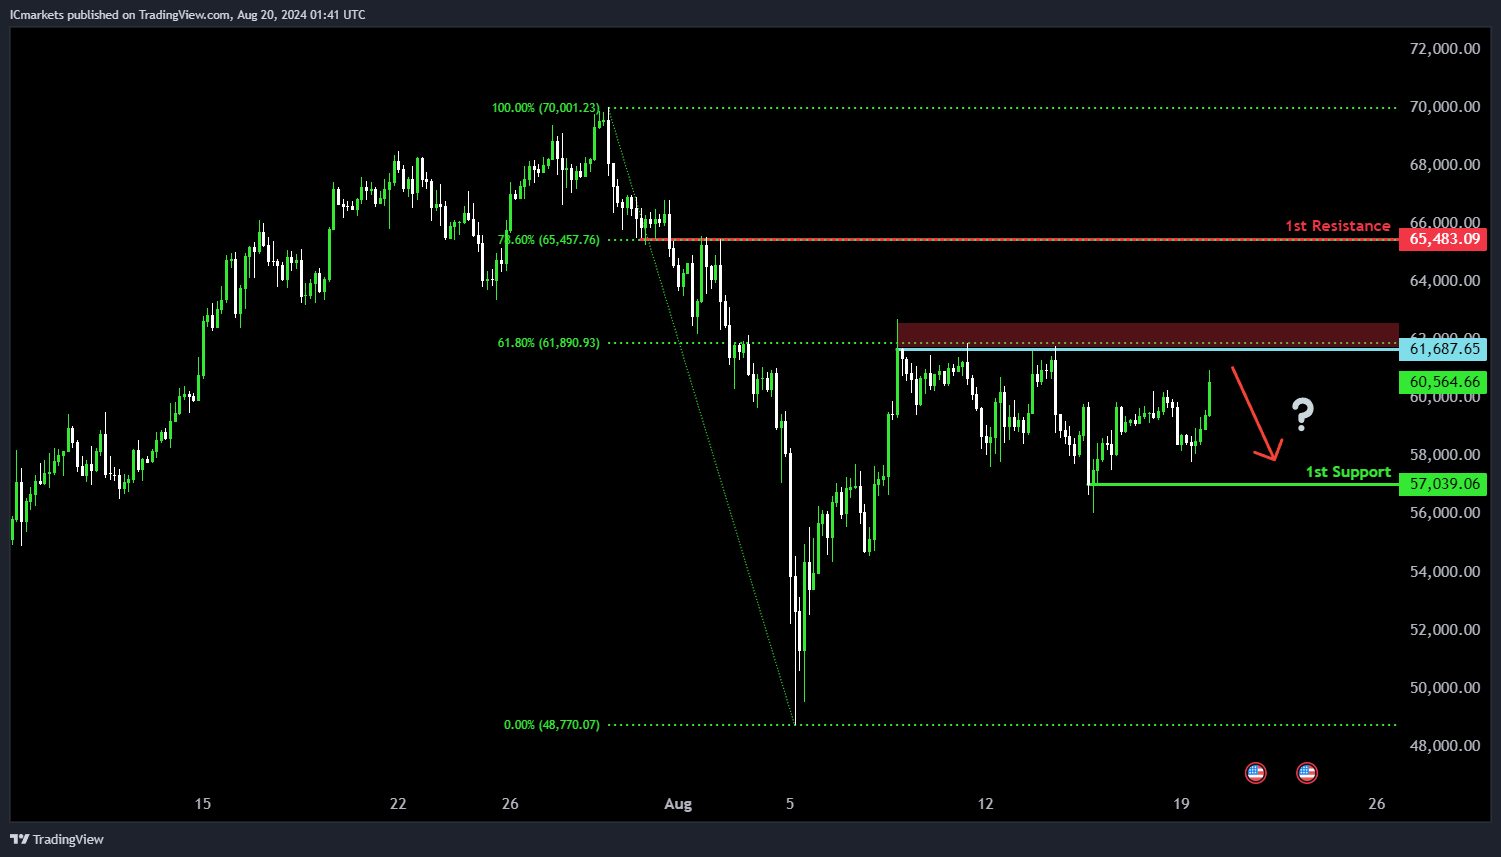
BTC/USD (Bitcoin):
Potential Direction: Bearish
Overall momentum of the chart: Neutral
Price is rising towards the pivot and could potentially make a bearish reversal off this level to fall towards the 1st support.
Pivot: 61,687.65
Supporting reasons: Identified as a pullback resistance that aligns with a 61.8% Fibonacci retracement level, indicating a potential area where selling pressures could intensify.
1st support: 57,039.06
Supporting reasons: Identified as a pullback support, indicating a significant area where price has found support in the past.
1st resistance: 65,483.09
Supporting reasons: Identified as an overlap resistance that aligns with a 78.6% Fibonacci retracement level, indicating a potential barrier that could halt further upward movement.
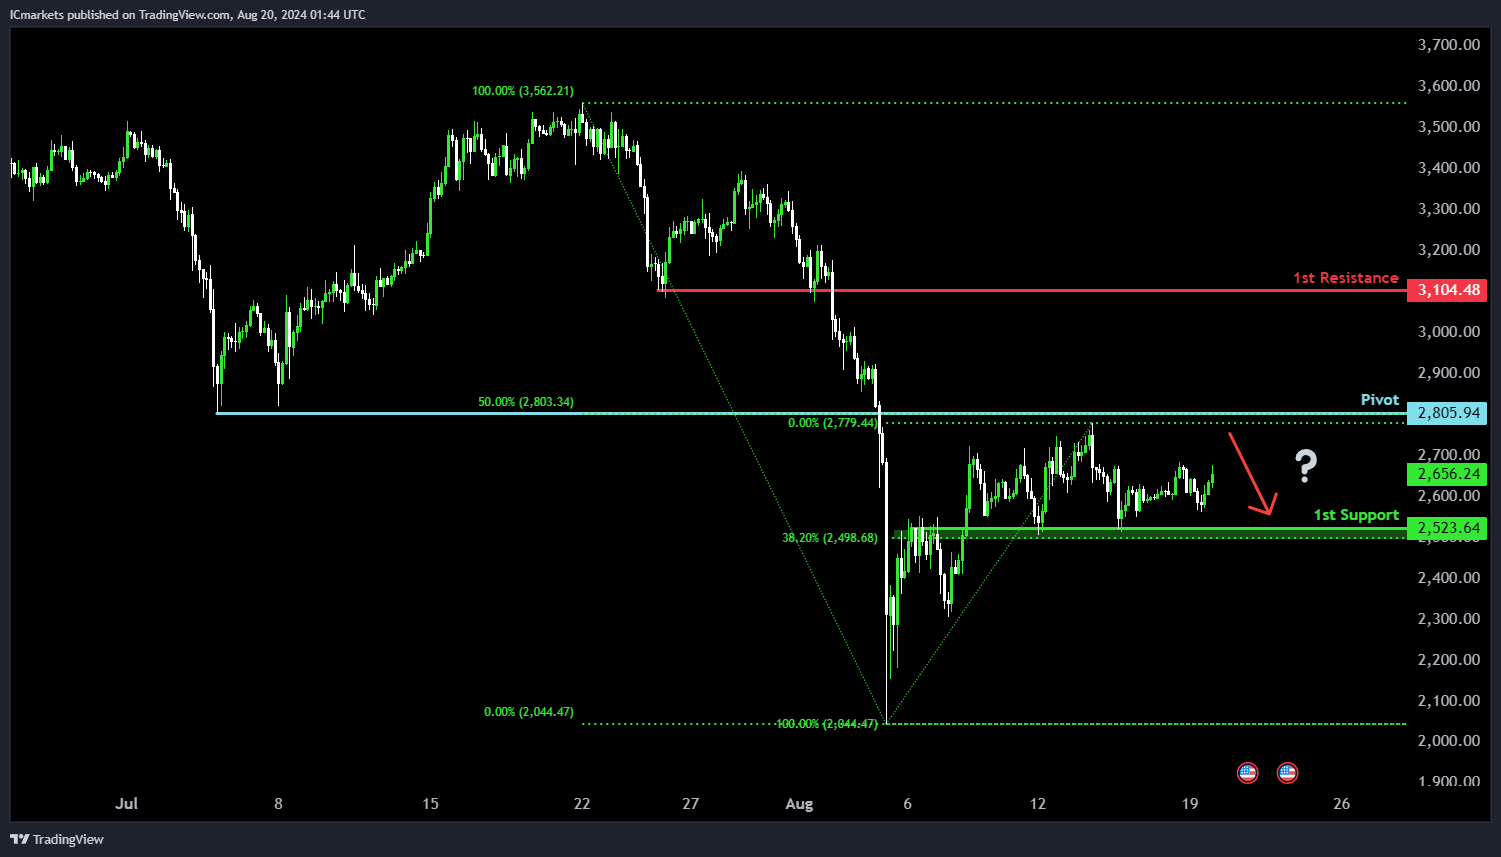
ETH/USD (Ethereum):
Potential Direction: Bearish
Overall momentum of the chart: Neutral
Price is rising towards the pivot and could potentially make a bearish reversal off this level to fall towards the 1st support.
Pivot: 2,805.94
Supporting reasons: Identified as an overlap resistance that aligns with a 50% Fibonacci retracement level, indicating a potential area where selling pressures could intensify.
1st Support: 2,523.64
Supporting Reasons: Identified as an overlap support that aligns with a 38.2% Fibonacci retracement level, indicating a potential area where price could find support.
1st Resistance: 3,104.48
Supporting Reasons: Identified as a pullback resistance, indicating a historical barrier where that could halt further upward movement.
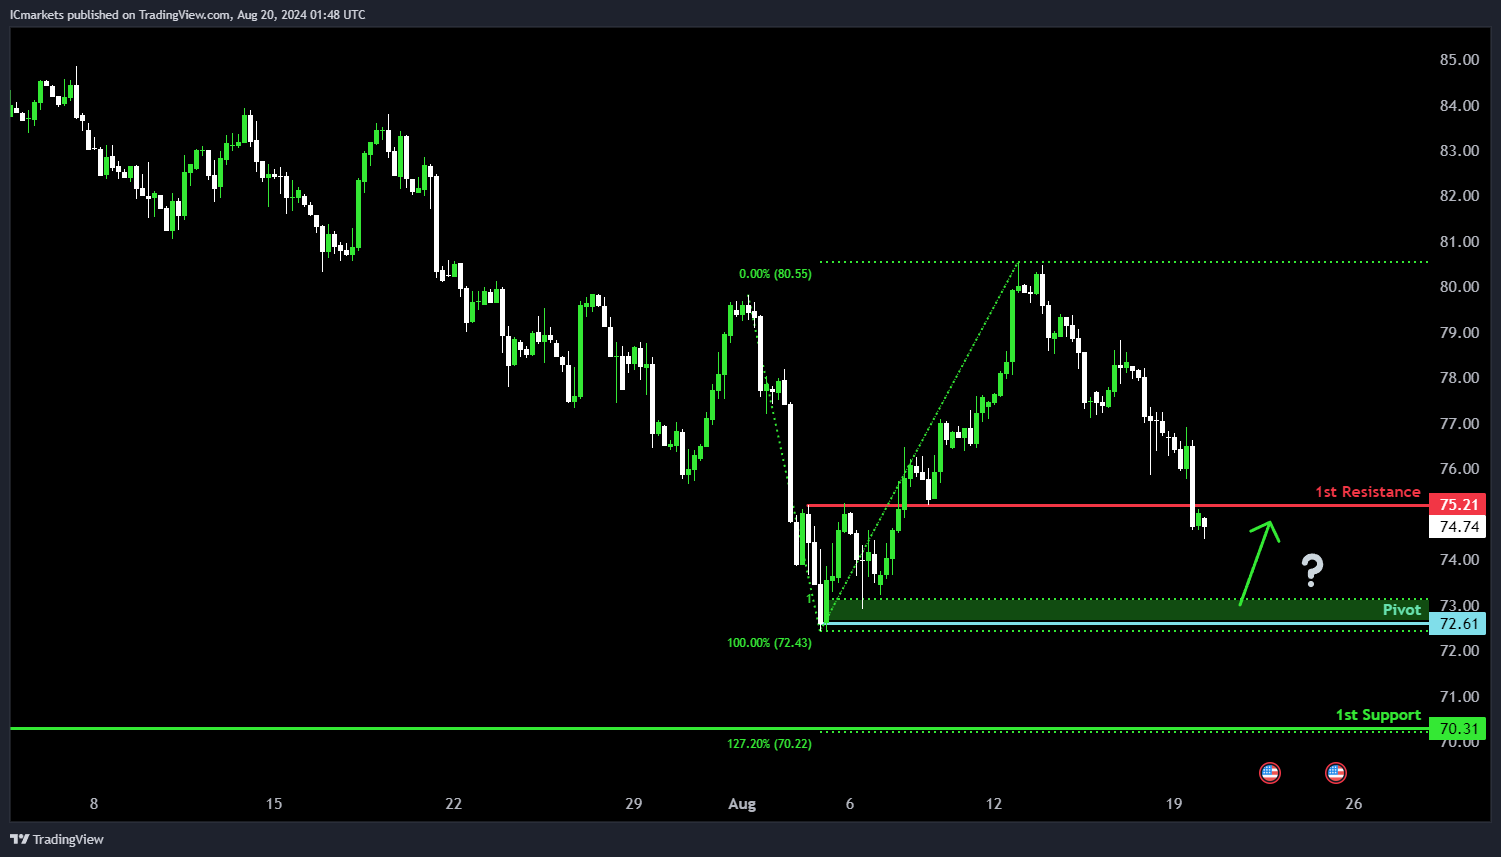
WTI/USD (Oil):
Potential Direction: Bullish
Overall Momentum of the Chart: Bearish
Price is falling towards the pivot and could potentially make a bullish bounce off this level to rise towards the 1st resistance.
Pivot: 72.61
Supporting Reasons: Identified as a swing-low support that aligns close to a 100% Fibonacci projection level, indicating a potential area where buying interests could pick up to stage a minor rebound.
1st Support: 70.31
Supporting Reasons: Identified as a pullback support that aligns with a 127.2% Fibonacci extension level, indicating a significant area where price has found support in the past.
1st Resistance: 75.21
Supporting Reasons: Identified as an overlap resistance, indicating a potential barrier that could halt further upward movement.
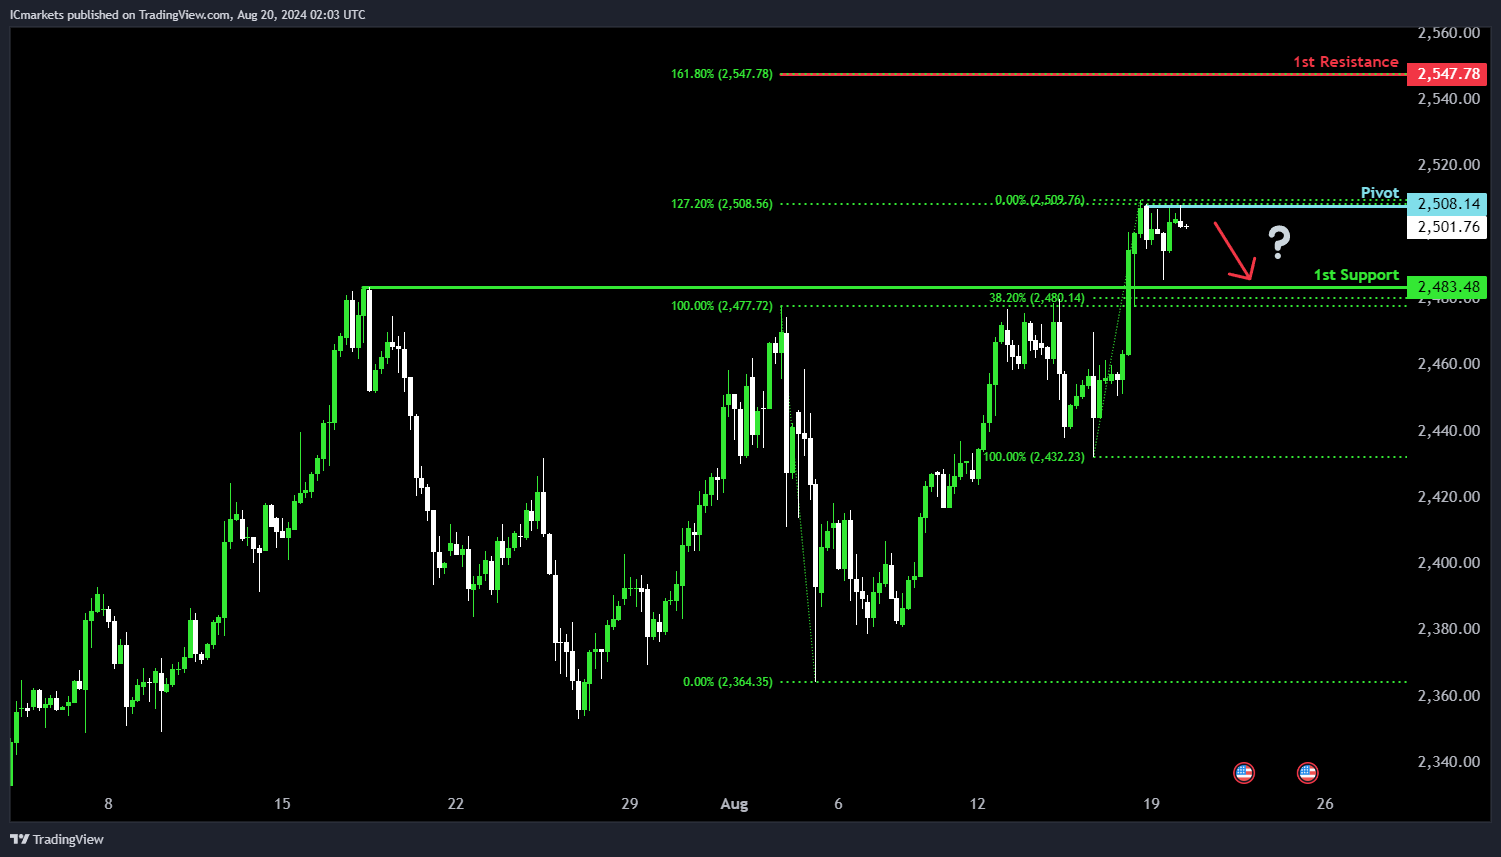
XAU/USD (GOLD):
Potential Direction: Bearish
Overall momentum of the chart: Bullish
Price is trading close to the pivot and could potentially make a bearish reversal off this level to fall towards the 1st support.
Pivot: 2,508.14
Supporting reasons: Identified as pullback resistance that aligns with a 127.2% Fibonacci extension level, indicating a potential area where selling pressures could intensify.
1st support: 2,483.48
Supporting reasons: Identified as pullback support that aligns close to a 38.2% Fibonacci retracement level, indicating a potential area where buying interests could pick up to stage a rebound.
1st resistance: 2,547.78
Supporting reasons: Identified as a resistance that aligns with a 161.8% Fibonacci extension level, indicating a significant area where the price could encounter strong resistance.
The accuracy, completeness and timeliness of the information contained on this site cannot be guaranteed. IC Trading does not warranty, guarantee or make any representations, or assume any liability regarding financial results based on the use of the information in the site.
News, views, opinions, recommendations and other information obtained from sources outside of www.ictrading.com, used in this site are believed to be reliable, but we cannot guarantee their accuracy or completeness. All such information is subject to change at any time without notice. IC Trading assumes no responsibility for the content of any linked site.
The fact that such links may exist does not indicate approval or endorsement of any material contained on any linked site. IC Trading is not liable for any harm caused by the transmission, through accessing the services or information on this site, of a computer virus, or other computer code or programming device that might be used to access, delete, damage, disable, disrupt or otherwise impede in any manner, the operation of the site or of any user’s software, hardware, data or property.