
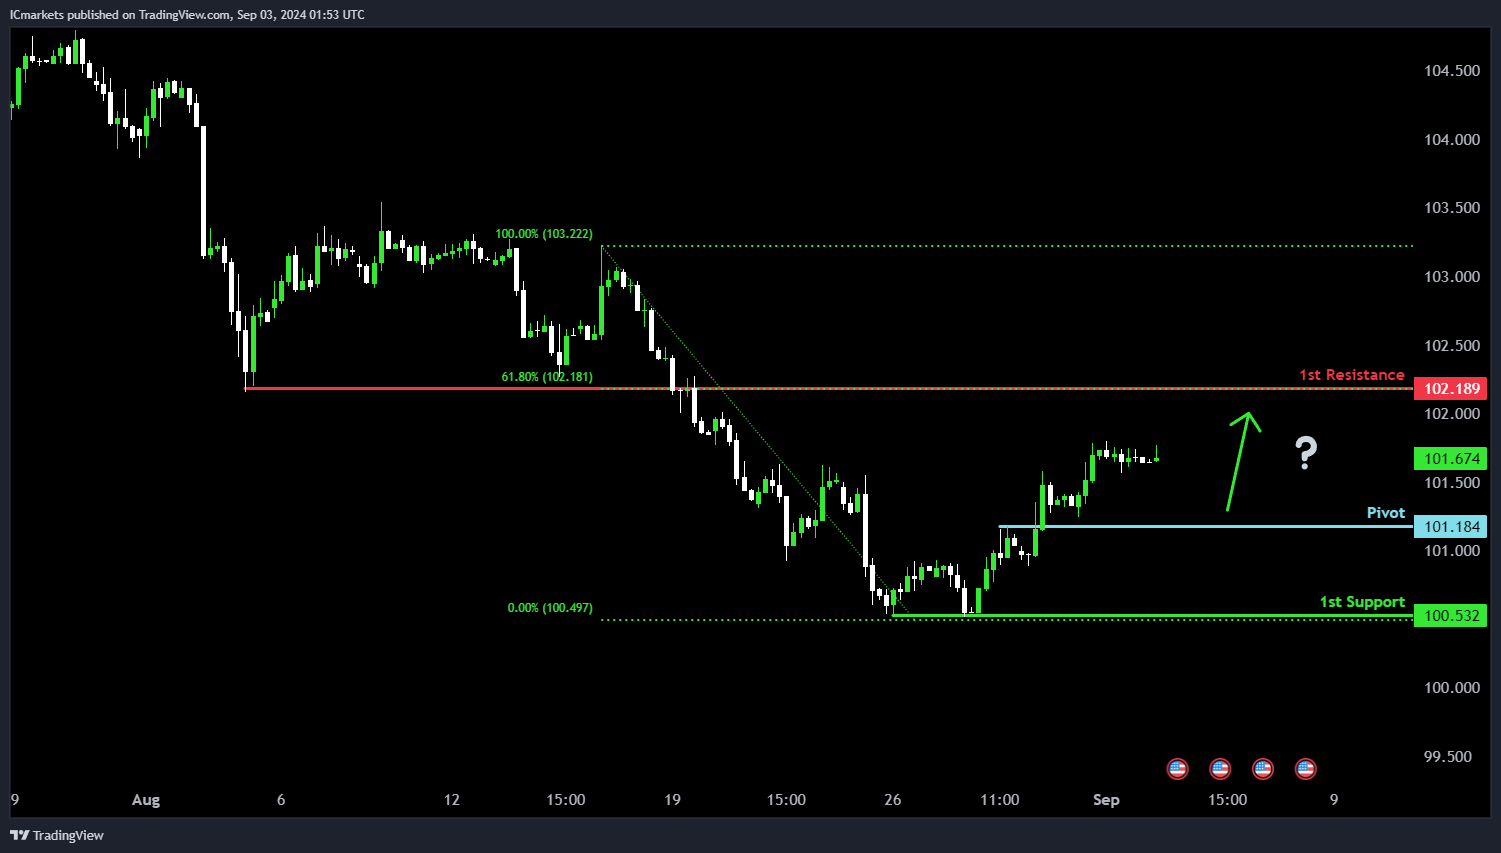
DXY (US Dollar Index):
Potential Direction: Bullish
Overall momentum of the chart: Bullish
Price could potentially make a bullish bounce off the pivot and head towards the 1st resistance.
Pivot: 101.18
Supporting reasons: Identified as pullback support, indicating a potential area where buyers could step in to push the price higher.
1st support: 100.54
Supporting reasons: Recognized as multi-swing low support, suggesting a significant area where previous declines have found support.
1st resistance: 103.69
Supporting reasons: Marked as pullback resistance, highlighting a historical point where previous rallies have faced selling pressure or reversed.
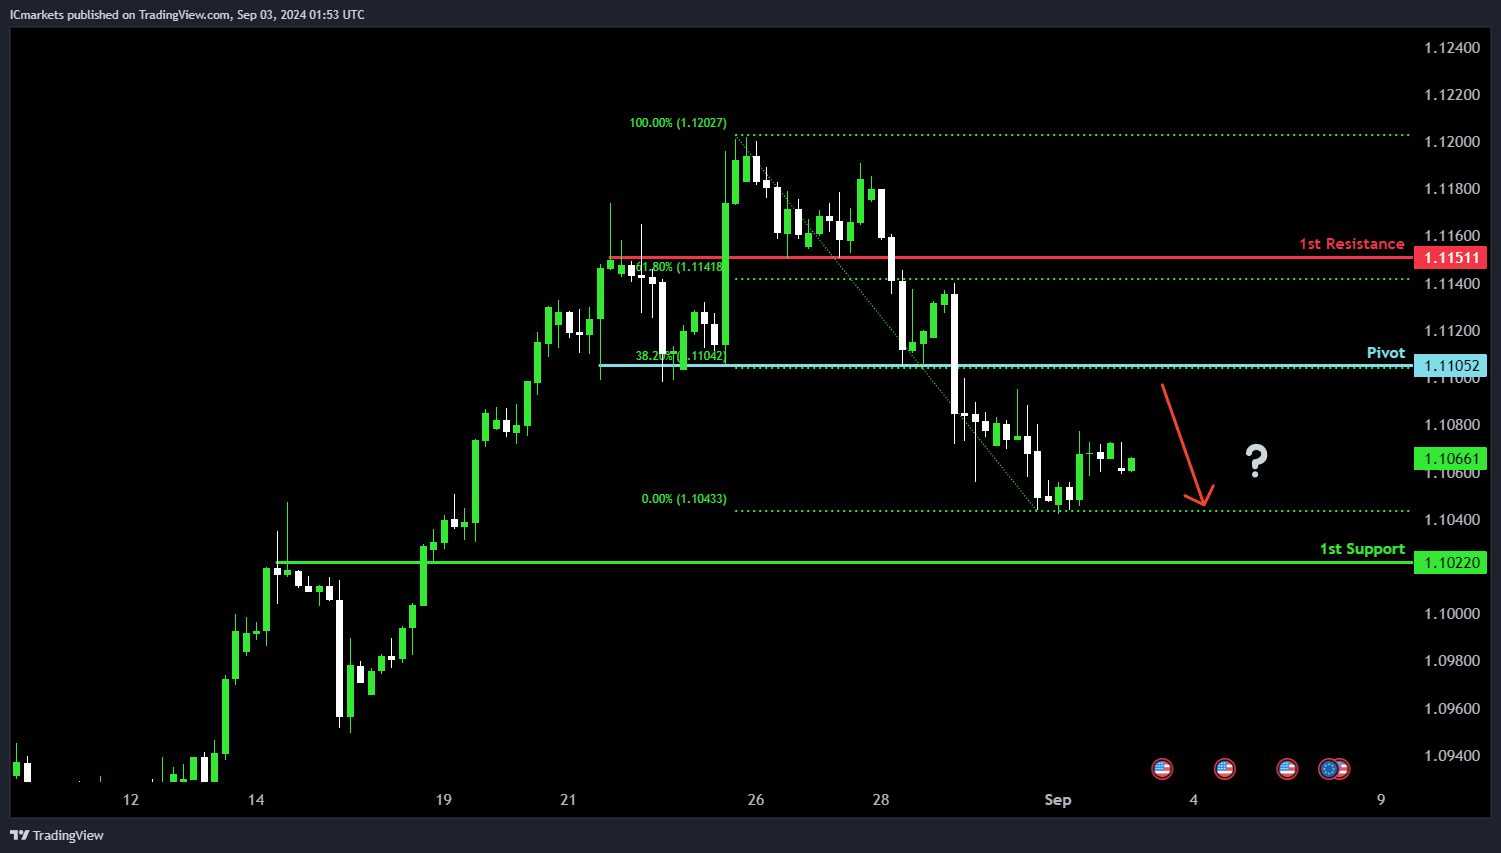
EUR/USD:
Potential Direction: Bearish
Overall momentum of the chart: Bearish
Price could potentially make a bearish reaction off the pivot and drop to the 1st support.
Pivot: 1.1105
Supporting reasons: Identified as pullback resistance, supported by the 38.20% Fibonacci retracement, indicating a potential area where selling pressure could resume.
1st support: 1.1022
Supporting reasons: Recognized as an overlap support level, suggesting a significant area where previous declines have stabilized.
1st resistance: 1.1151
Supporting reasons: Marked as pullback resistance, highlighted by the 61.80% Fibonacci retracement, indicating a historical point where price rallies might face resistance.
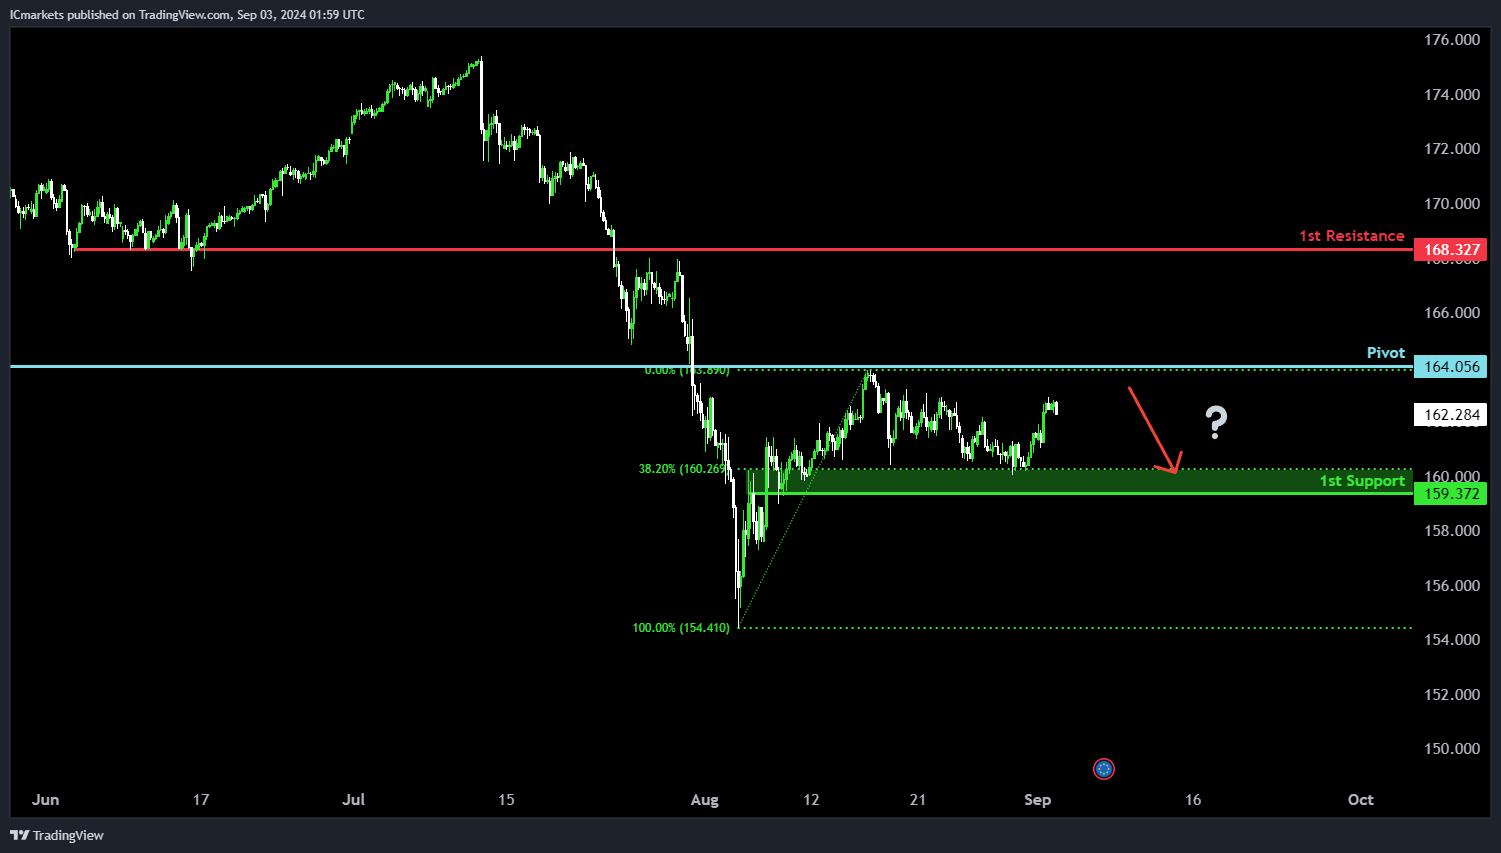
EUR/JPY:
Potential Direction: Bearish
Overall momentum of the chart: Bearish
Price could potentially make a bearish reaction off the pivot and drop to 1st support.
Pivot: 164.05
Supporting reasons: Identified as an overlap resistance, suggesting a key area where sellers might enter the market, reinforcing bearish momentum.
1st support: 159.37
Supporting reasons: Marked as overlap support and supported by the 38.20% Fibonacci Retracement, indicating a potential level where the price may find buying interest.
1st resistance: 168.32
Supporting reasons: Recognized as pullback resistance, indicating a potential area where the price could face selling pressure if it retraces upward.
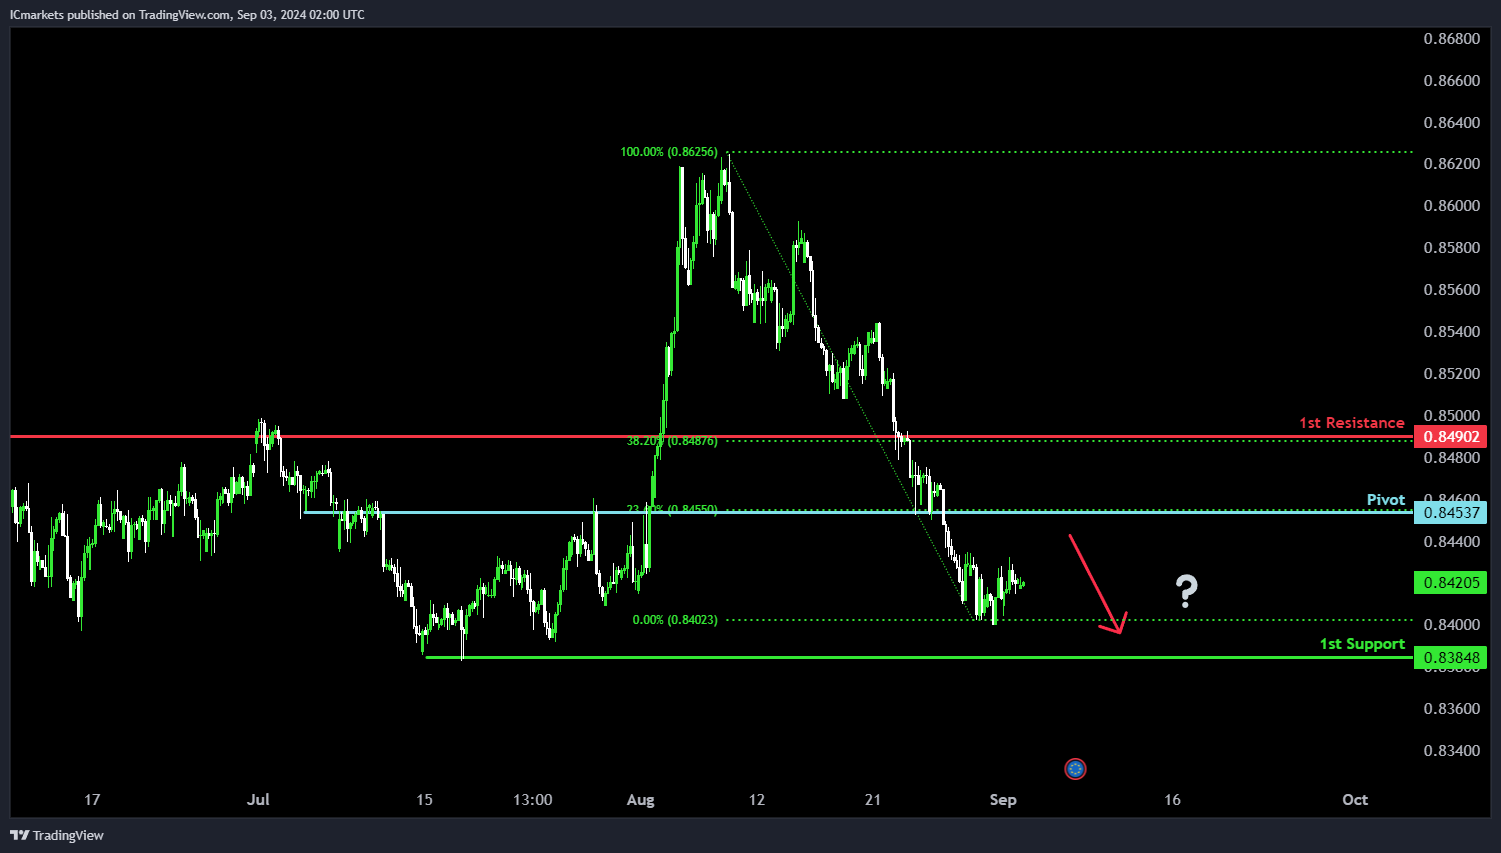
EUR/GBP:
Potential Direction: Bearish
Overall momentum of the chart: Bearish
Price could potentially make a bearish reaction off the pivot and drop to 1st support.
Pivot: 0.8453
Supporting reasons: Identified as pullback support, reinforced by the 23.60% Fibonacci Retracement, indicating a potential area where the price might stall before continuing downward.
1st support: 0.8384
Supporting reasons: Marked as swing low support, suggesting a significant area where previous declines have found a buying interest.
1st resistance: 0.8490
Supporting reasons: Recognized as pullback resistance, supported by the 38.20% Fibonacci Retracement, indicating a potential level where the price may face selling pressure if it retraces upward.
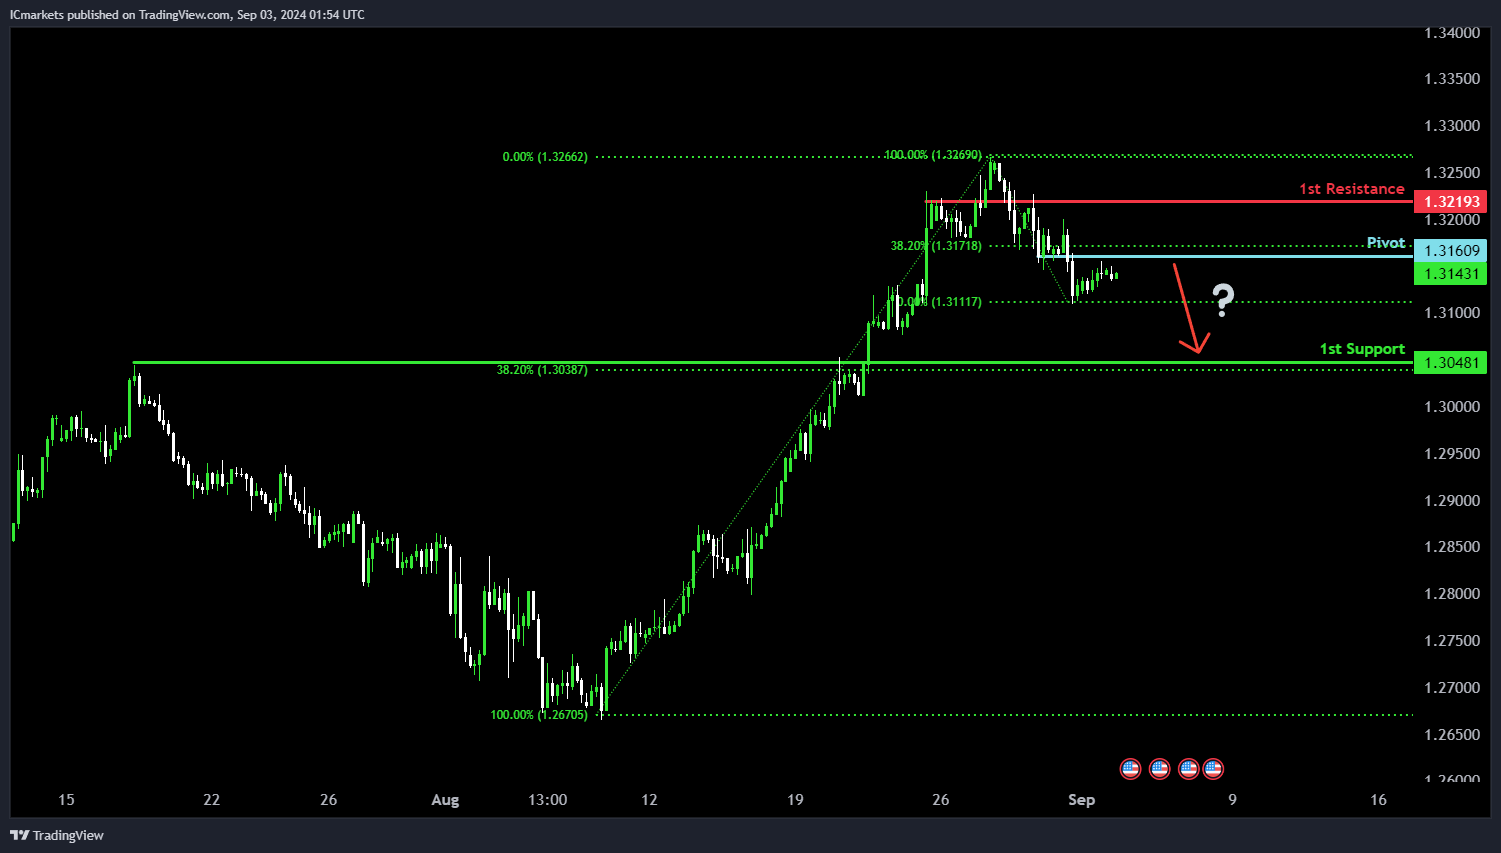
GBP/USD:
Potential Direction: Bearish
Overall momentum of the chart: Bearish
Price could potentially make a bearish reaction off the pivot and drop to the 1st support.
Pivot: 1.3160
Supporting reasons: Identified as pullback resistance, reinforced by the 38.20% Fibonacci retracement, indicating a potential area where selling pressure could resume.
1st support: 1.3048
Supporting reasons: Recognized as pullback support, aligned with the 38.20% Fibonacci retracement, suggesting a significant area where previous declines have found support.
1st resistance: 1.3219
Supporting reasons: Marked as an overlap resistance level, highlighting a point where previous rallies have encountered selling pressure or reversal.
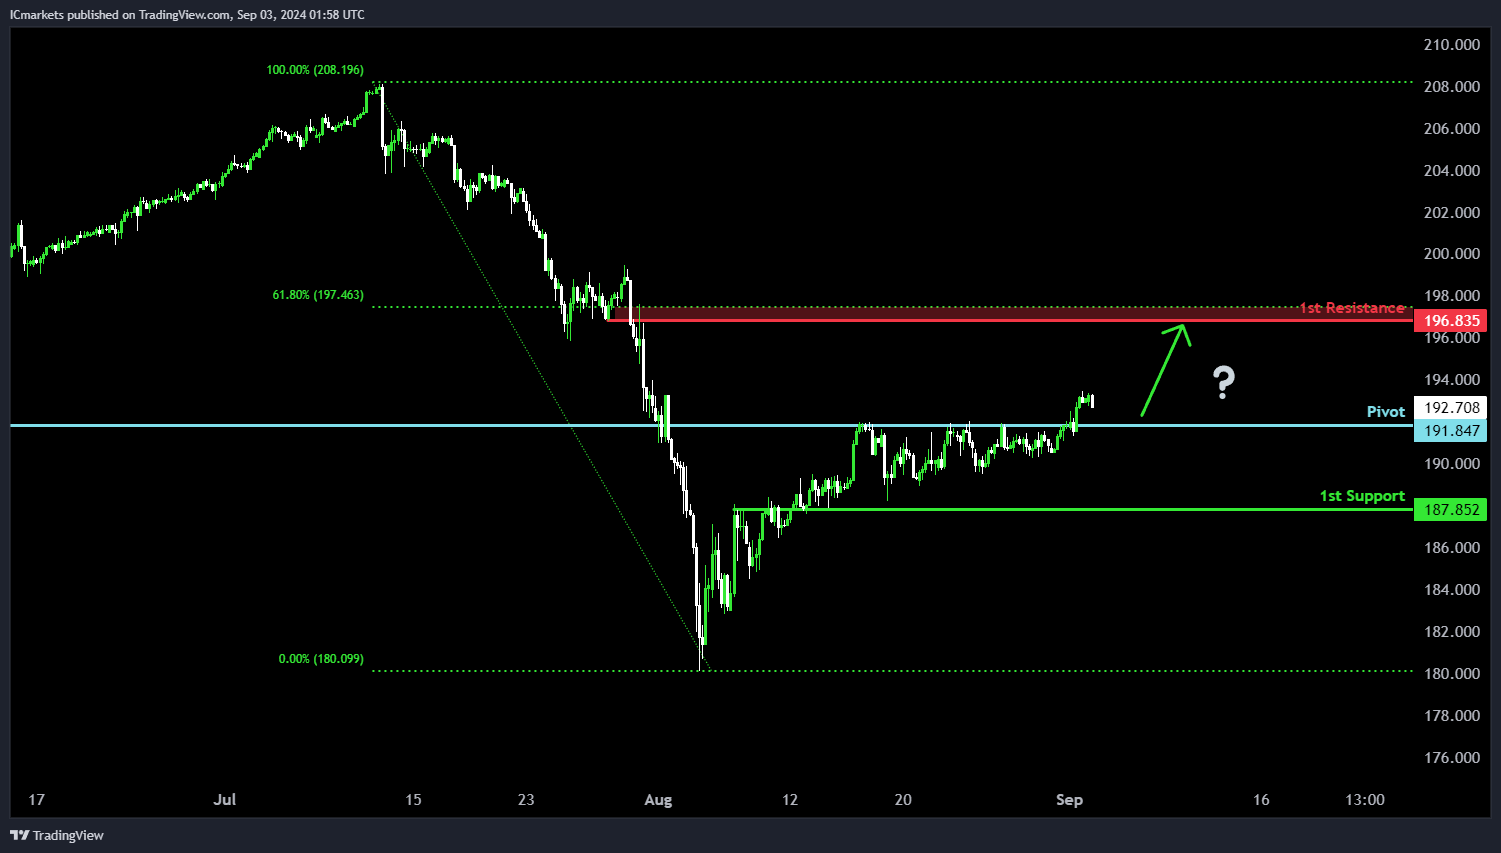
GBP/JPY:
Potential Direction: Bullish
Overall momentum of the chart: Bullish
Price could potentially make a bullish bounce off the pivot and head towards the 1st resistance.
Pivot: 191.84
Supporting reasons: Identified as pullback support, suggesting a strong level where buyers may step in to drive the price higher.
1st support: 187.85
Supporting reasons: Recognized as an overlap support level, indicating a significant area where previous declines have found stability.
1st resistance: 196.83
Supporting reasons: Marked as pullback resistance, reinforced by the 61.80% Fibonacci retracement, indicating a potential area where the upward momentum might face selling pressure or pause.
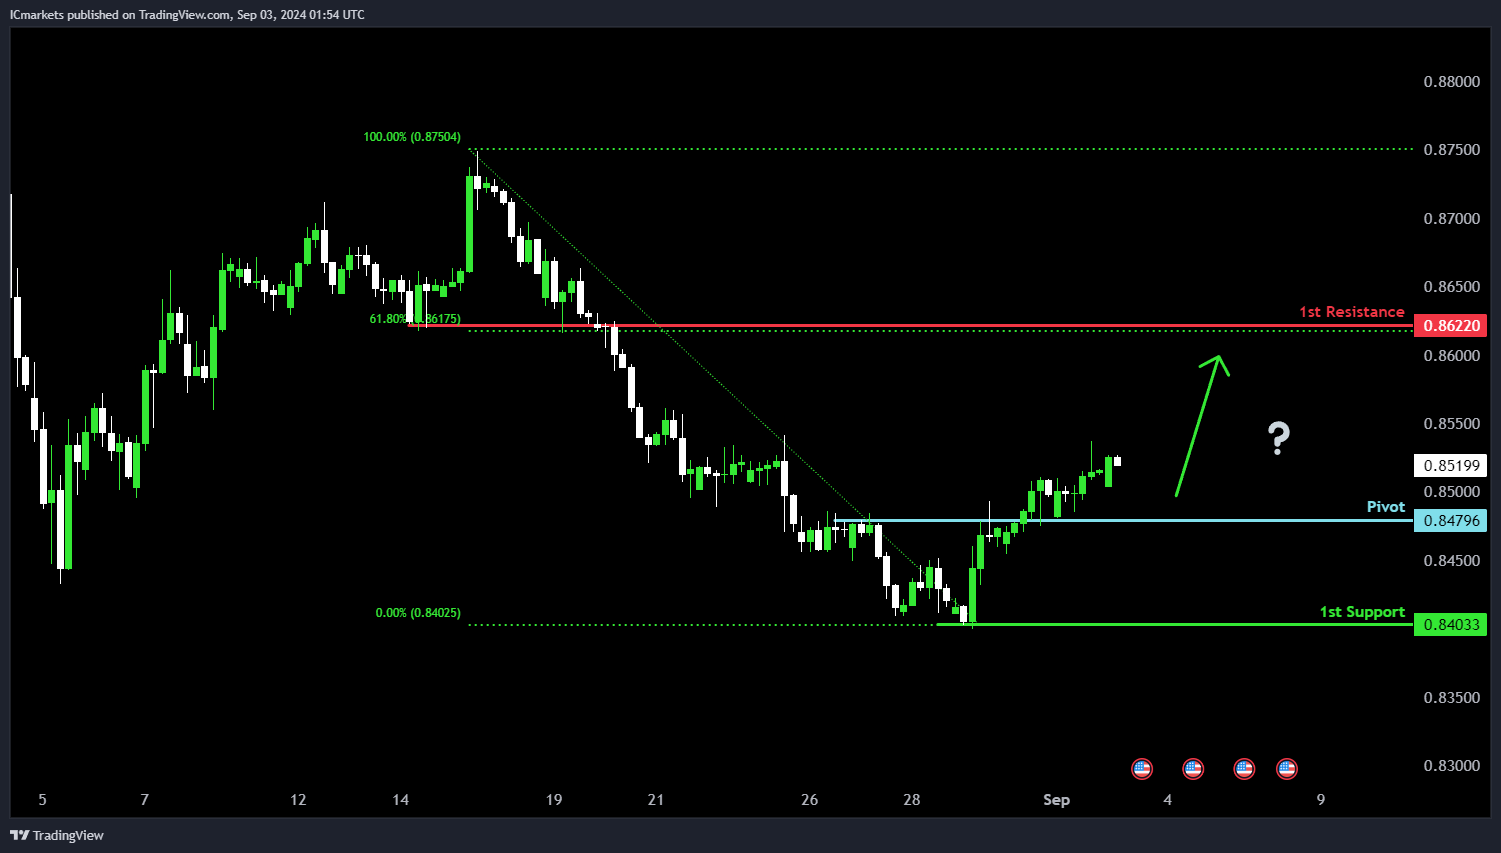
USD/CHF:
Potential Direction: Bullish
Overall momentum of the chart: Bullish
Price could potentially make a bullish bounce off the pivot and head towards the 1st resistance.
Pivot: 0.8479
Supporting reasons: Identified as an overlap support, indicating a level where previous price movements have found stability and could provide a base for further upward movement.
1st support: 0.8403
Supporting reasons: Recognized as swing low support, suggesting an area where past declines have reversed, potentially acting as a floor for the current trend.
1st resistance: 0.8622
Supporting reasons: Marked as pullback resistance, reinforced by the 61.80% Fibonacci retracement, signaling a potential area where the upward momentum could encounter selling pressure or consolidation.
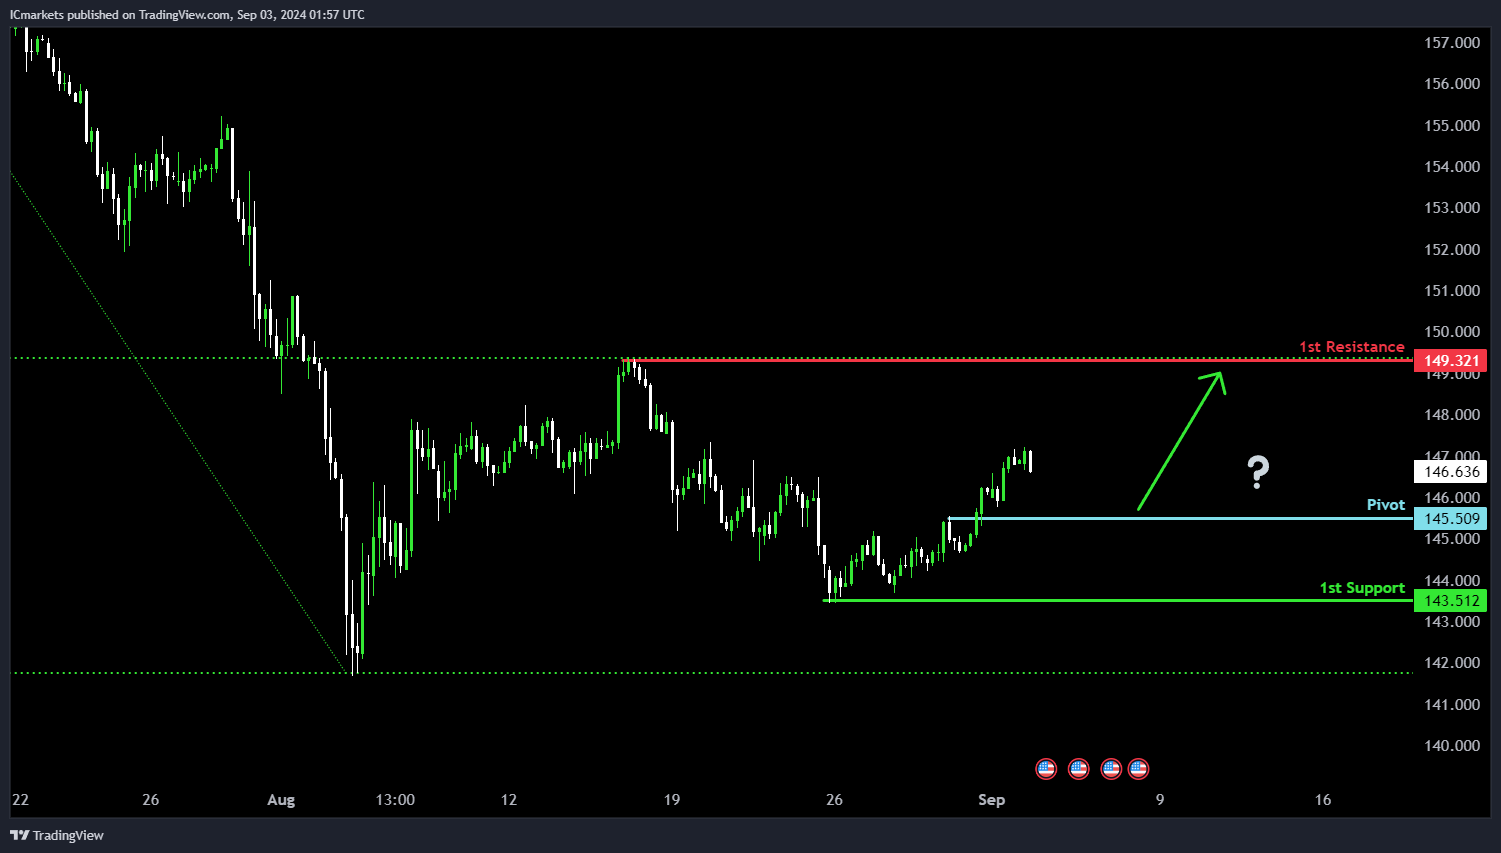
USD/JPY:
Potential Direction: Bullish
Overall momentum of the chart: Bullish
Price could potentially make a bullish bounce off the pivot and head towards the 1st resistance.
Pivot: 145.51
Supporting reasons: Identified as pullback support, indicating a level where the price has previously retraced and could find buying interest, potentially leading to a bounce.
1st support: 143.51
Supporting reasons: Recognized as multi-swing low support, suggesting an area where the price has reversed multiple times in the past, providing a strong support level.
1st resistance: 149.32
Supporting reasons: Marked as swing high resistance, signaling a previous peak where the price encountered selling pressure, which could again act as a barrier to further gains.
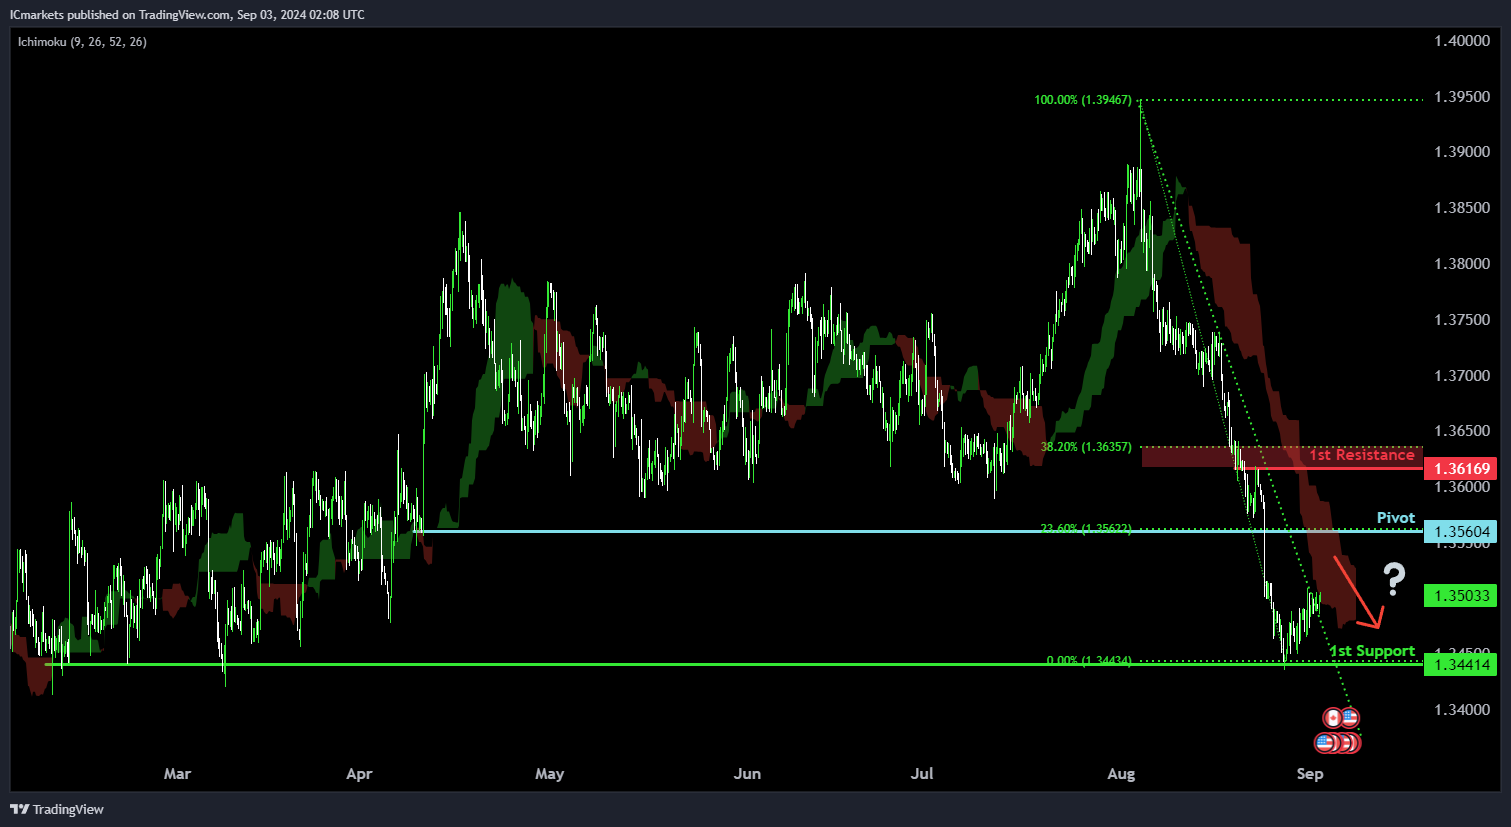
USD/CAD:
Potential Direction: Bearish
Overall momentum of the chart: Bearish
Price is rising towards the pivot and could potentially make a bearish reversal off this level to fall lower towards the 1st support.
Pivot: 1.3517
Supporting reasons: Identified as a pullback resistance, indicating a potential area where selling pressures could intensify. The presence of the descending trendline adds further significance to this resistance zone.
1st support: 1.3441
Supporting reasons: Identified as a multi-swing-low support, indicating a potential area where price could find strong support.
1st resistance: 1.3585
Supporting reasons: Identified as a pullback resistance, indicating a potential area that could halt any further upward movement.
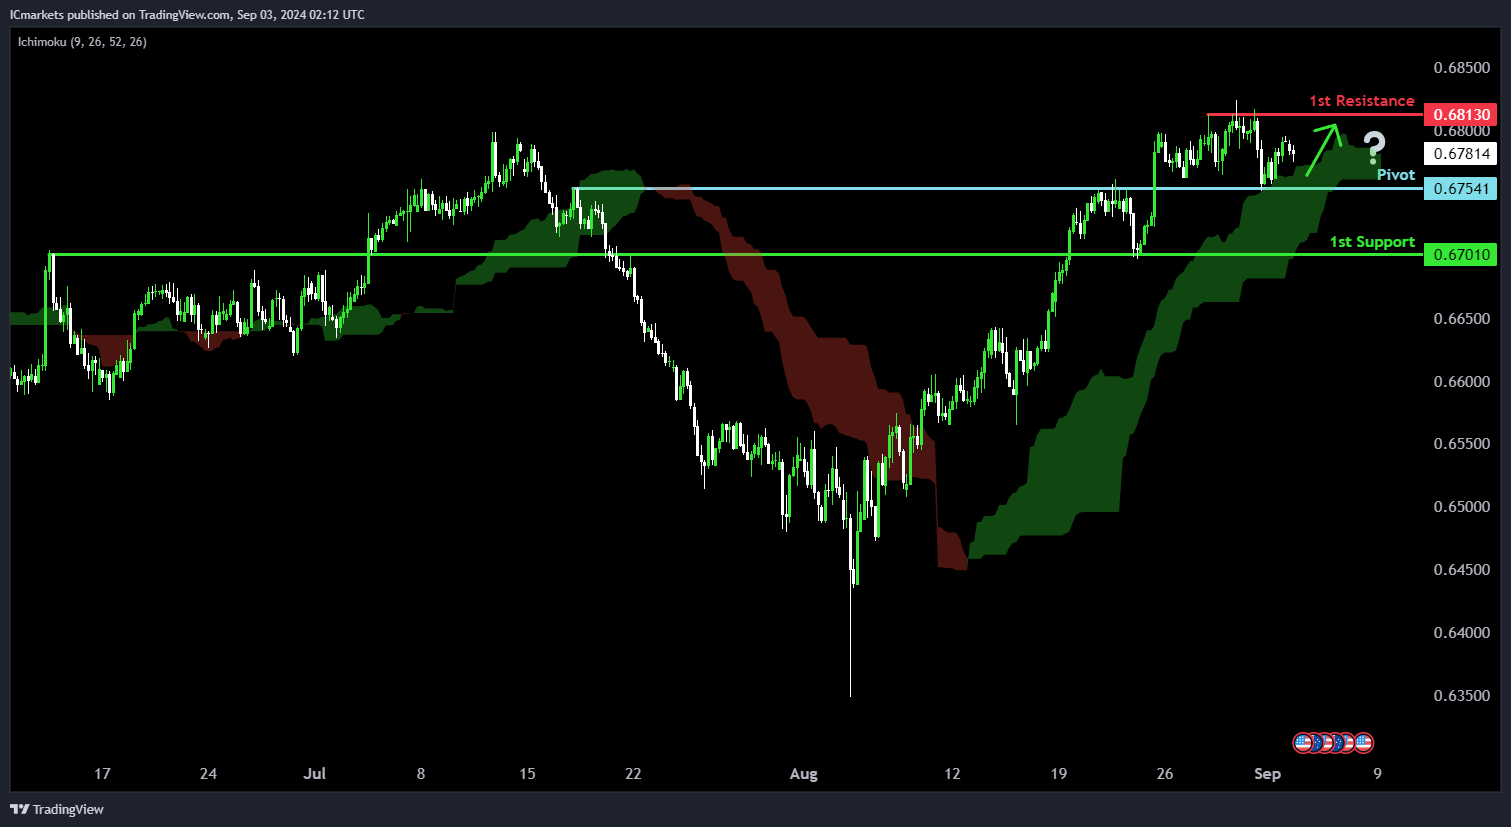
AUD/USD:
Potential Direction: Bullish
Overall momentum of the chart: Bullish
Price is falling towards the pivot and could potentially make a bullish bounce off this level to rise towards the 1st resistance.
Pivot: 0.6754
Supporting reasons: Identified as an overlap support, indicating a significant area where buying interests could pick up to resume the uptrend. The presence of a bullish Ichimoku Cloud adds further significance to the strength of this support zone.
1st support: 0.6701
Supporting reasons: Identified as an overlap support, suggesting a potential area where price could find support.
1st resistance: 0.6813
Supporting reasons: Identified as a swing-high resistance, indicating a significant area that could halt further upward movement.
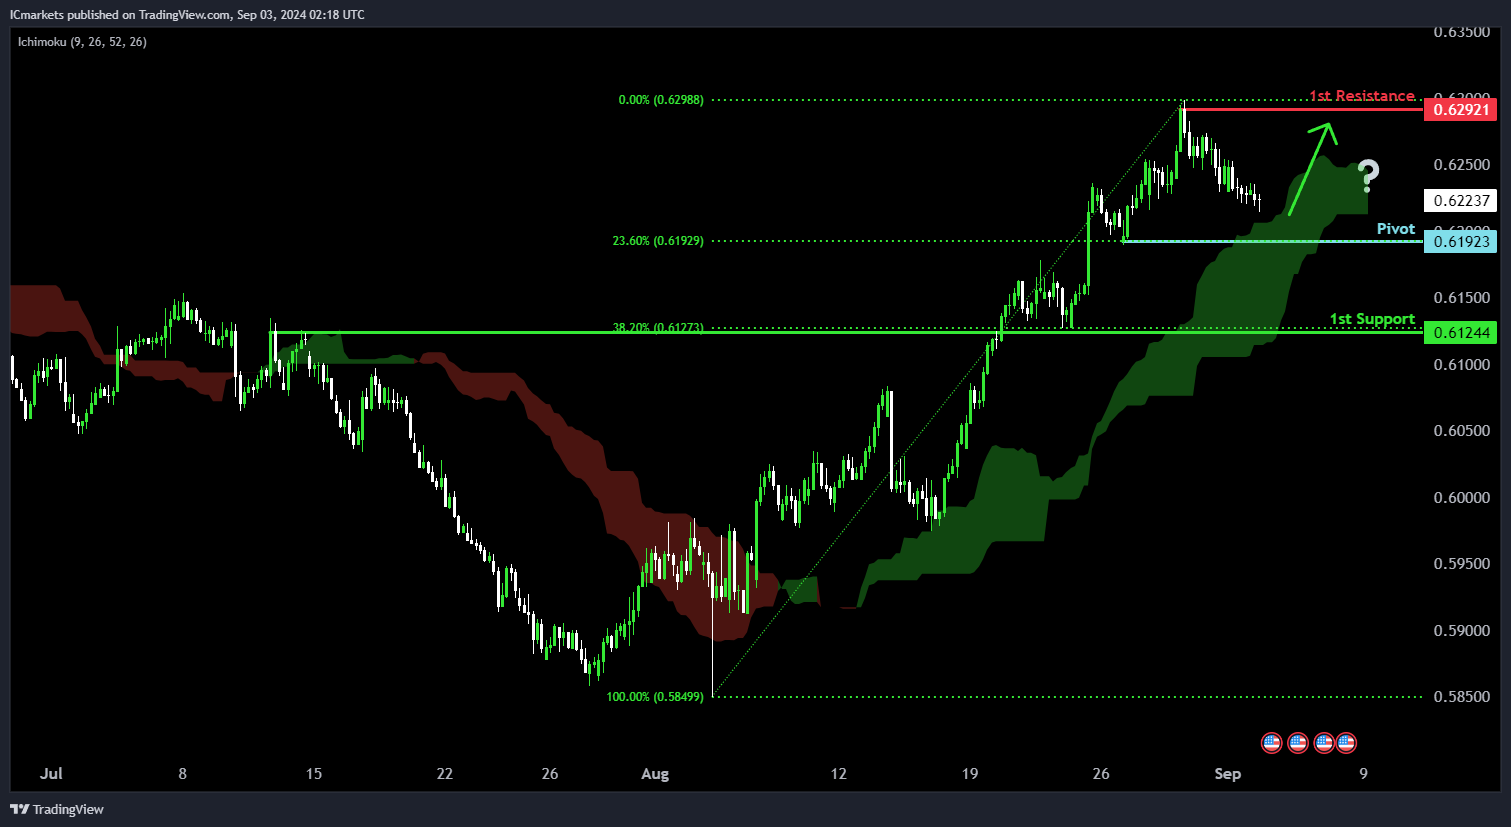
NZD/USD
Potential Direction: Bullish
Overall momentum of the chart: Bullish
Price is falling towards the pivot and could potentially make a bullish bounce off this level to rise towards the 1st resistance.
Pivot: 0.6192
Supporting reasons: Identified as a swing-low support that aligns with a 23.6% Fibonacci retracement, indicating a significant area where buying interests could pick up to resume the uptrend. The presence of a bullish Ichimoku Cloud adds further significance to the strength of this support zone.
1st support: 0.6124
Supporting reasons: Identified as an overlap support that aligns with a 38.2% Fibonacci retracement, suggesting a potential area where price could find support.
1st resistance: 0.6292
Supporting reasons: Identified as a swing-high resistance, indicating a significant area that could halt further upward movement.
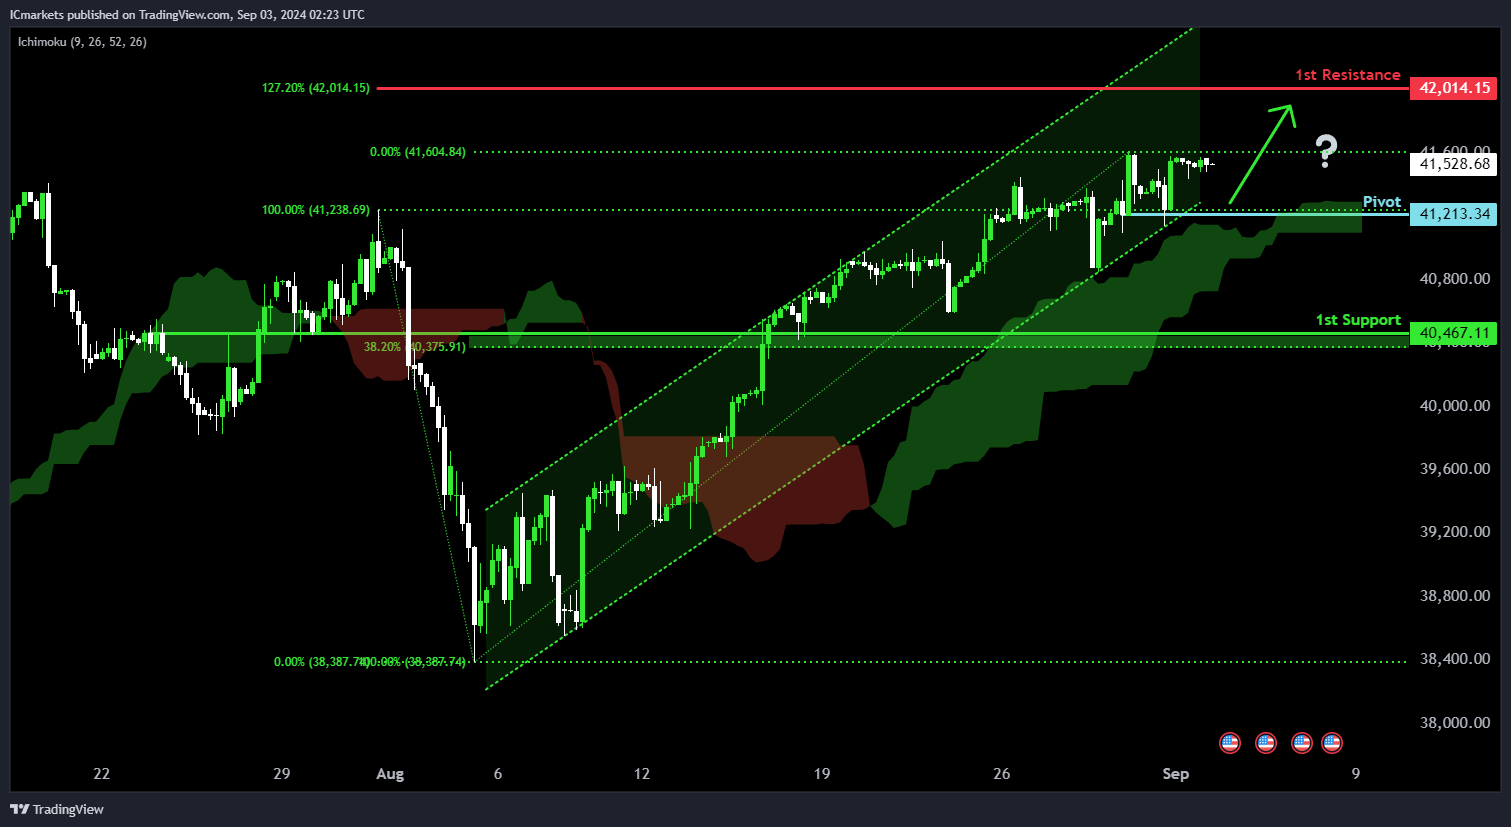
US30 (DJIA):
Potential Direction: Bullish
Overall Momentum of the Chart: Bullish
Price could fall towards the pivot and potentially make a bullish bounce off this level to rise towards the 1st resistance.
Pivot: 41,213.34
Supporting reasons: Identified as a pullback support, suggesting a potential area where buying interests could pick up to resume the uptrend. The presence of a bullish Ichimoku Cloud and the bullish channel add further significance to the strength of this support zone.
1st Support: 40,467.11
Supporting Reasons: Identified as an overlap support that aligns close to a 38.2% Fibonacci retracement, suggesting an area where price could find support.
1st Resistance: 42,014.15
Supporting Reasons: Identified as a resistance that aligns with a 127.2% Fibonacci extension, indicating a significant area that could halt further upward movement.
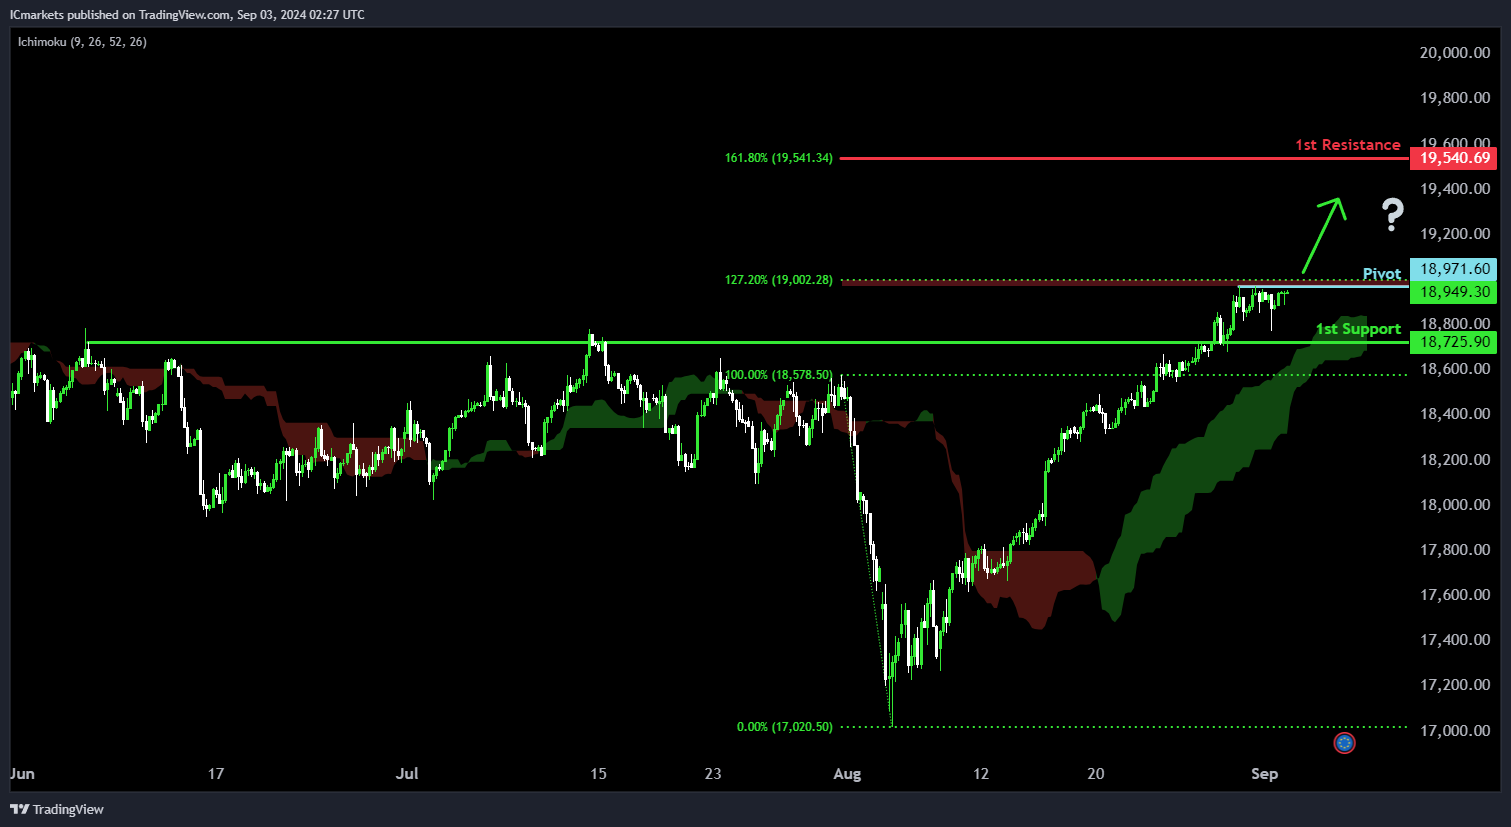
DE40 (DAX):
Potential Direction: Bullish
Overall Momentum of the Chart: Bullish
Price is rising towards the pivot and could potentially make a bullish break above this level to rise towards the 1st resistance.
Pivot: 18,971.60
Supporting reasons: Identified as a potential area where a bullish breakout could take place due to the strong upward momentum.
1st Support: 18,725.90
Supporting Reasons: Identified as an overlap support, indicating a potential area where price could find support. The presence of a bullish Ichimoku Cloud adds further significance to the strength of this support zone.
1st Resistance: 19,540.69
Supporting Reasons: Identified as a resistance that aligns with a 161.8% Fibonacci extension, indicating a significant area that could halt further upward movement.
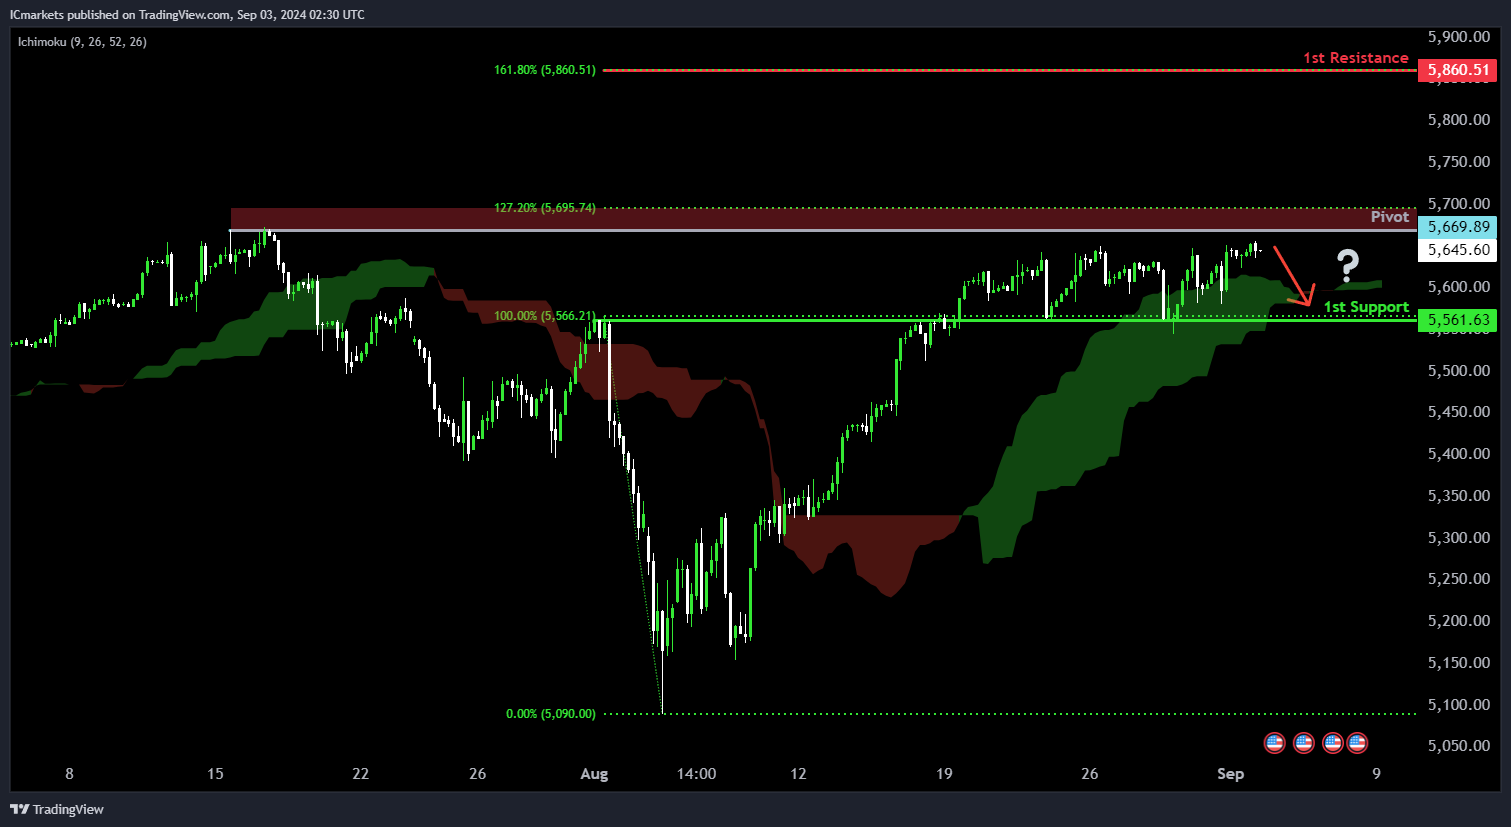
US500 (S&P 500):
Potential Direction: Bearish
Overall Momentum of the Chart: Bullish
Price is rising towards the pivot and could potentially make a bearish reversal off this level to pull back towards the 1st support.
Pivot: 5,669.89
Supporting reasons: Identified as a swing-high resistance that aligns close to a 127.2% Fibonacci extension level, suggesting a potential area where selling pressures could intensify.
1st support: 5,561.63
Supporting reasons: Identified as an overlap support, suggesting a potential area where price has found support recently.
1st resistance: 5,860.51
Supporting reasons: Identified as a resistance that aligns with a 161.8% Fibonacci extension, suggesting a critical area that could halt further upward movement.
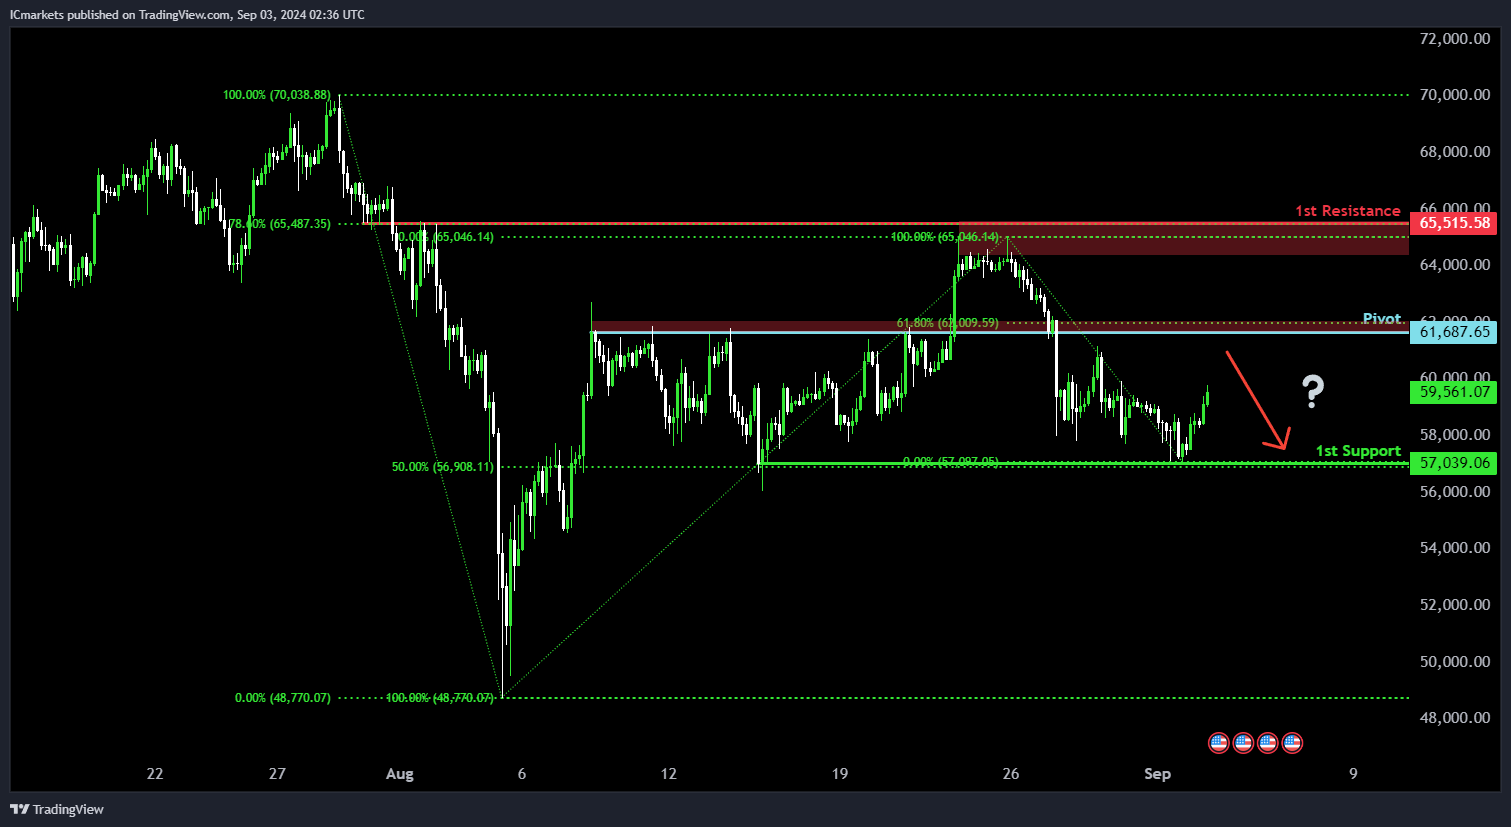
BTC/USD (Bitcoin):
Potential Direction: Bearish
Overall momentum of the chart: Neutral
Price is rising towards the pivot and could potentially make a bearish reversal off this level to fall towards the 1st support.
Pivot: 61,687.65
Supporting reasons: Identified as an overlap resistance that aligns close to a 61.8% Fibonacci retracement, indicating a potential area where selling pressures could intensify.
1st support: 57,039.06
Supporting reasons: Identified as a pullback support that aligns with a 50% Fibonacci retracement, indicating a significant area where price has found support in the past.
1st resistance: 65,515.58
Supporting reasons: Identified as an overlap resistance that aligns with a 78.6% Fibonacci retracement, indicating a potential barrier that could halt further upward movement.
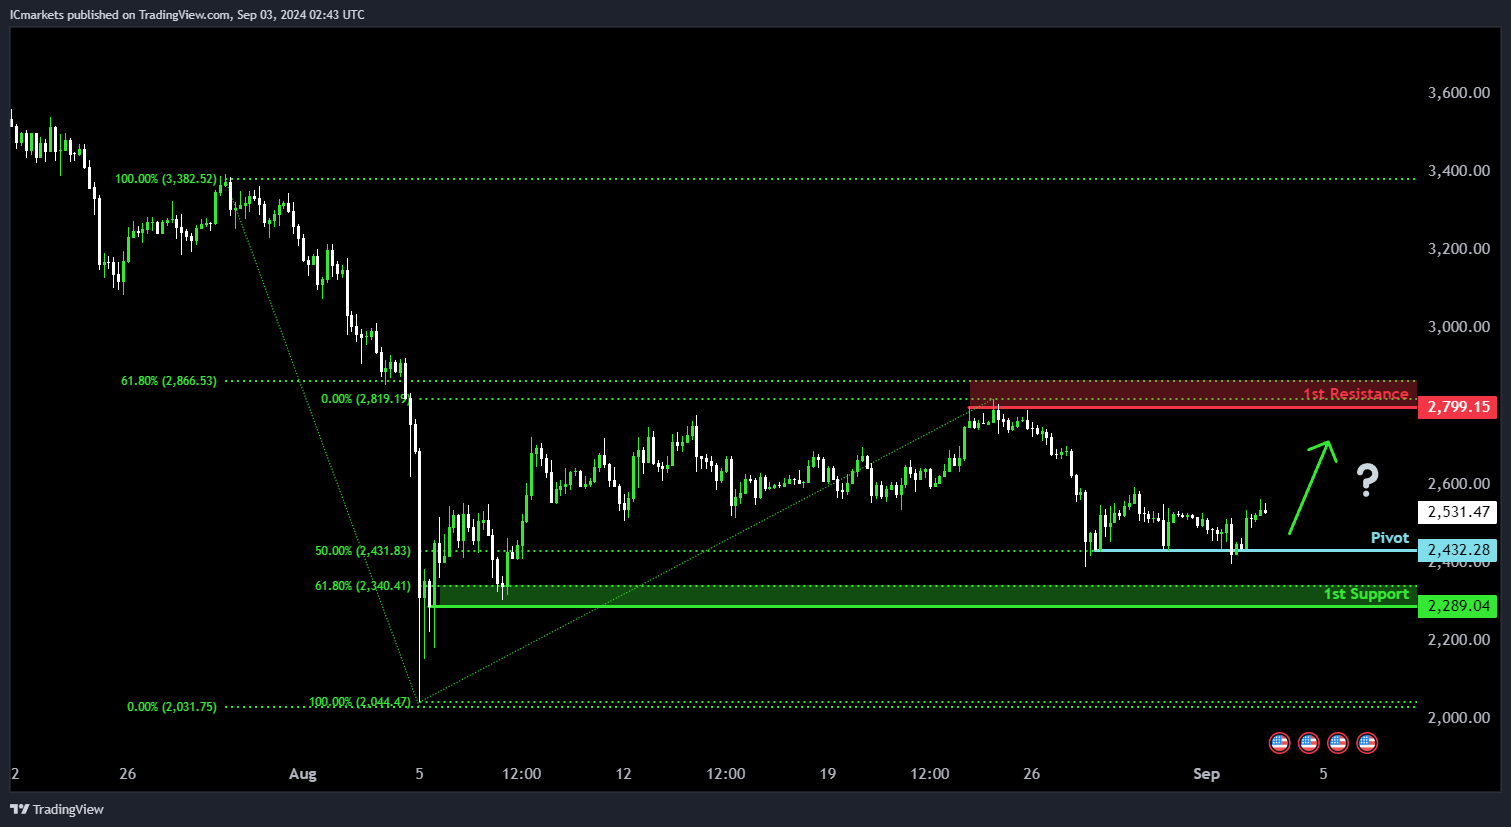
ETH/USD (Ethereum):
Potential Direction: Bullish
Overall momentum of the chart: Neutral
Price is falling towards the pivot and could potentially make a bullish bounce off this level to rise towards the 1st resistance.
Pivot: 2,432.28
Supporting reasons: Identified as a pullback support that aligns with a 50% Fibonacci retracement, indicating a potential area where buying interests could pick up to stage a minor rebound.
1st Support: 2,289.04
Supporting Reasons: Identified as a multi-swing-low support that aligns close to a 61.8% Fibonacci retracement, indicating a potential area where price could find support.
1st Resistance: 2,799.15
Supporting Reasons: Identified as a swing-high resistance that aligns close to a 61.8% Fibonacci retracement, indicating a historical barrier where that could halt further upward movement.
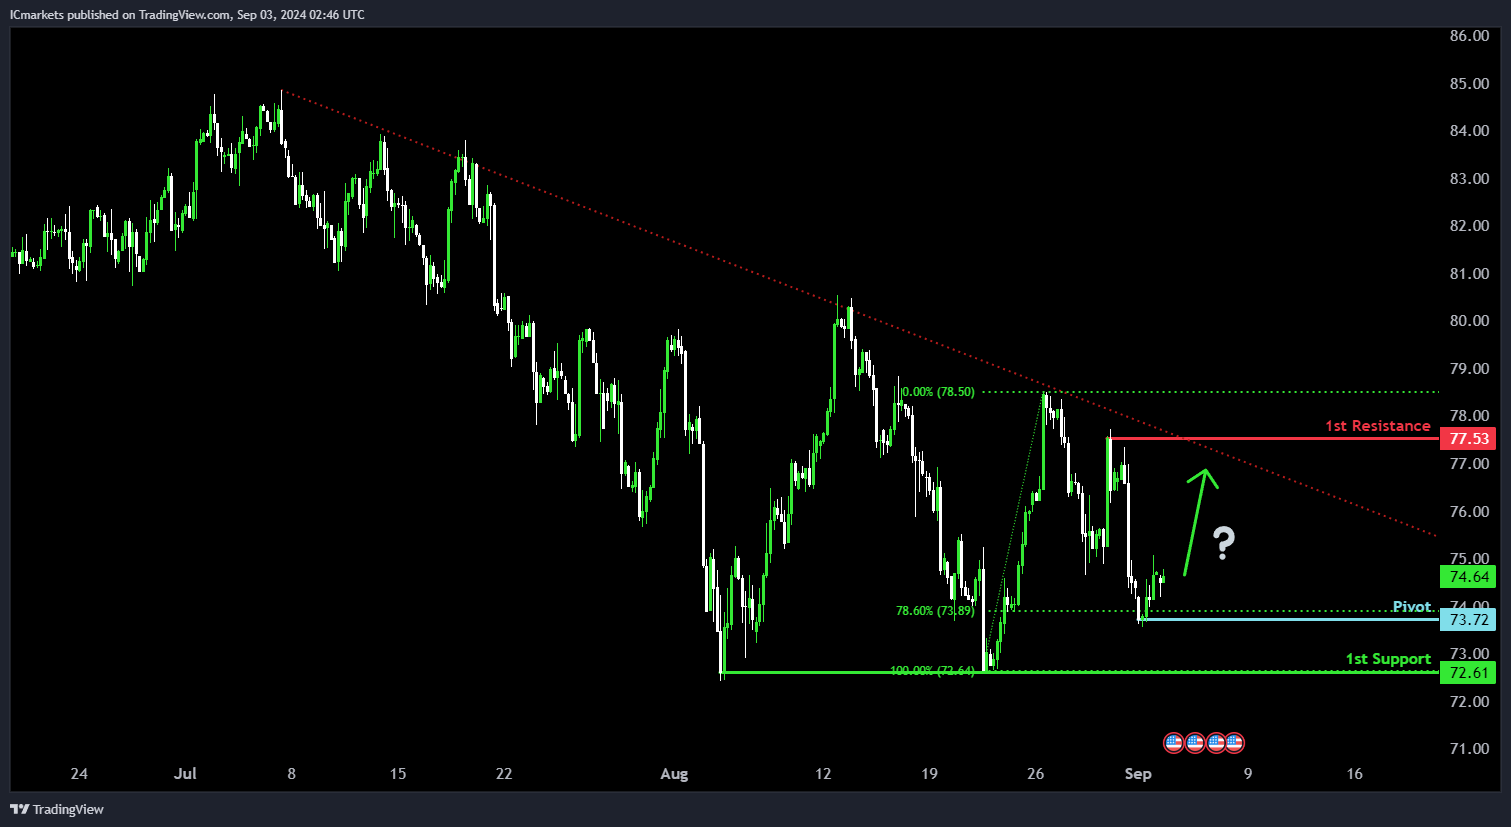
WTI/USD (Oil):
Potential Direction: Bullish
Overall Momentum of the Chart: Bearish
Price could fall towards the pivot and potentially make a bullish bounce off this level to rise towards the 1st resistance.
Pivot: 73.72
Supporting Reasons: Identified as a pullback support that aligns close to a 78.6% Fibonacci retracement, suggesting a potential area where buying interests could pick up to stall the decline.
1st Support: 72.61
Supporting Reasons: Identified as a multi-swing-low support, indicating a potential area where price has found support in the past.
1st Resistance: 77.53
Supporting Reasons: Identified as a swing-high resistance, indicating a potential barrier that could halt further upward movement.
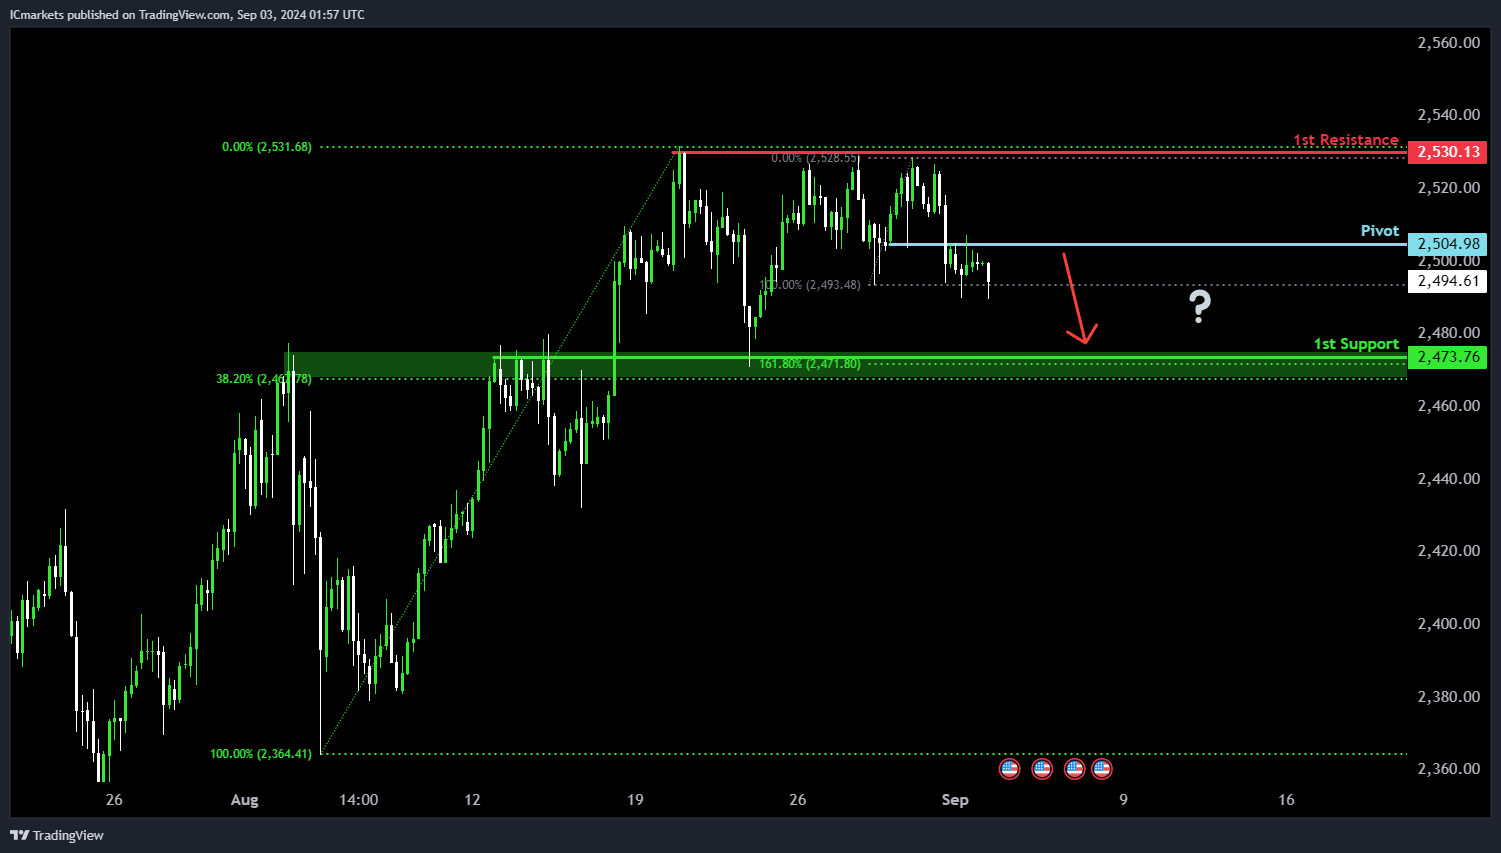
XAU/USD (GOLD):
Potential Direction: Bearish
Overall momentum of the chart: Bearish
Price could potentially make a bearish reaction off the pivot and drop to the 1st support.
Pivot: 2504.98
Supporting reasons: Identified as an overlap resistance level, indicating a potential area where sellers could enter the market.
1st support: 243.76
Supporting reasons: Recognized as overlap support, reinforced by a 38.20% Fibonacci retracement level, suggesting a significant area where previous declines have found support.
1st resistance: 2530.13
Supporting reasons: Marked as multi-swing high resistance, highlighting a historical point where previous rallies have faced selling pressure or reversed.
The accuracy, completeness and timeliness of the information contained on this site cannot be guaranteed. IC Trading does not warranty, guarantee or make any representations, or assume any liability regarding financial results based on the use of the information in the site.
News, views, opinions, recommendations and other information obtained from sources outside of www.ictrading.com, used in this site are believed to be reliable, but we cannot guarantee their accuracy or completeness. All such information is subject to change at any time without notice. IC Trading assumes no responsibility for the content of any linked site.
The fact that such links may exist does not indicate approval or endorsement of any material contained on any linked site. IC Trading is not liable for any harm caused by the transmission, through accessing the services or information on this site, of a computer virus, or other computer code or programming device that might be used to access, delete, damage, disable, disrupt or otherwise impede in any manner, the operation of the site or of any user’s software, hardware, data or property.