
DXY (US Dollar Index):
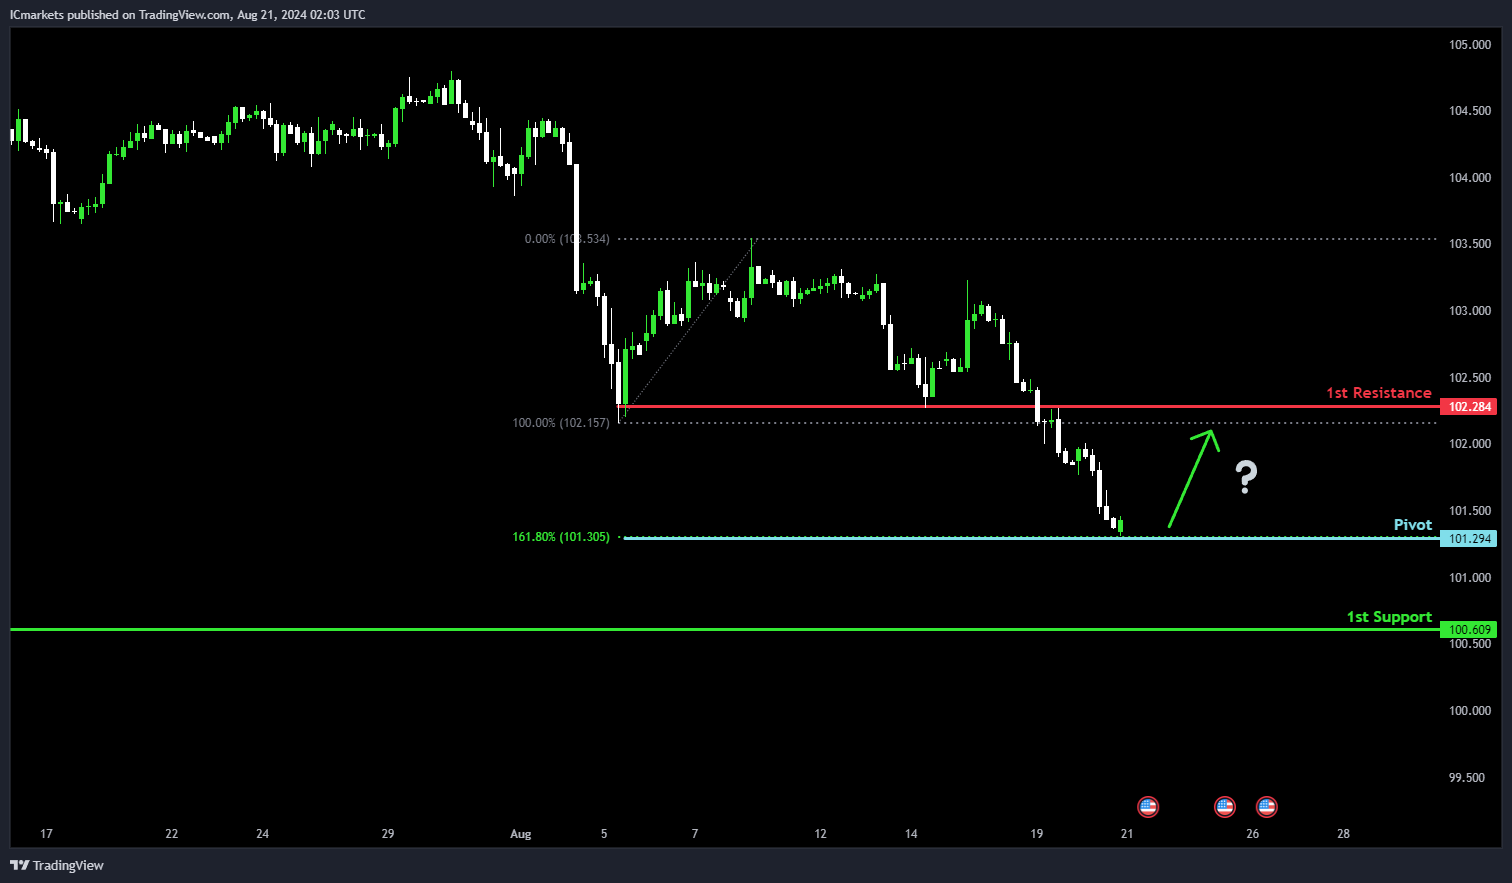
Potential Direction: Bullish
Overall momentum of the chart: Bearish
Price could potentially make a bullish bounce off the pivot and head towards the 1st resistance.
Pivot: 101.29
Supporting reasons: Supported by the 161.80% Fibonacci Extension, suggesting a potential reversal point where buying pressure could increase.
1st support: 100.60
Supporting reasons: Identified as swing low support, indicating a previous level where the price found support and may do so again.
1st resistance: 102.28
Supporting reasons: Identified as an overlap resistance, indicating a level where the price has previously encountered selling pressure.
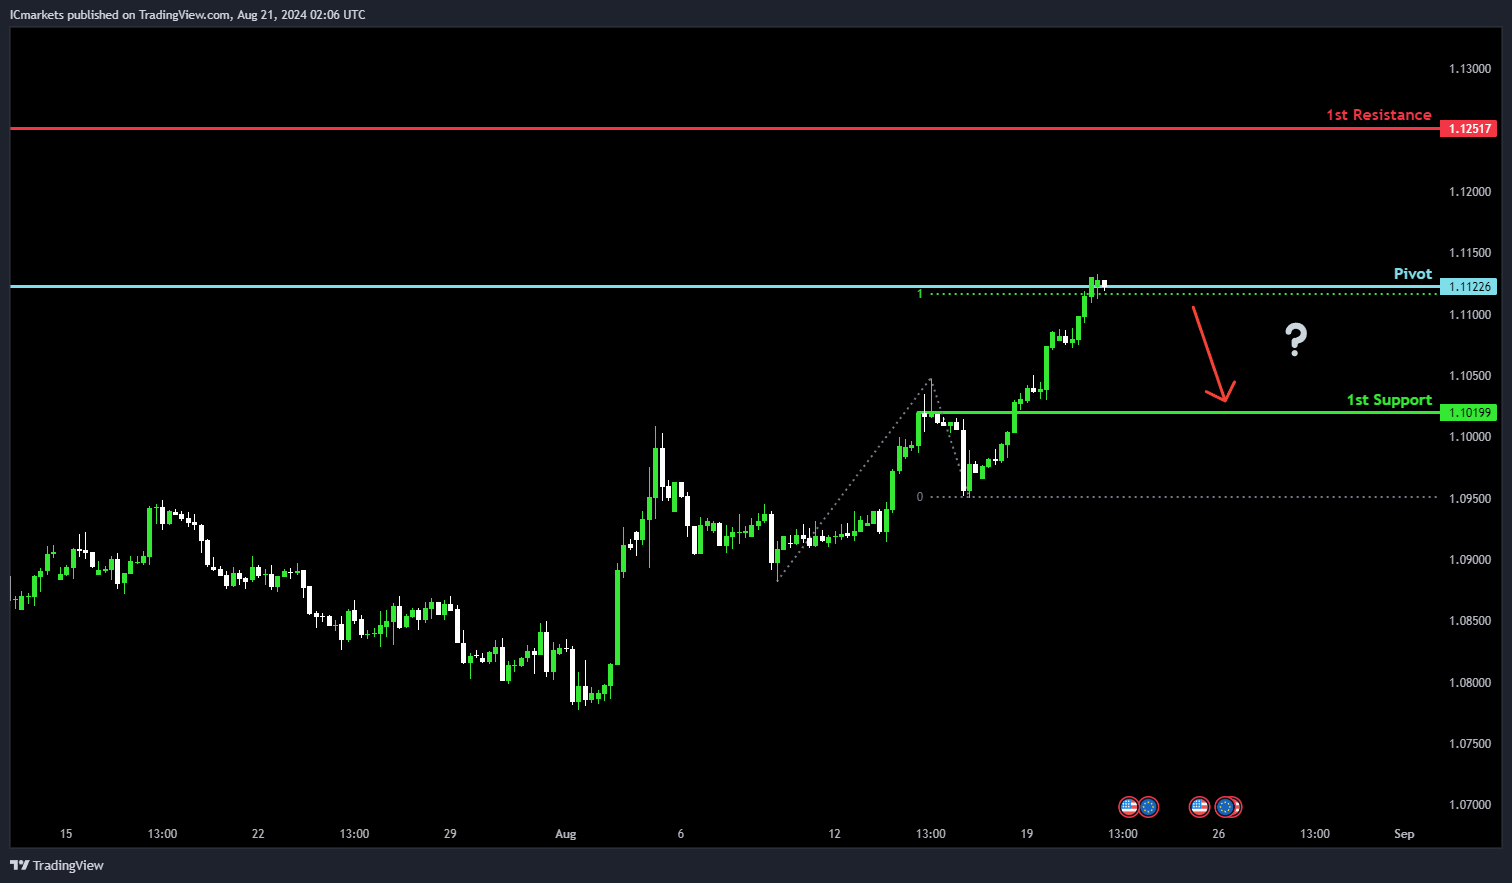
EUR/USD:
Potential Direction: Bearish
Overall momentum of the chart: Bullish
Price could potentially make a bearish reaction off the pivot and drop to the 1st support.
Pivot: 1.1122
Supporting reasons: Identified as swing high resistance and 100% Fibonacci Projection, indicating a level where selling pressure may increase.
1st support: 1.1019
Supporting reasons: Identified as an overlap support, suggesting a previous level where the price found support and may do so again.
1st resistance: 1.1251
Supporting reasons: Identified as swing high resistance, indicating a level where the price has previously encountered selling pressure.
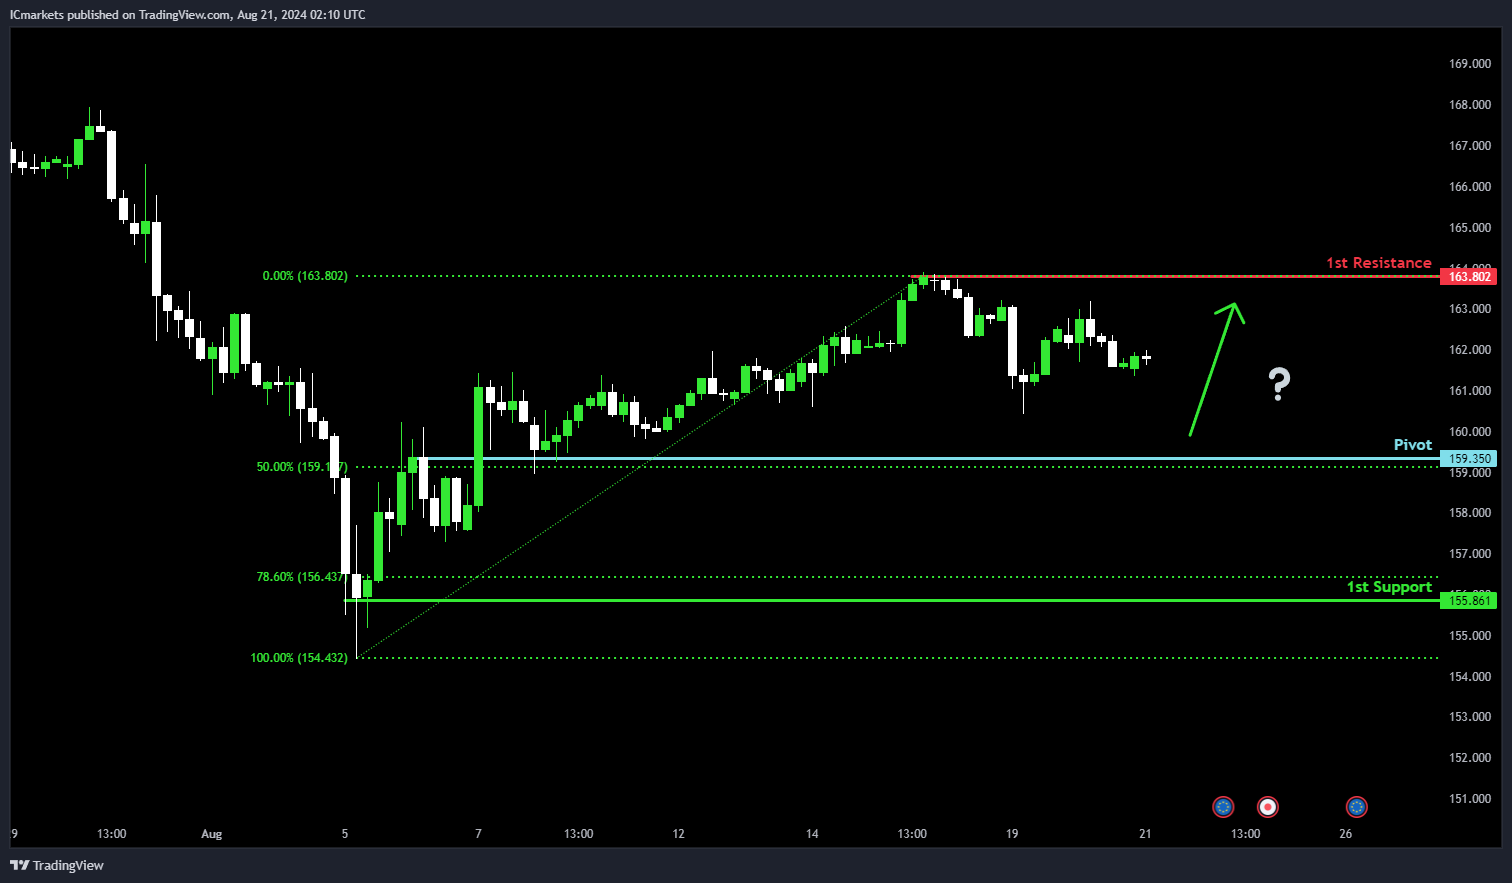
EUR/JPY:
Potential Direction: Bullish
Overall momentum of the chart: Bullish
Price could potentially make a bullish bounce off the pivot and head towards the 1st resistance.
Pivot: 159.35
Supporting reasons: Identified as an overlap support and 50% Fibonacci Retracement, indicating a potential level where buyers may enter the market.
1st support: 155.86
Supporting reasons: Identified as swing low support and 78.60% Fibonacci Retracement, suggesting a significant area where previous declines have found support.
1st resistance: 163.80
Supporting reasons: Identified as multi-swing high resistance, indicating a historical point where previous rallies have faced selling pressure or reversed.
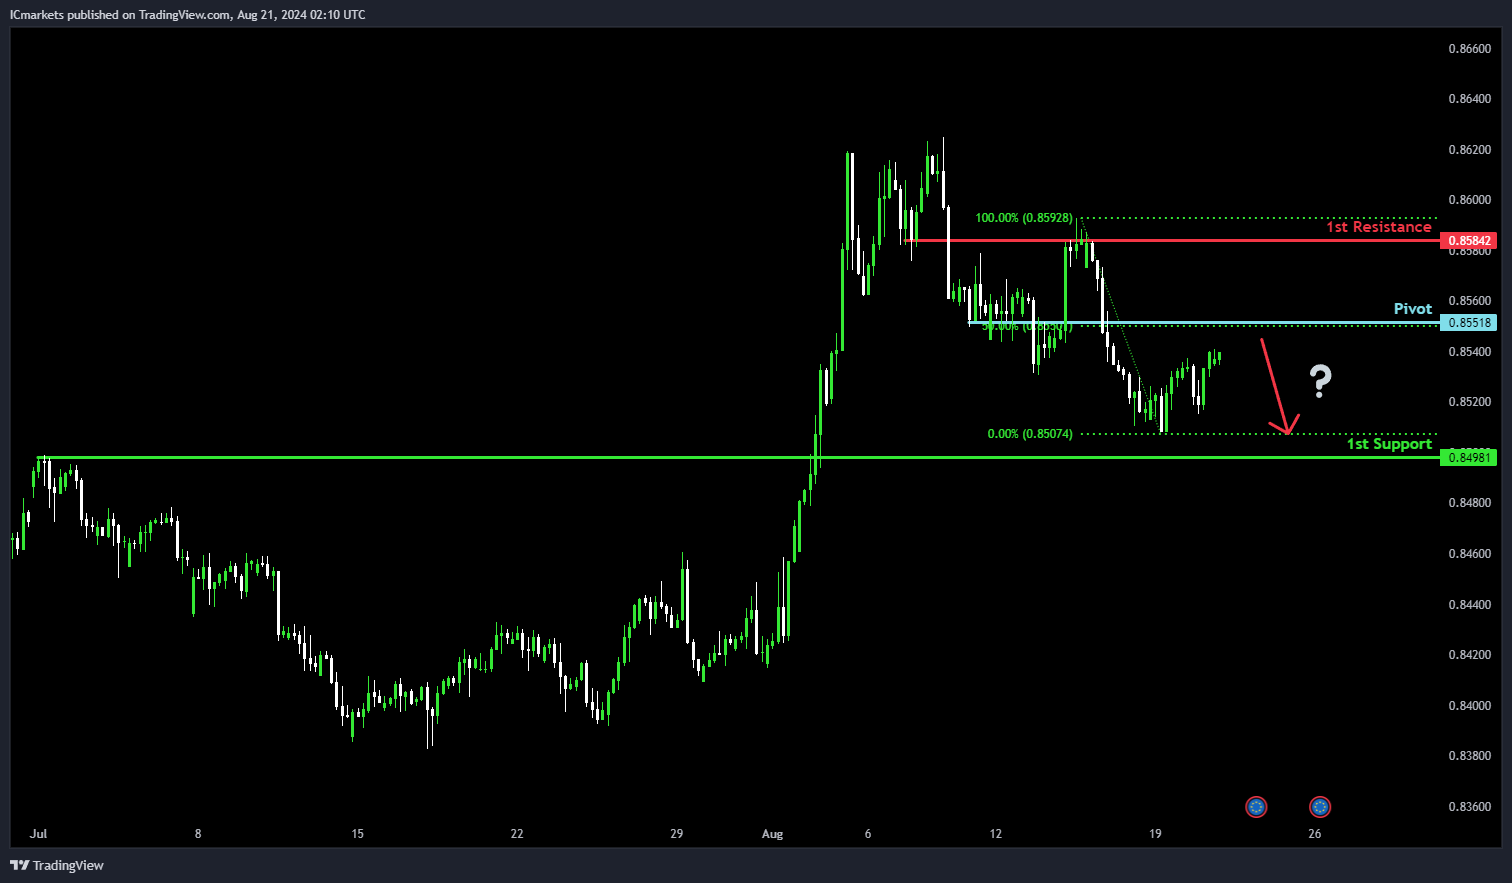
EUR/GBP:
Potential Direction: Bearish
Overall momentum of the chart: Bearish
Price could potentially make a bearish reaction off the pivot and drop to the 1st support.
Pivot: 0.8551
Supporting reasons: Identified as pullback resistance and 50% Fibonacci Retracement, indicating a level where selling pressure might emerge.
1st support: 0.8498
Supporting reasons: Identified as pullback support, suggesting an area where the price could find support after a decline.
1st resistance: 0.8584
Supporting reasons: Identified as an overlap resistance, marking a historical point where the price has previously reversed or encountered selling pressure.
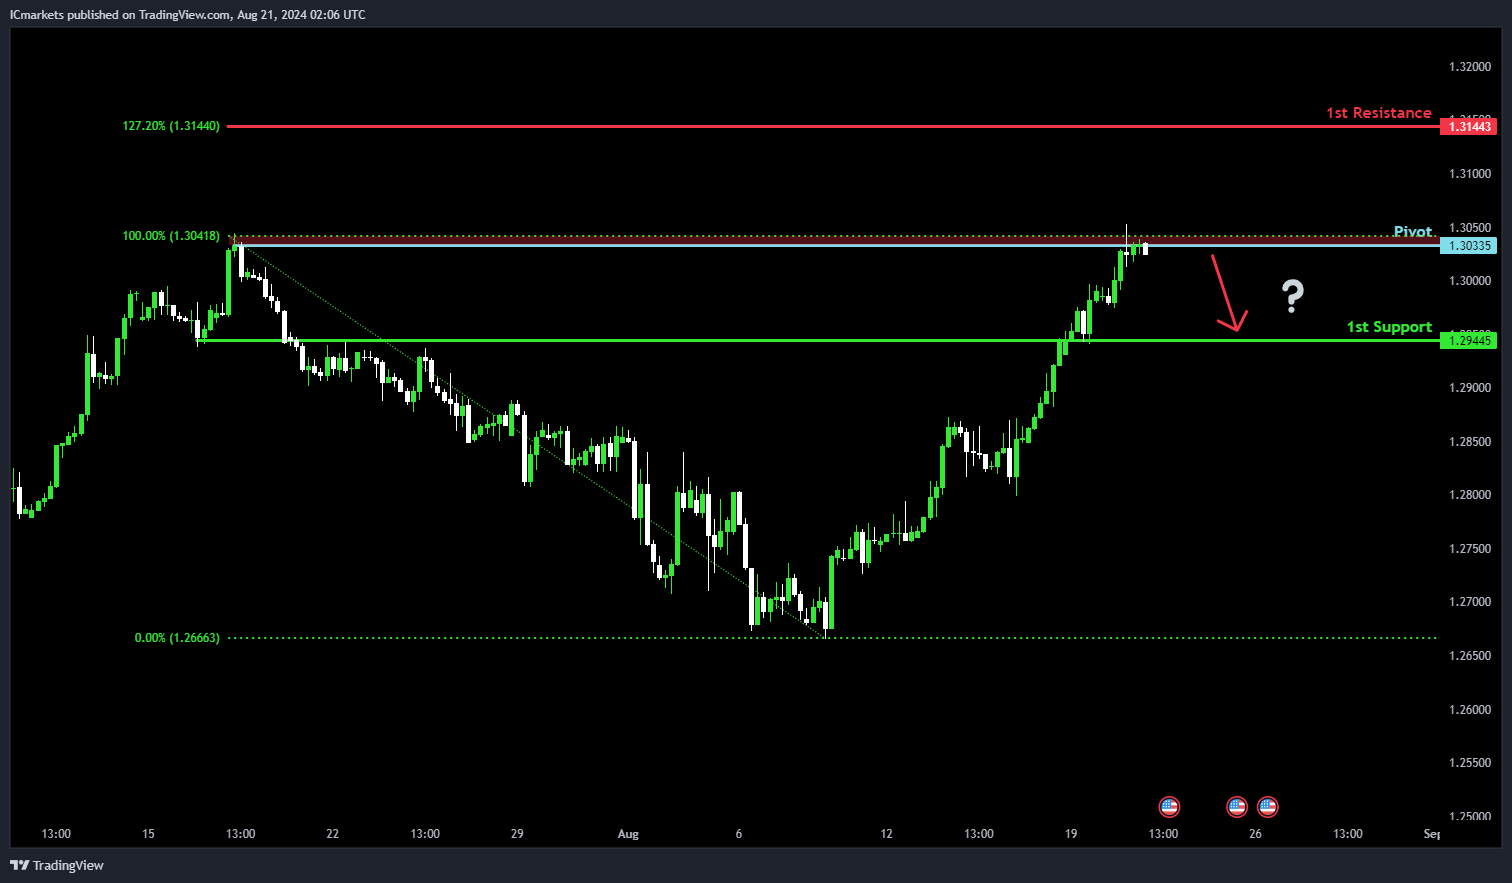
GBP/USD:
Potential Direction: Bearish
Overall momentum of the chart: Bullish
Price could potentially make a bearish reaction off the pivot and drop to the 1st support.
Pivot: 1.3033
Supporting reasons: Identified as swing high resistance, indicating a level where the price has previously faced selling pressure.
1st support: 1.2944
Supporting reasons: Identified as an overlap support, suggesting an area where the price might find support after a decline.
1st resistance: 1.3144
Supporting reasons: Identified as a level influenced by the 127.20% Fibonacci Extension, indicating potential resistance where the price might encounter selling pressure.
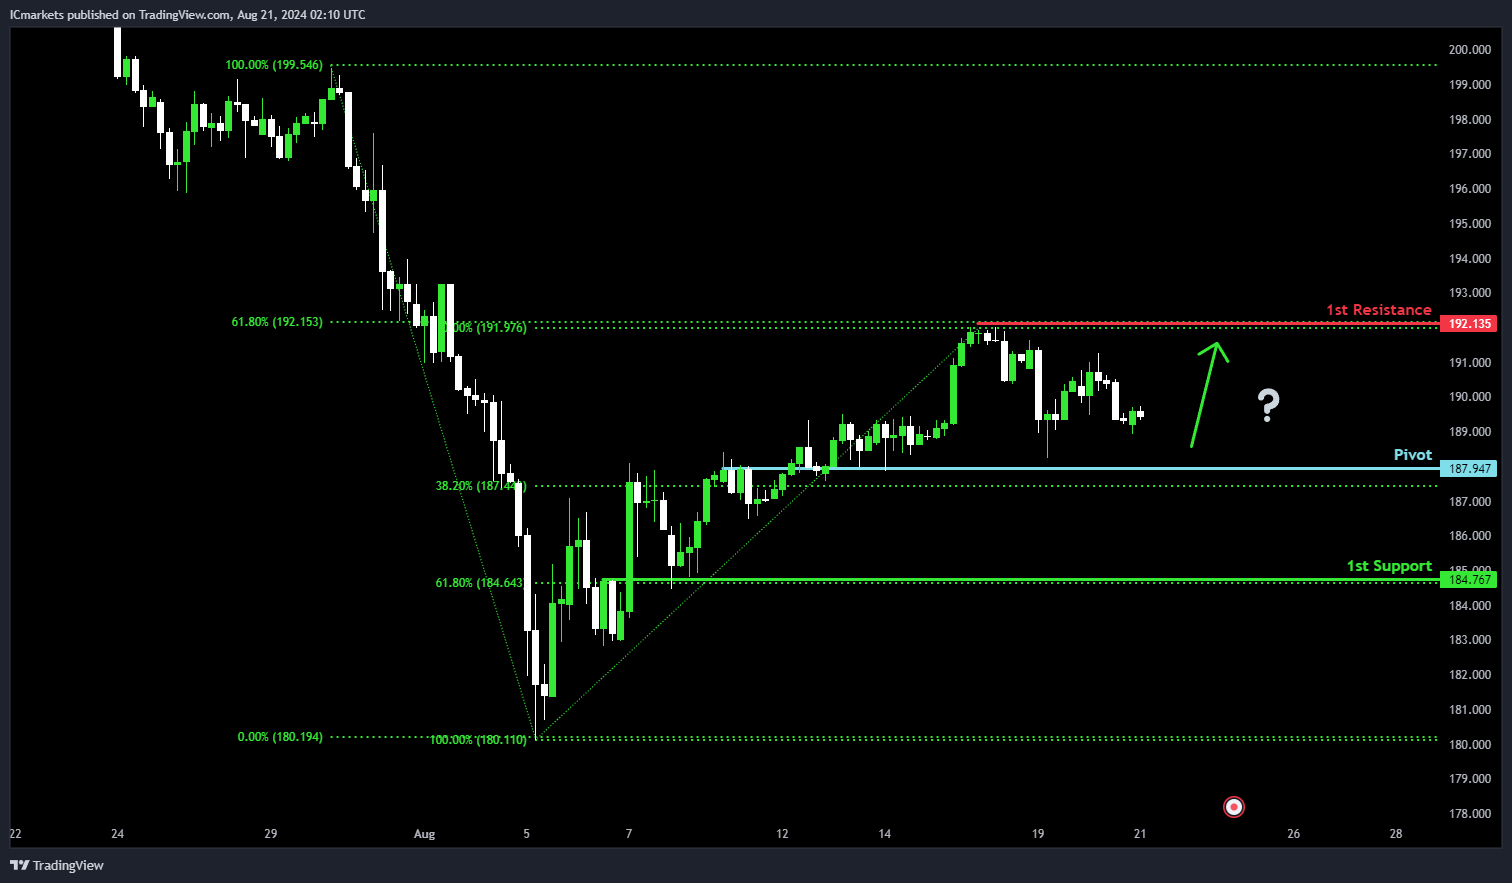
GBP/JPY:
Potential Direction: Bullish
Overall momentum of the chart: Bullish
Price could potentially make a bullish bounce off the pivot and head towards the 1st resistance.
Pivot: 187.94
Supporting reasons: Identified as an overlap resistance, combined with the 38.20% Fibonacci Retracement, indicating a level where the price might find support and potentially continue upward.
1st support: 184.76
Supporting reasons: Identified as an overlap support, reinforced by the 61.80% Fibonacci Retracement, suggesting a strong area where the price might find support after a decline.
1st resistance: 192.13
Supporting reasons: Identified as a multi-swing high resistance, coupled with the 61.80% Fibonacci Retracement, indicating a level where the price might encounter selling pressure.
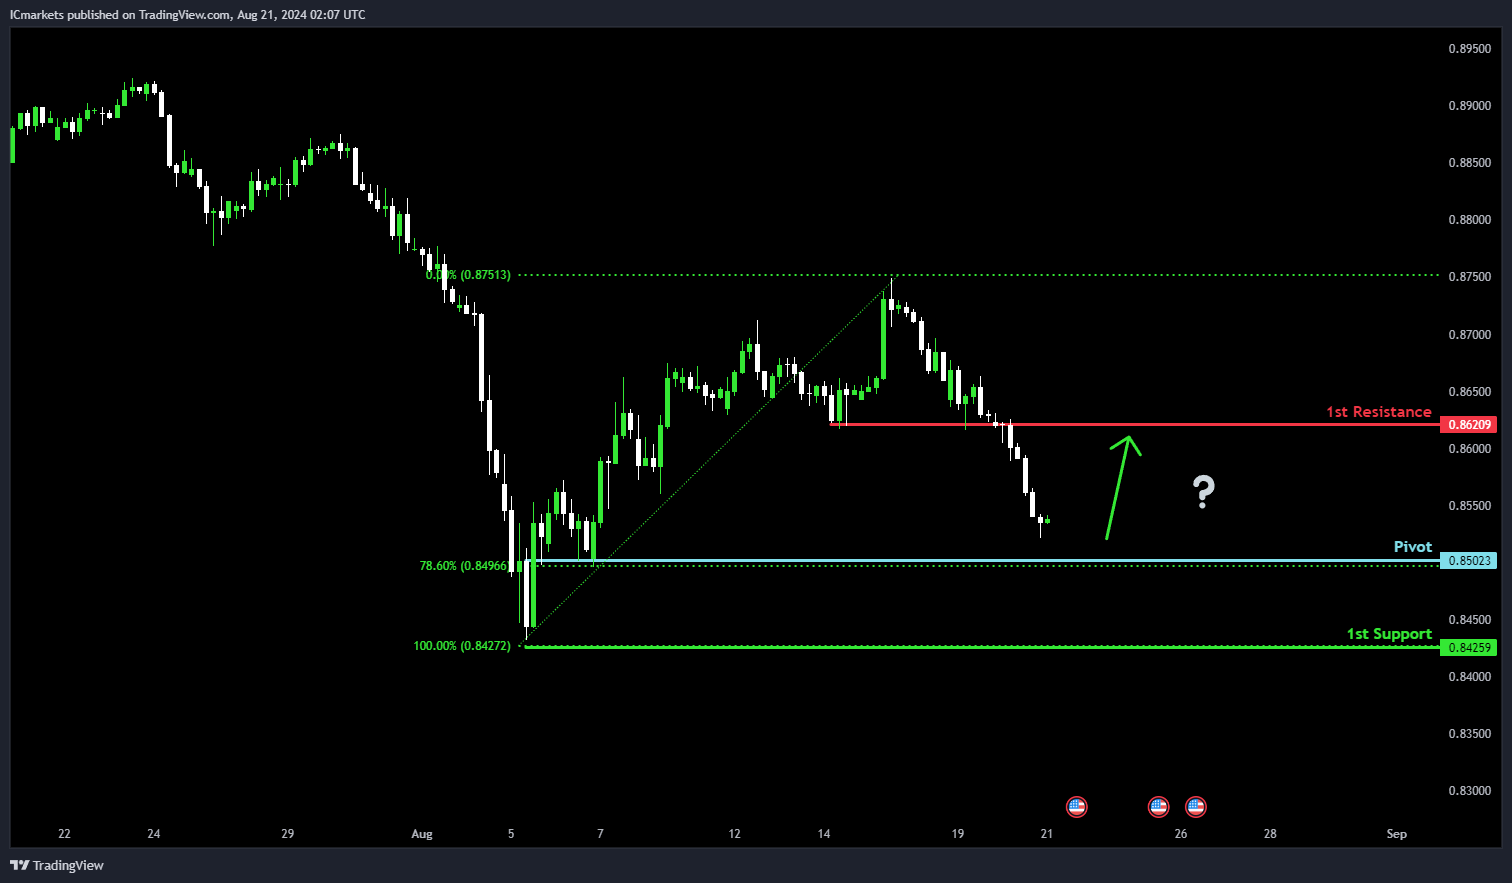
USD/CHF:
Potential Direction: Bearish
Overall momentum of the chart: Bearish
Price could potentially make a bullish bounce off the pivot and head towards the 1st resistance.
Pivot: 0.8502
Supporting reasons: Identified as an overlap support, reinforced by the 78.60% Fibonacci Retracement, indicating a potential level where the price might find support and initiate an upward move.
1st support: 0.8425
Supporting reasons: Identified as a swing low support, suggesting a significant level where the price might stabilize after a decline.
1st resistance: 0.8620
Supporting reasons: Identified as a pullback resistance, indicating a level where the price might encounter resistance after an upward correction.
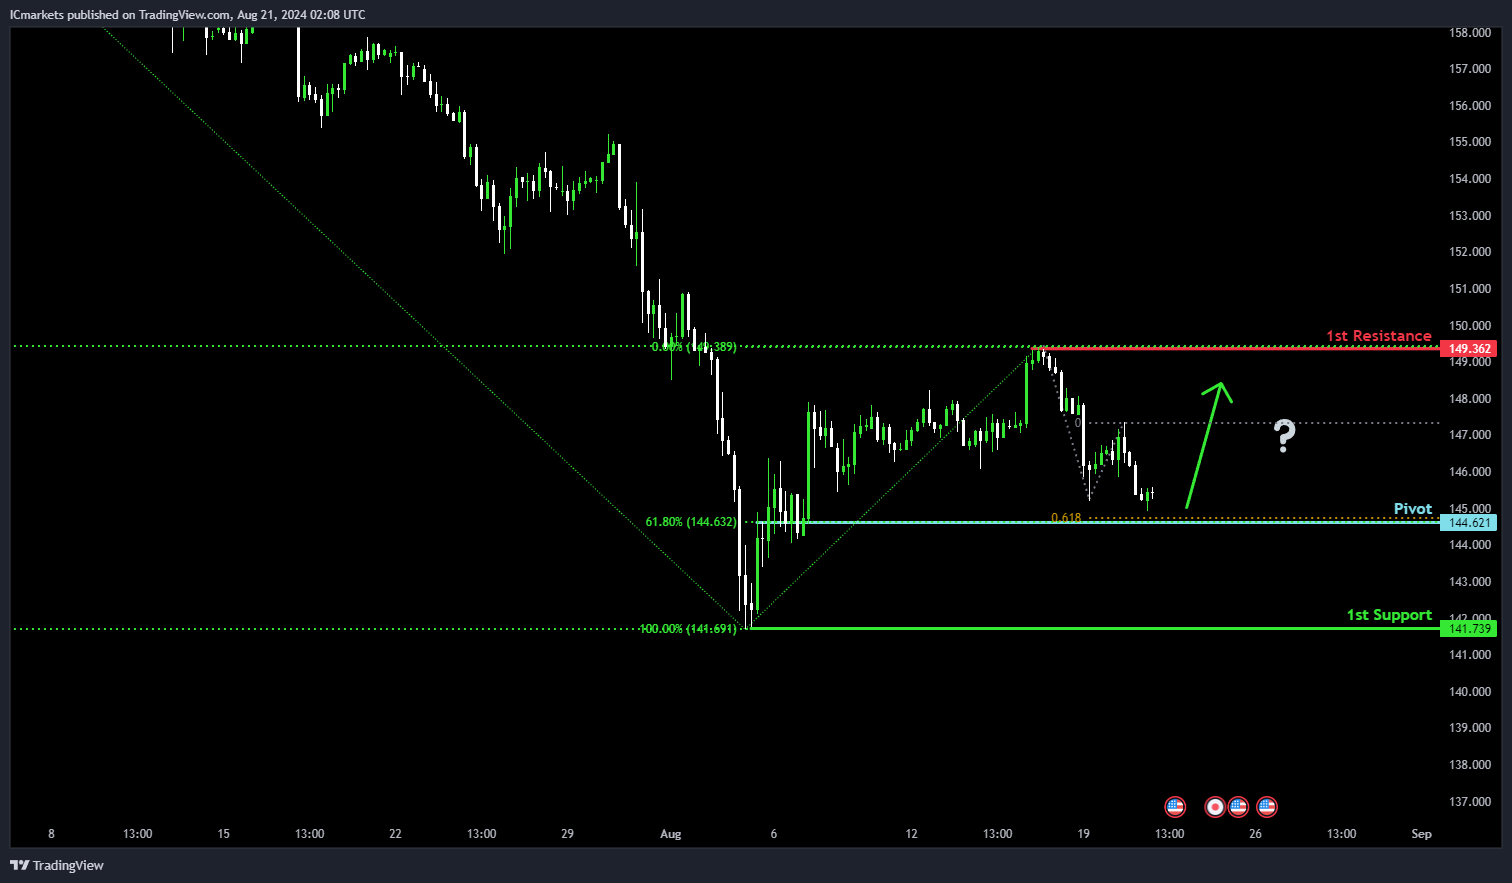
USD/JPY:
Potential Direction: Bullish
Overall momentum of the chart: Bullish
Price could potentially make a bullish bounce off the pivot and head towards the 1st resistance.
Pivot: 144.62
Supporting reasons: Identified as pullback support, reinforced by the 61.80% Fibonacci Retracement and 100% Fibonacci Projection, indicating a confluence that strengthens this level as a potential area for a bullish reversal.
1st support: 141.73
Supporting reasons: Identified as a swing low support, suggesting a key level where the price might find strong buying interest.
1st resistance: 149.36
Supporting reasons: Identified as swing high resistance, indicating a significant level where the price might encounter selling pressure.
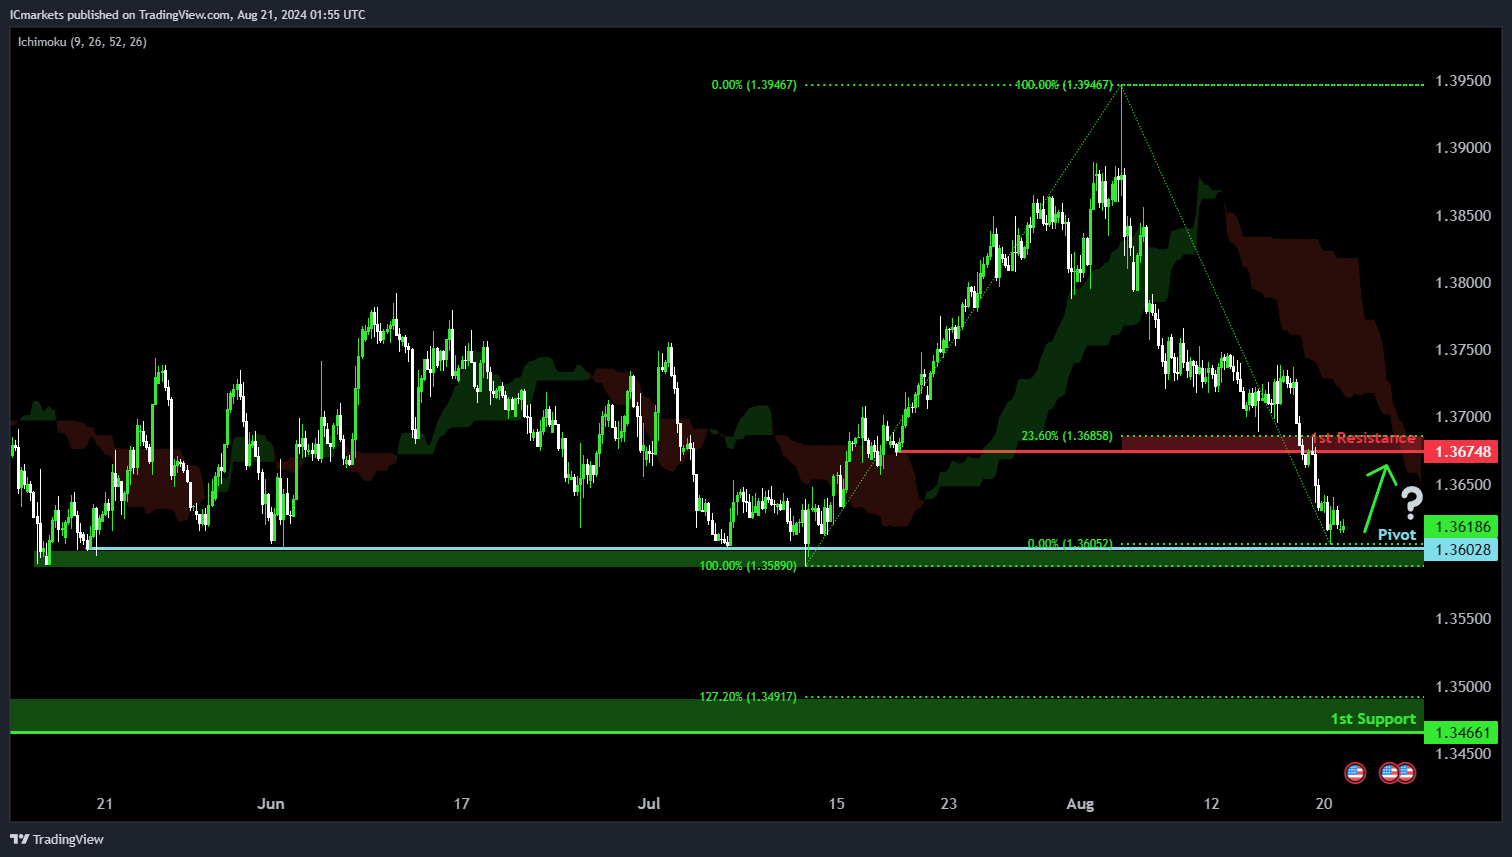
USD/CAD:
Potential Direction: Bullish
Overall momentum of the chart: Bearish
Price is falling towards the pivot and could potentially make a bullish bounce off this level to rise towards the 1st resistance.
Pivot: 1.3602
Supporting reasons: Identified as a pullback support, indicating a potential area where buying interests could pick up to stage a minor rebound.
1st support: 1.3466
Supporting reasons: Identified as a pullback support that aligns close to a 127.2% Fibonacci extension level, indicating a potential area where price could find strong support.
1st resistance: 1.3674
Supporting reasons: Identified as an overlap resistance that aligns close to a 23.6% Fibonacci retracement level, indicating a potential area that could halt any further upward movement. The presence of the bearish Ichimoku Clouds adds further significance to the strength of this resistance zone.
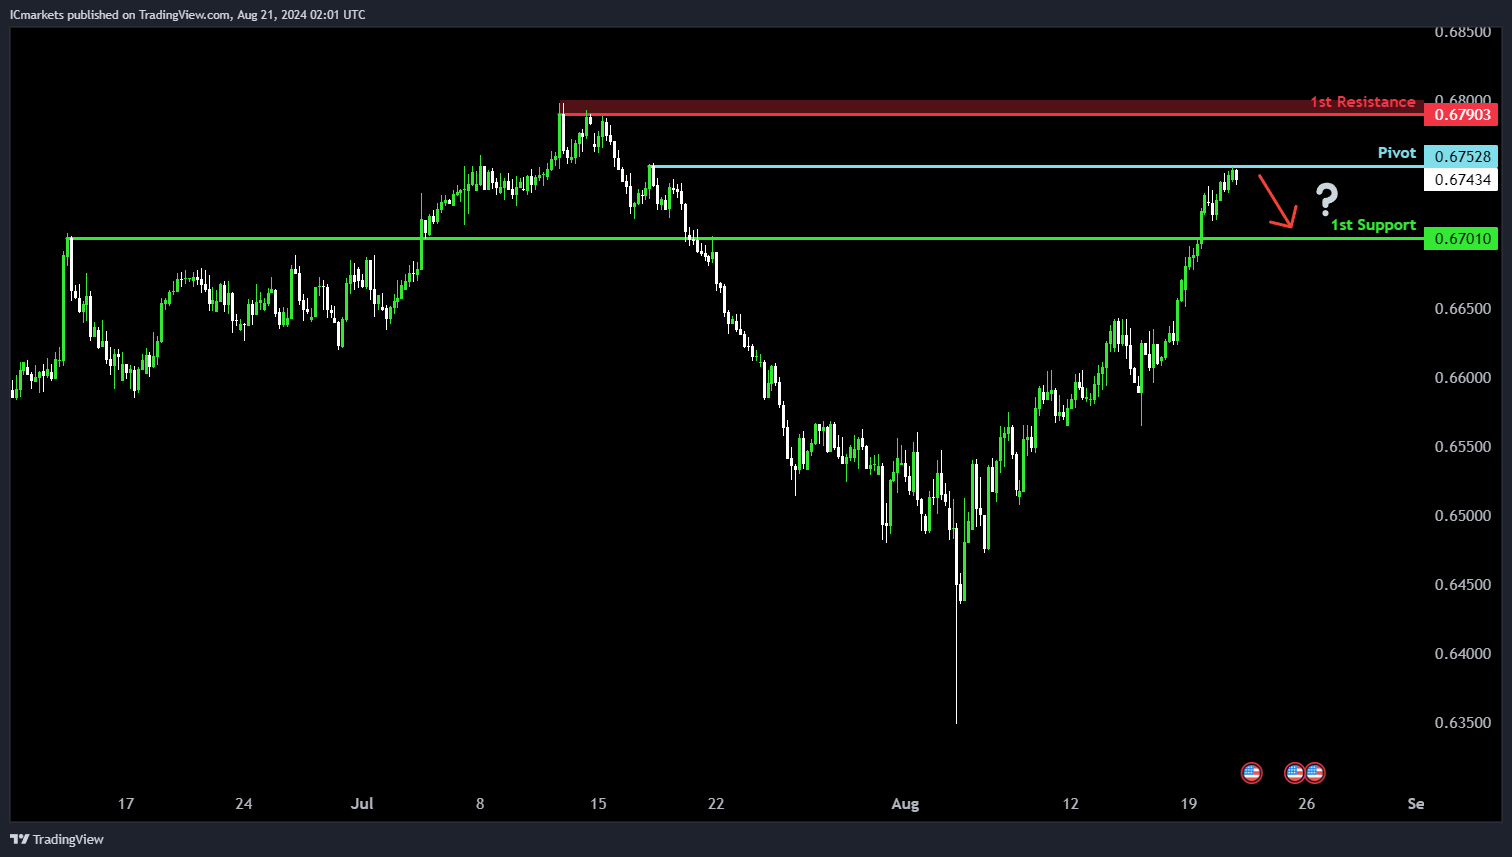
AUD/USD:
Potential Direction: Bearish
Overall momentum of the chart: Bullish
Price is trading close to the pivot and could potentially make a bearish reversal off this level to pull back towards the 1st support.
Pivot: 0.6752
Supporting reasons: Identified as a pullback resistance, indicating a potential area where selling pressures could intensify.
1st support: 0.6701
Supporting reasons: Identified as an overlap support, suggesting a potential area where price could find support.
1st resistance: 0.6790
Supporting reasons: Identified as a swing-high resistance, indicating a significant area that could halt further upward movement.
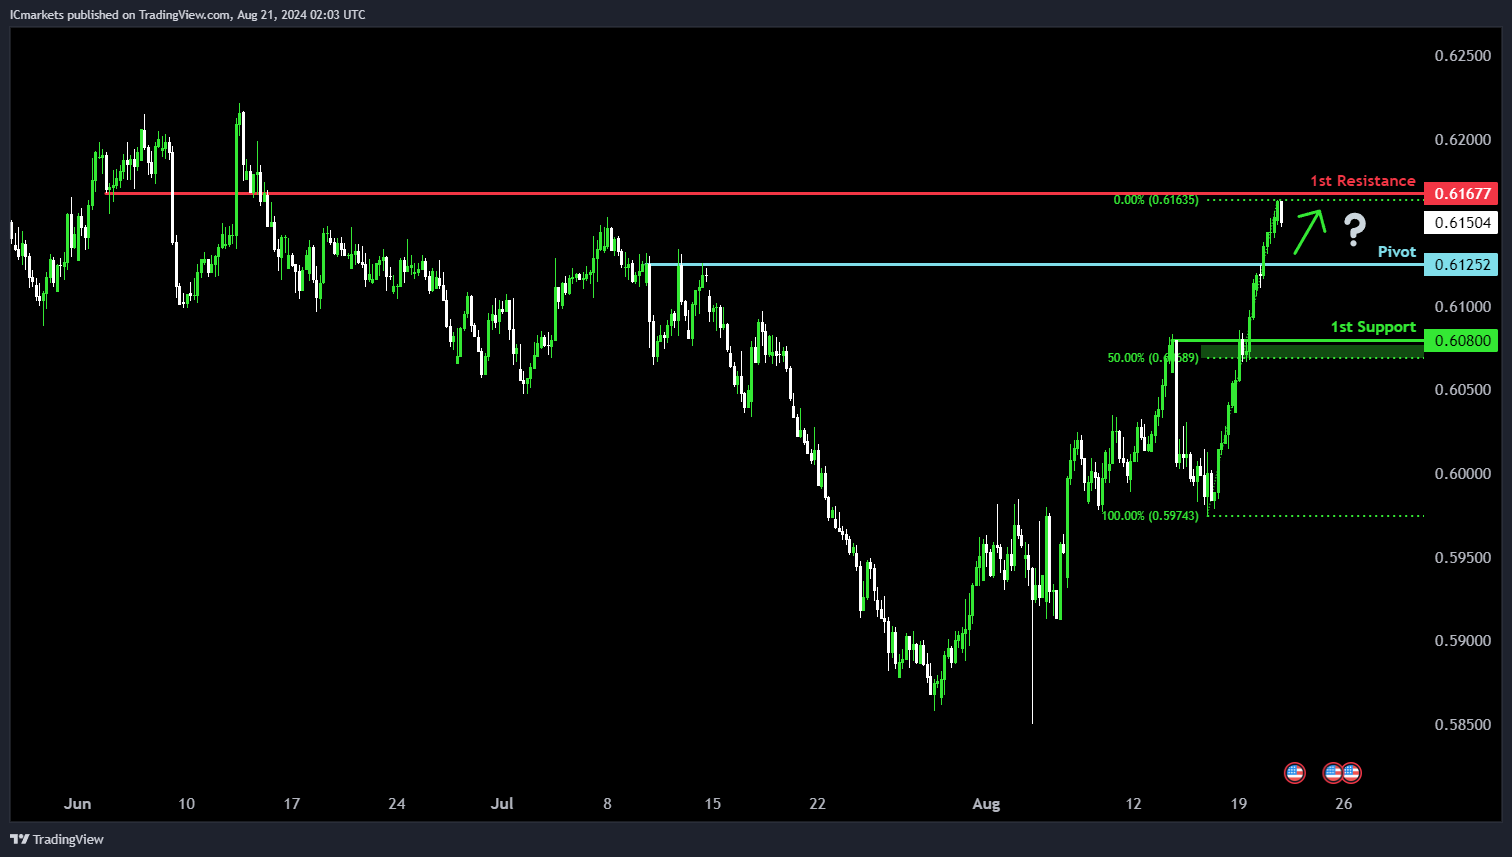
NZD/USD
Potential Direction: Bullish
Overall momentum of the chart: Bullish
Price is falling towards the pivot and could potentially make a bullish bounce off this level to rise towards the 1st resistance.
Pivot: 0.6125
Supporting reasons: Identified as a pullback support, indicating a potential area where buying interests could pick up to resume the uptrend.
1st support: 0.6080
Supporting reasons: Identified as a pullback support that aligns close to a 50% Fibonacci retracement level, suggesting a potential area where price could find strong support.
1st resistance: 0.6167
Supporting reasons: Identified as an overlap resistance, indicating a significant area that could halt further upward movement.
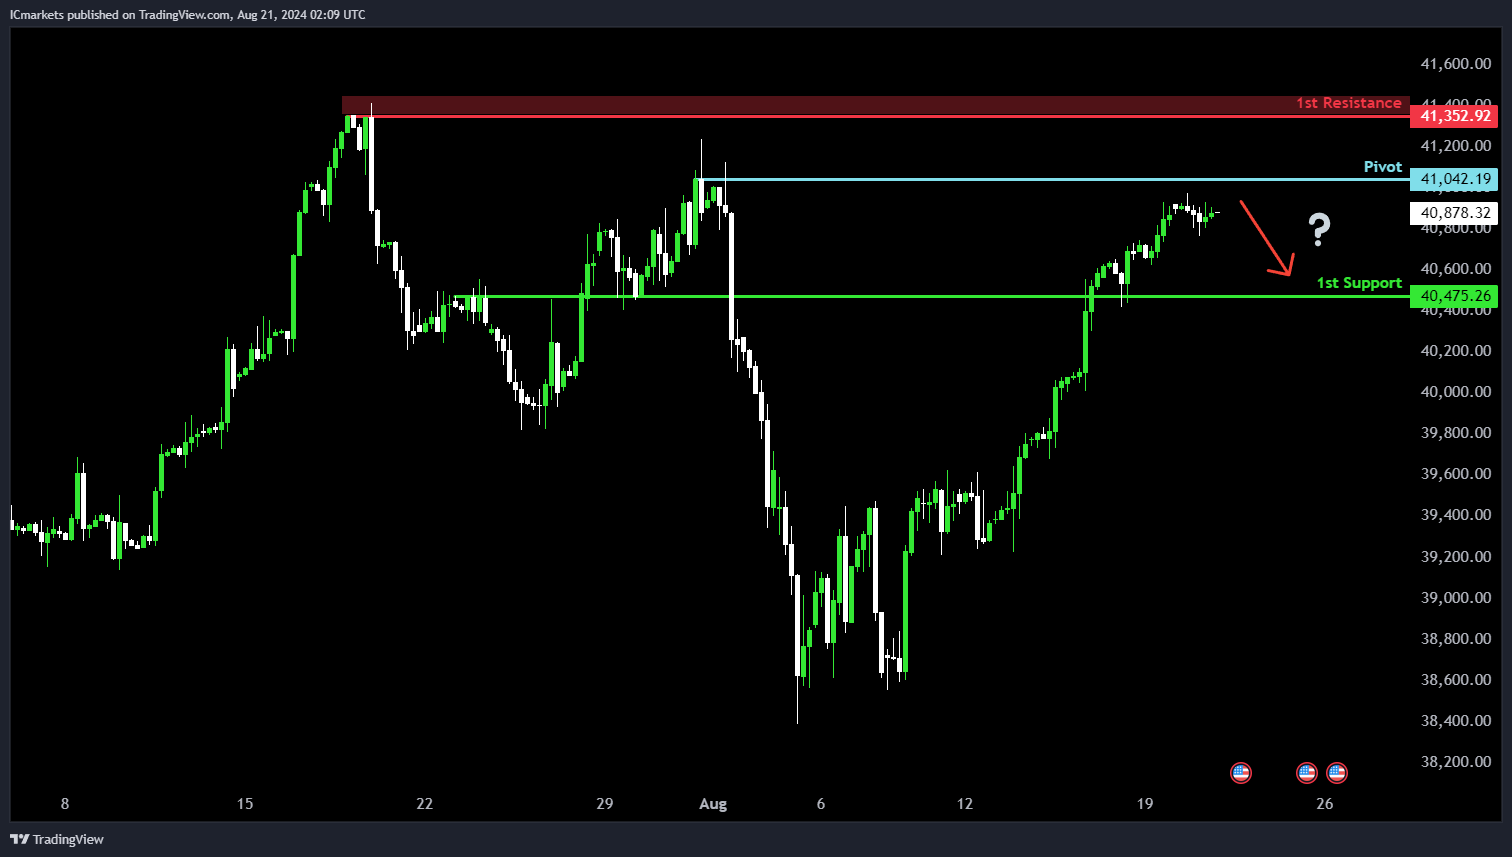
US30 (DJIA):
Potential Direction: Bearish
Overall Momentum of the Chart: Bullish
Price is rising towards the pivot and could potentially make a bearish reversal off this level to pull back towards the 1st support.
Pivot: 41,042.19
Supporting reasons: Identified as a pullback resistance, suggesting a potential area where selling pressures could intensify.
1st Support: 40,475.26
Supporting Reasons: Identified as an overlap support, suggesting a potential area where price could find support.
1st Resistance: 41,352.92
Supporting Reasons: Identified as a swing-high resistance that aligns close to the all-time high, indicating a significant area that could halt further upward movement.
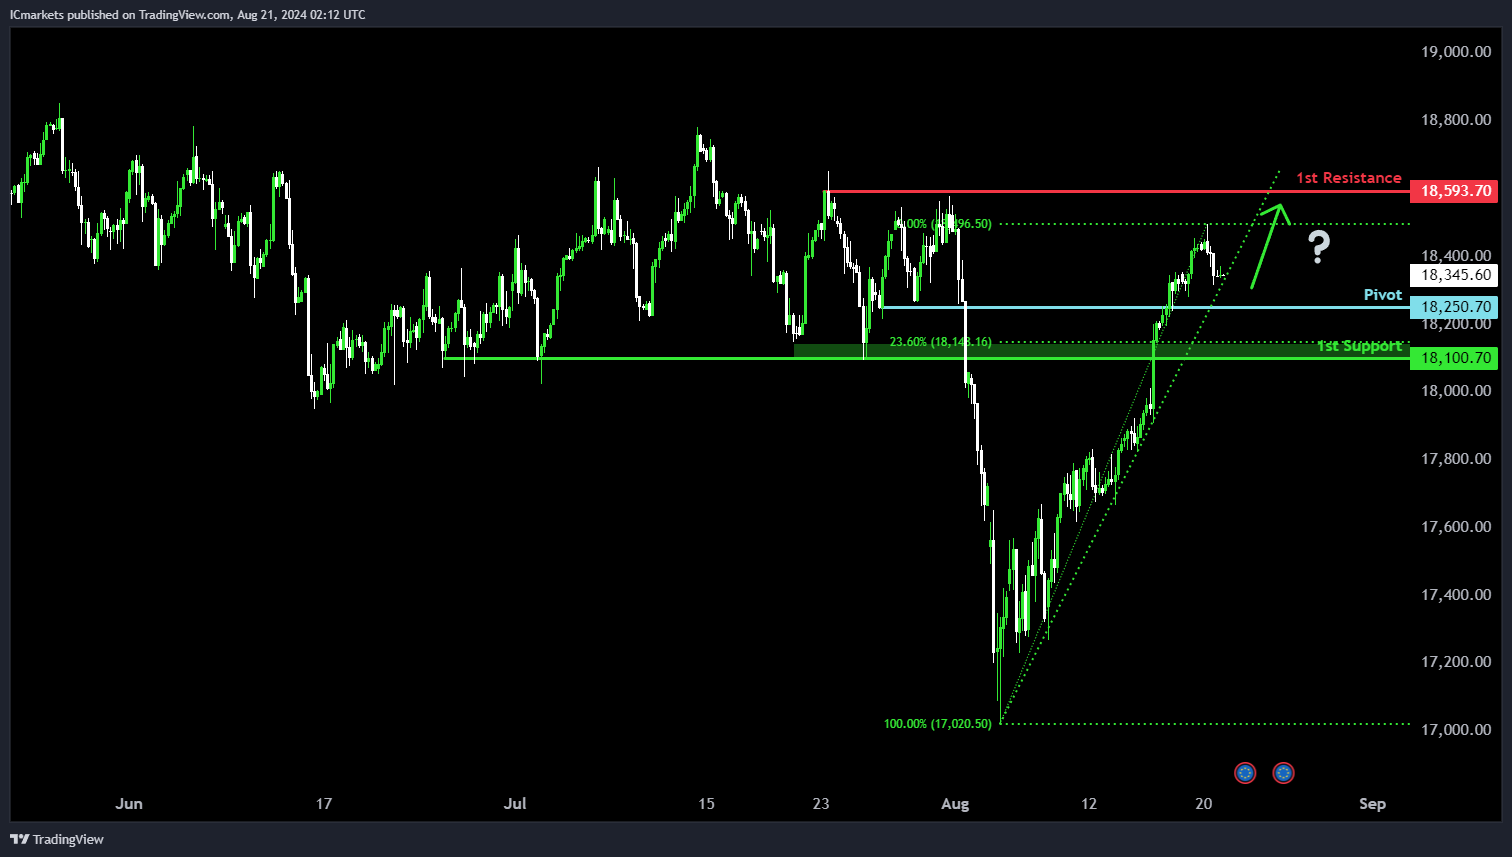
DE40 (DAX):
Potential Direction: Bullish
Overall Momentum of the Chart: Bullish
Price is falling towards the pivot and could potentially make a bullish bounce off this level to rise towards the 1st resistance.
Pivot: 18,250.70
Supporting reasons: Identified as a pullback support, suggesting a potential area where buying interests could pick up to resume the uptrend.
1st Support: 18,100.70
Supporting Reasons: Identified as a pullback support that aligns close to a 23.6% Fibonacci retracement level, indicating a potential area where price could find support.
1st Resistance: 18,593.70
Supporting Reasons: Identified as a pullback resistance, indicating a significant area that could halt further upward movement.
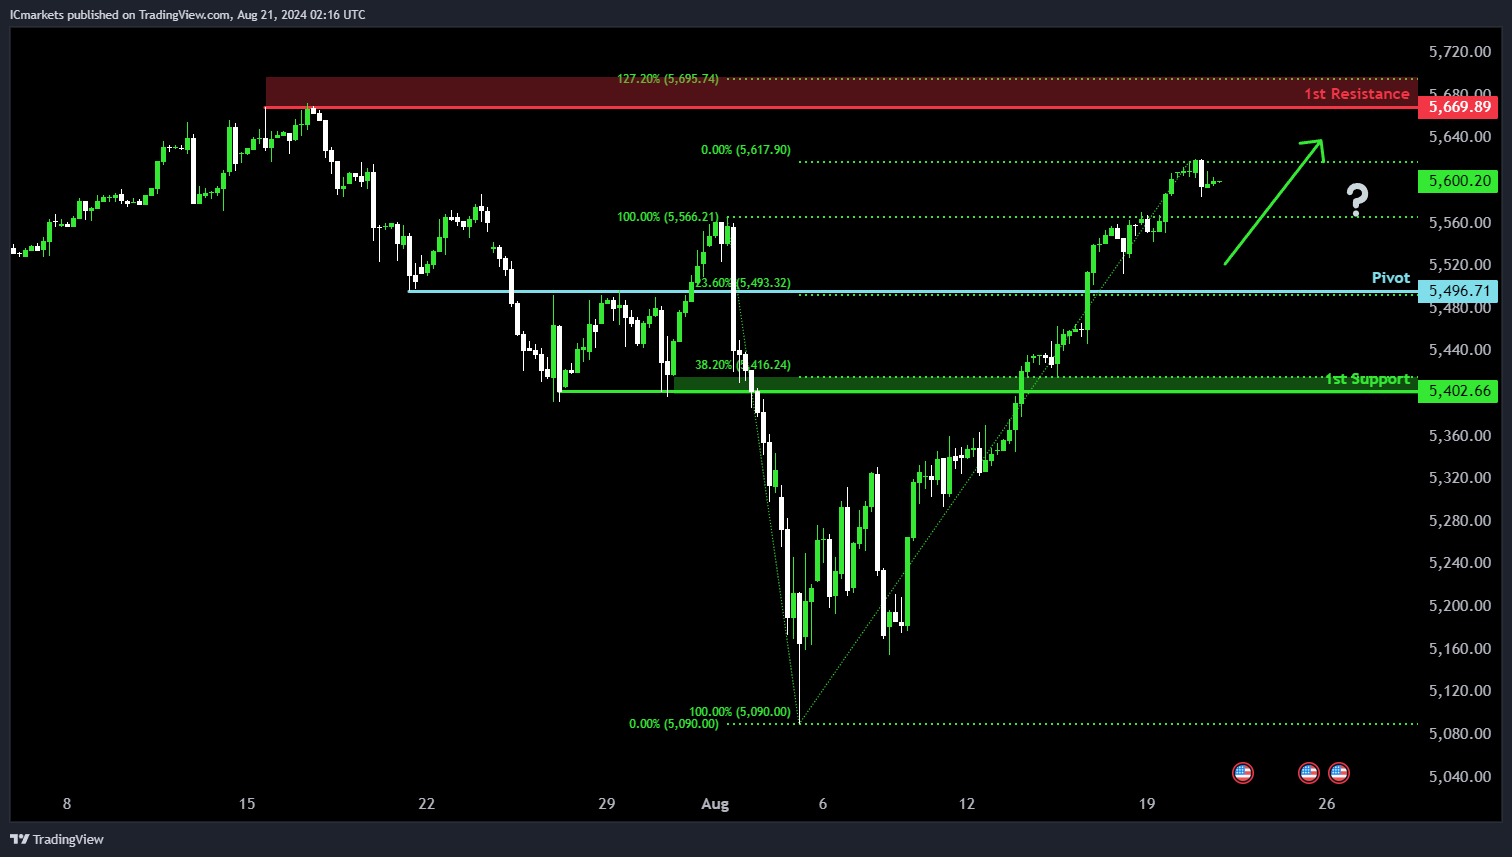
US500 (S&P 500):
Potential Direction: Bullish
Overall Momentum of the Chart: Bullish
Price is falling towards the pivot and could potentially make a bullish bounce off this level to rise towards the 1st resistance.
Pivot: 5,496.71
Supporting reasons: Identified as an overlap support that aligns with a 23.6% Fibonacci retracement level, suggesting a potential area where buying interests could pick up to resume the uptrend.
1st support: 5,402.66
Supporting reasons: Identified as a pullback support that aligns close to a 38.2% Fibonacci retracement level, suggesting a potential area where price could find support.
1st resistance: 5,669.89
Supporting reasons: Identified as a swing-high resistance that aligns close to a 127.2% extension Fibonacci level, suggesting a critical area that could halt further upward movement.
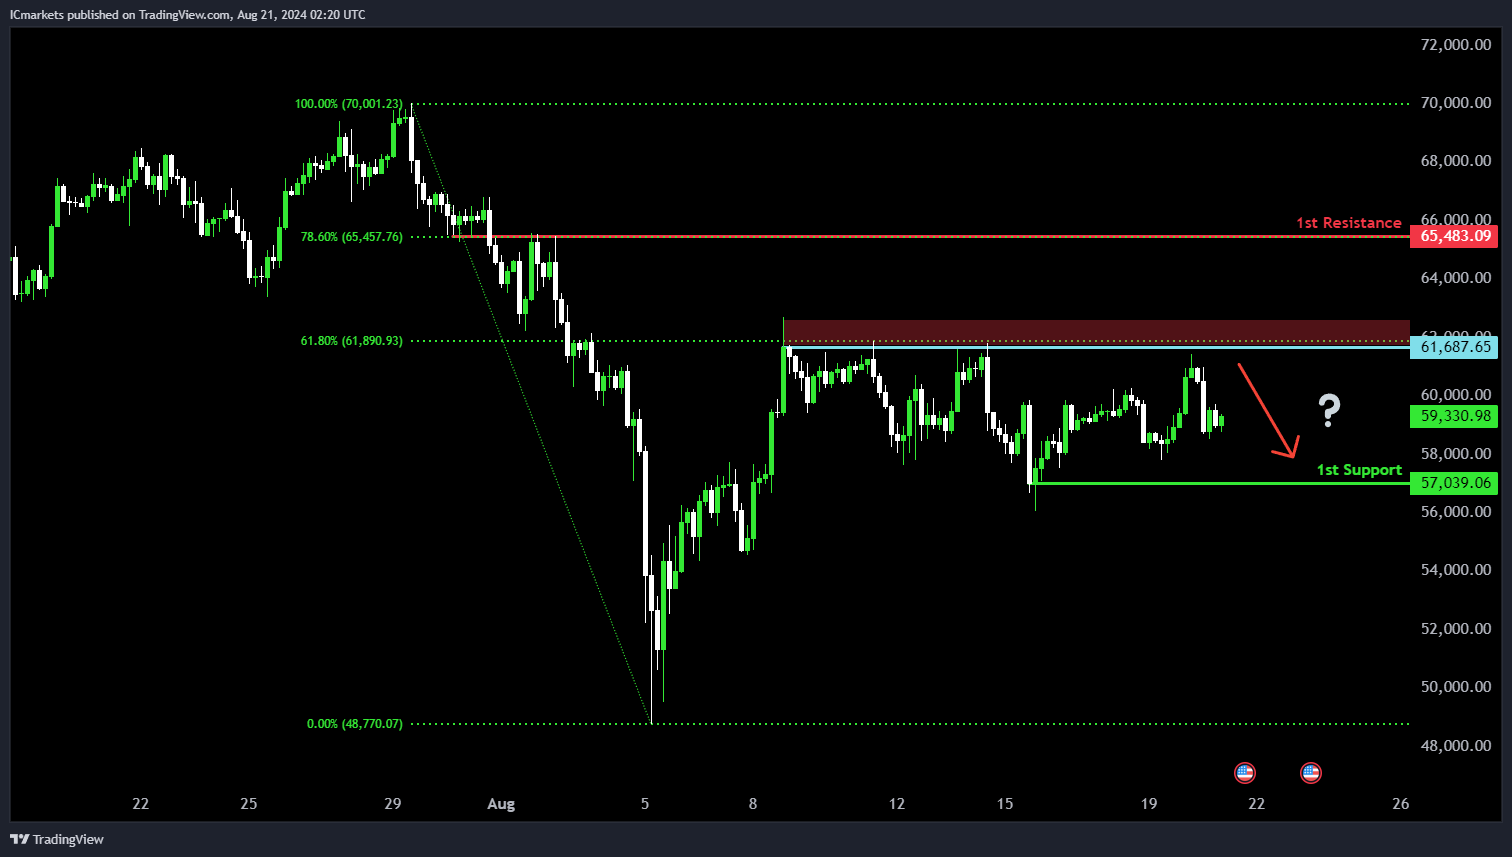
BTC/USD (Bitcoin):
Potential Direction: Bearish
Overall momentum of the chart: Neutral
Price is rising towards the pivot and could potentially make a bearish reversal off this level to fall towards the 1st support.
Pivot: 61,687.65
Supporting reasons: Identified as a pullback resistance that aligns with a 61.8% Fibonacci retracement level, indicating a potential area where selling pressures could intensify.
1st support: 57,039.06
Supporting reasons: Identified as a pullback support, indicating a significant area where price has found support in the past.
1st resistance: 65,483.09
Supporting reasons: Identified as an overlap resistance that aligns with a 78.6% Fibonacci retracement level, indicating a potential barrier that could halt further upward movement.
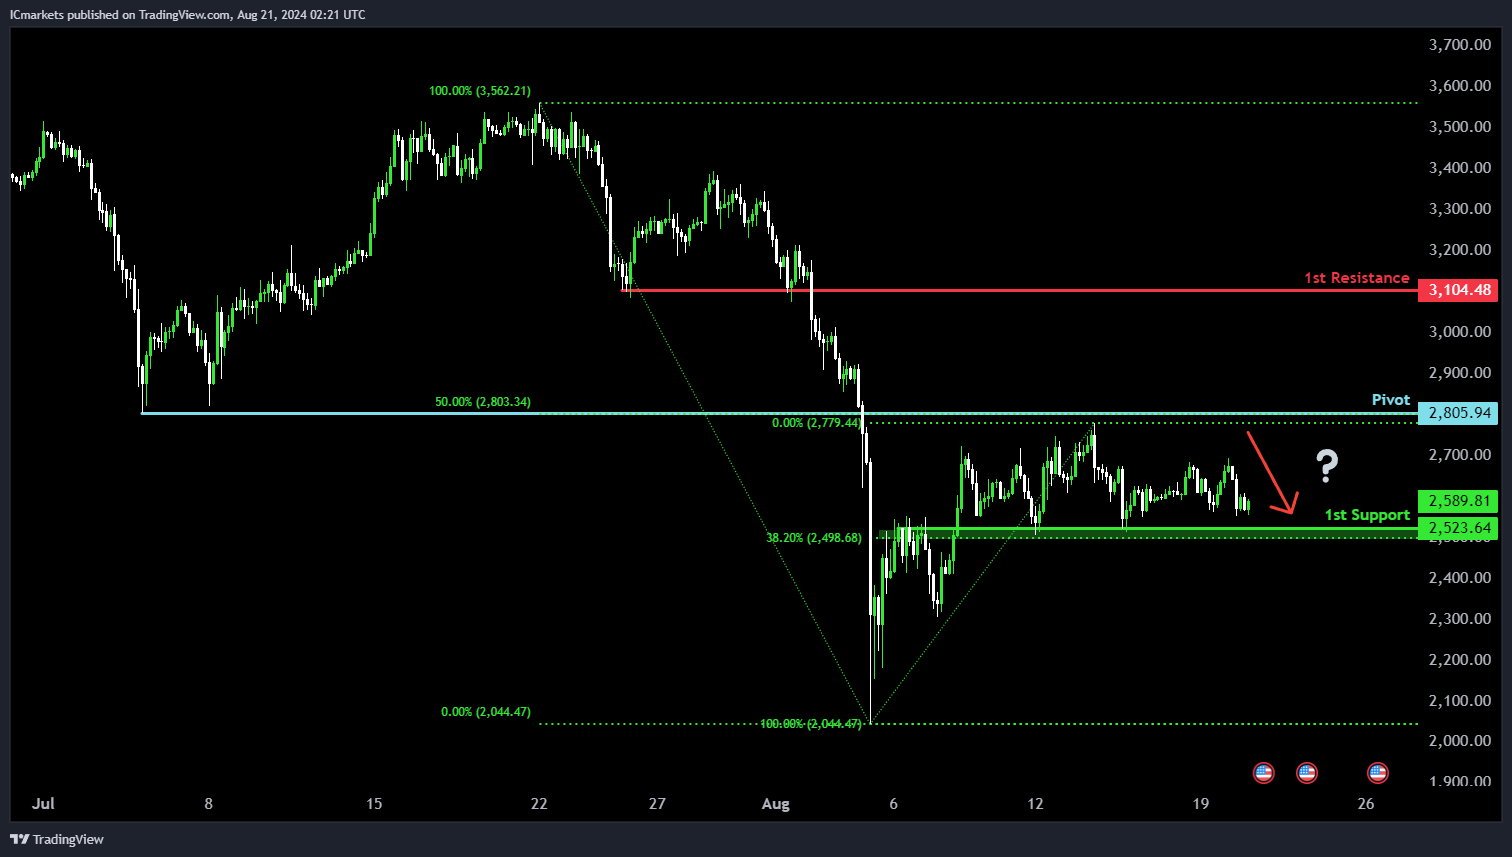
ETH/USD (Ethereum):
Potential Direction: Bearish
Overall momentum of the chart: Neutral
Price is rising towards the pivot and could potentially make a bearish reversal off this level to fall towards the 1st support.
Pivot: 2,805.94
Supporting reasons: Identified as an overlap resistance that aligns with a 50% Fibonacci retracement level, indicating a potential area where selling pressures could intensify.
1st Support: 2,523.64
Supporting Reasons: Identified as an overlap support that aligns with a 38.2% Fibonacci retracement level, indicating a potential area where price could find support.
1st Resistance: 3,104.48
Supporting Reasons: Identified as a pullback resistance, indicating a historical barrier where that could halt further upward movement.
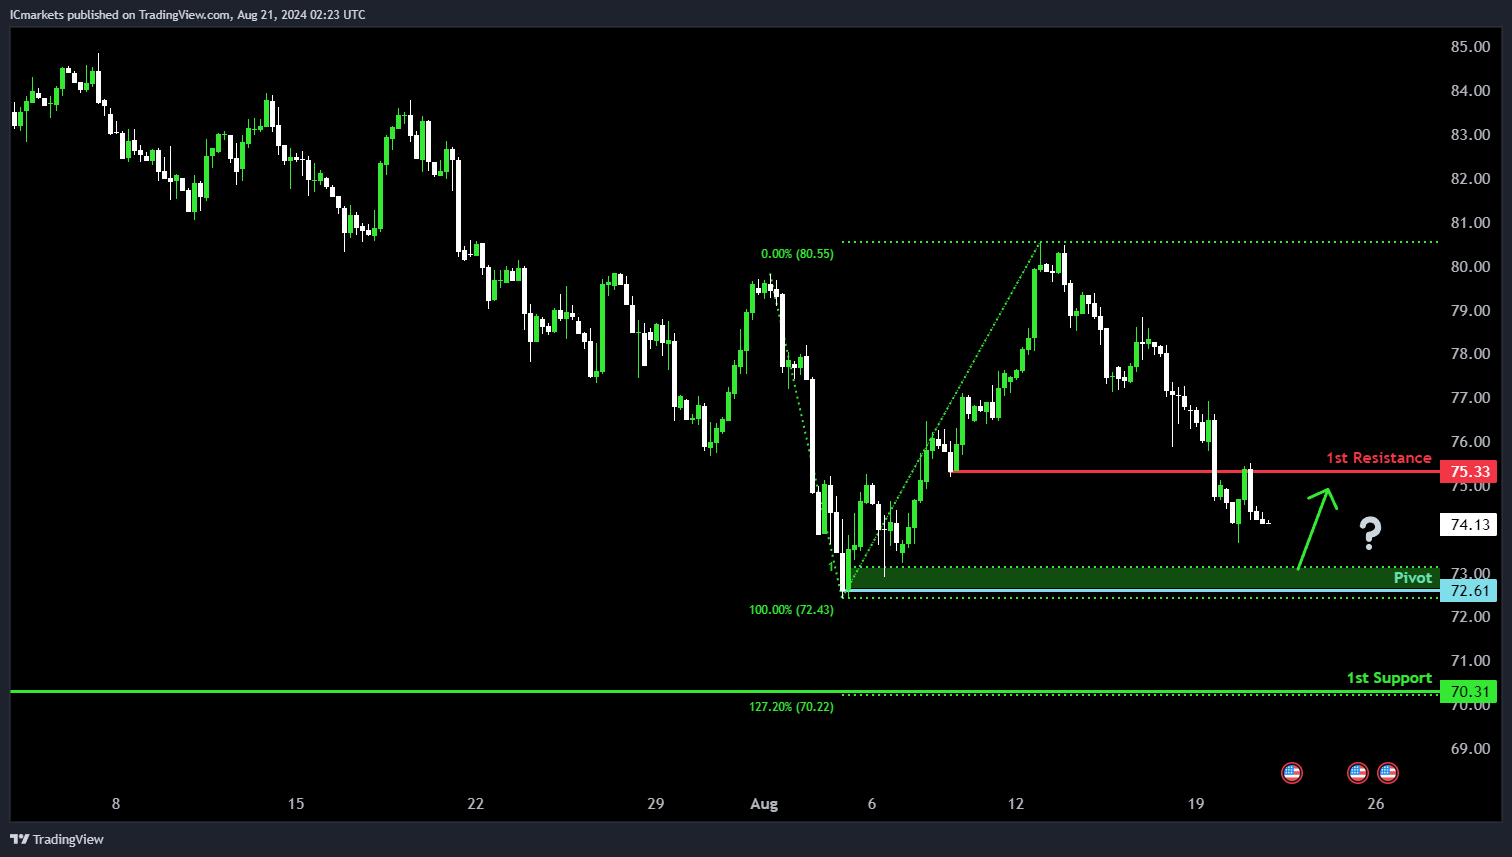
WTI/USD (Oil):
Potential Direction: Bullish
Overall Momentum of the Chart: Bearish
Price is falling towards the pivot and could potentially make a bullish bounce off this level to rise towards the 1st resistance.
Pivot: 72.61
Supporting Reasons: Identified as a swing-low support that aligns close to a 100% Fibonacci projection level, indicating a potential area where buying interests could pick up to stage a minor rebound.
1st Support: 70.31
Supporting Reasons: Identified as a pullback support that aligns with a 127.2% Fibonacci extension level, indicating a significant area where price has found support in the past.
1st Resistance: 75.33
Supporting Reasons: Identified as an overlap resistance, indicating a potential barrier that could halt further upward movement.
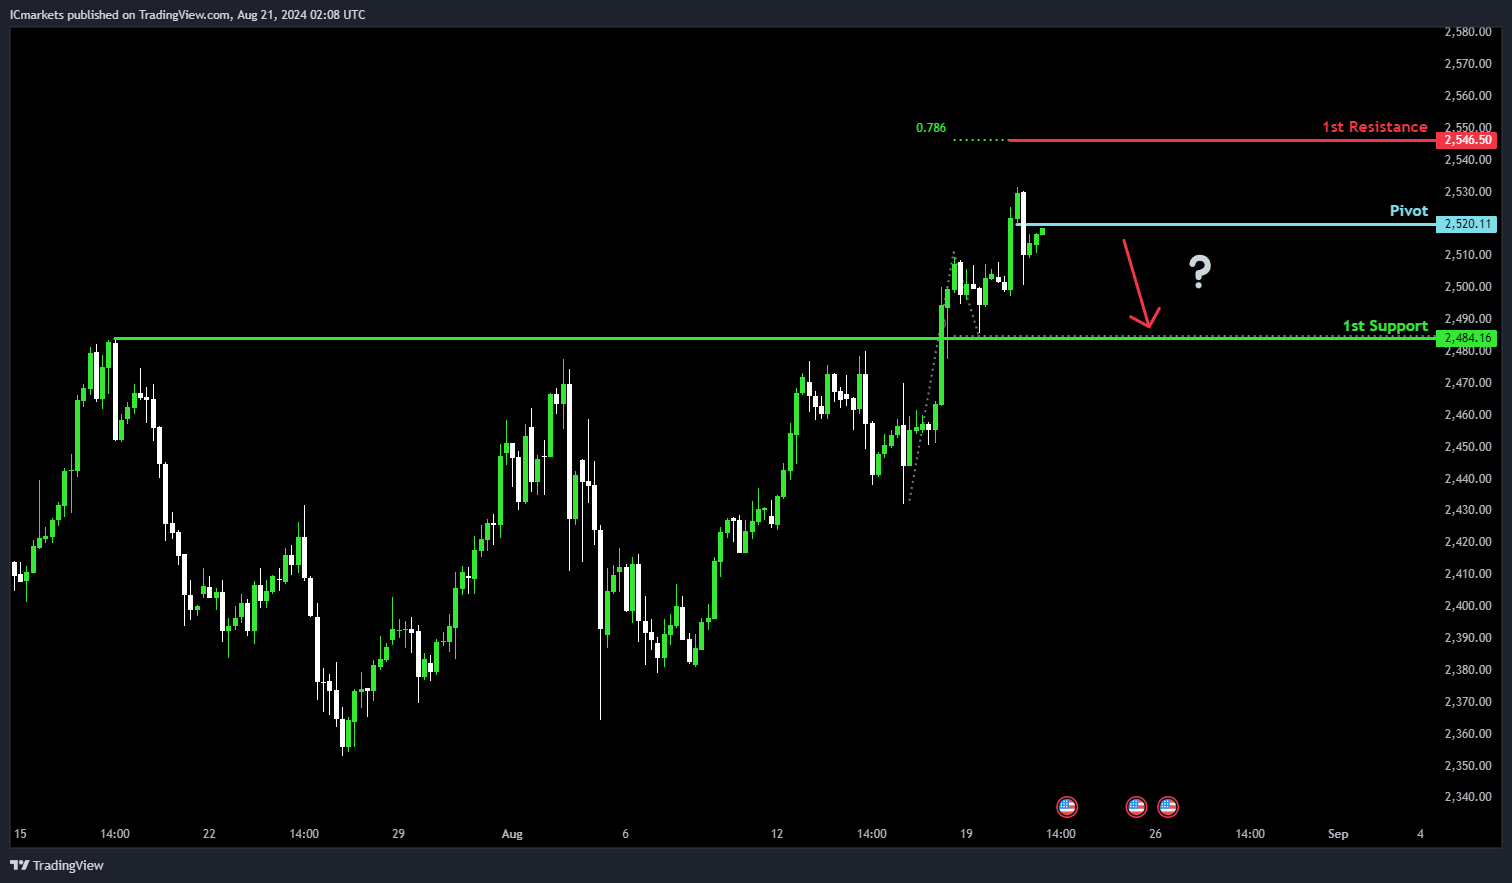
XAU/USD (GOLD):
Potential Direction: Bearish
Overall momentum of the chart: Bullish
Price could potentially make a bearish reaction off the pivot and drop to the 1st support.
Pivot: 2520.00
Supporting reasons: Identified as pullback resistance, indicating a potential area where the price might face selling pressure, causing a bearish reaction.
1st support: 2484.16
Supporting reasons: Identified as pullback support, suggesting a key level where the price might find support after a potential drop.
1st resistance: 2546.50
Supporting reasons: Reinforced by the 78.60% Fibonacci Projection, indicating a significant resistance level where the price could encounter strong selling pressure.
The accuracy, completeness and timeliness of the information contained on this site cannot be guaranteed. IC Trading does not warranty, guarantee or make any representations, or assume any liability regarding financial results based on the use of the information in the site.
News, views, opinions, recommendations and other information obtained from sources outside of www.ictrading.com, used in this site are believed to be reliable, but we cannot guarantee their accuracy or completeness. All such information is subject to change at any time without notice. IC Trading assumes no responsibility for the content of any linked site.
The fact that such links may exist does not indicate approval or endorsement of any material contained on any linked site. IC Trading is not liable for any harm caused by the transmission, through accessing the services or information on this site, of a computer virus, or other computer code or programming device that might be used to access, delete, damage, disable, disrupt or otherwise impede in any manner, the operation of the site or of any user’s software, hardware, data or property.