
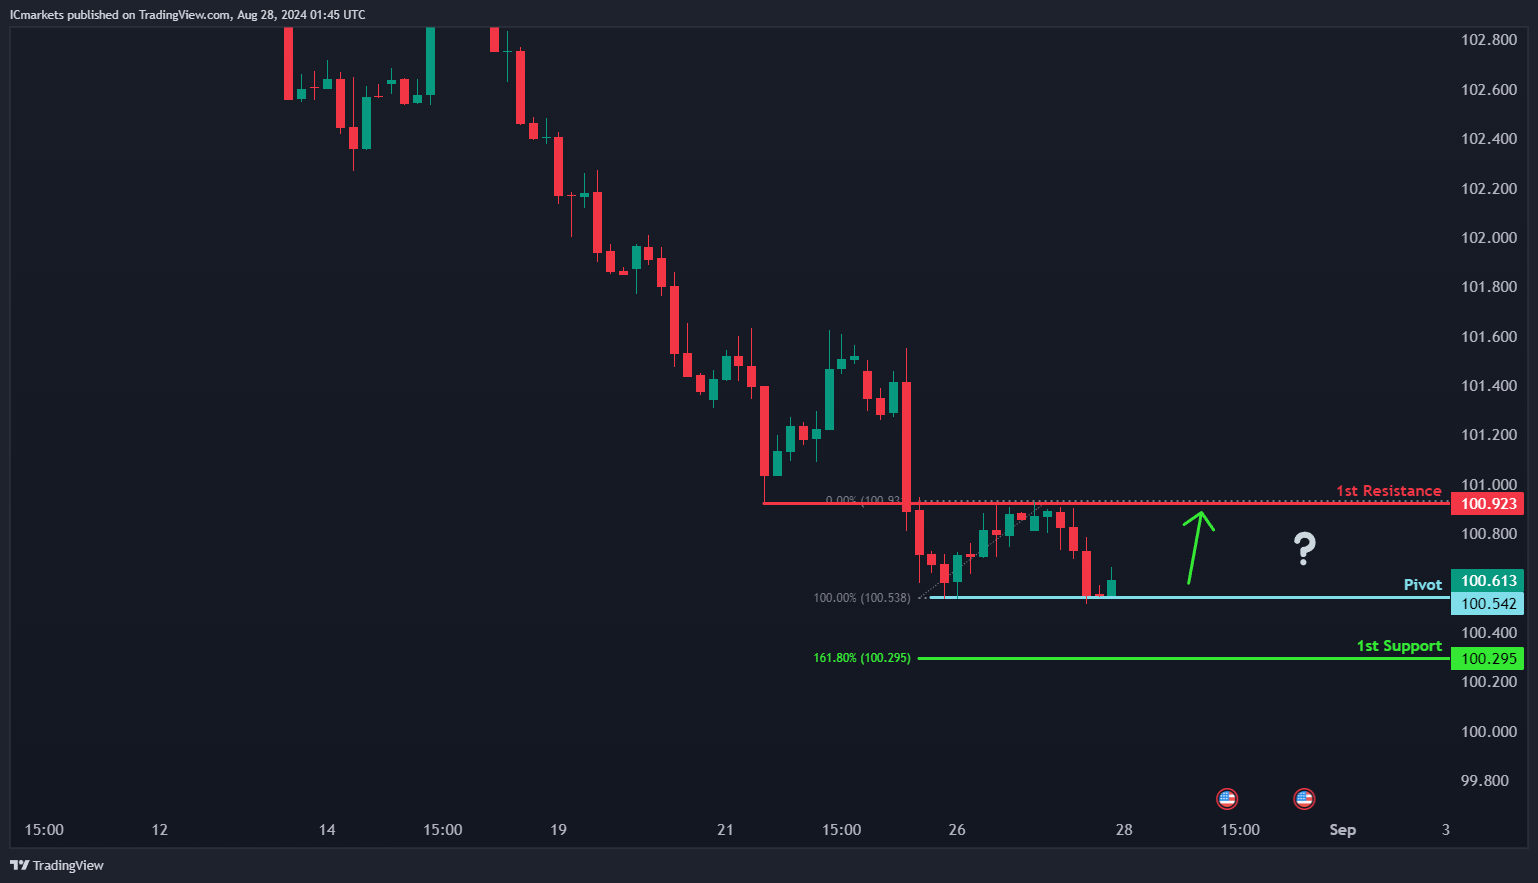
DXY (US Dollar Index):
Potential Direction: Bullish
Overall momentum of the chart: Bearish
Price could potentially make a bullish bounce off the pivot and head towards the 1st resistance.
Pivot: 100.54
Supporting reasons: Identified as multi-swing low support, indicating a significant level where the price has historically found support.
1st support: 100.29
Supporting reasons: Identified with a 161.80% Fibonacci Extension, suggesting a level where the price might find support during a decline.
1st resistance: 100.92
Supporting reasons: Marked as an overlap resistance, indicating a potential level where the price might face resistance during an upward move.
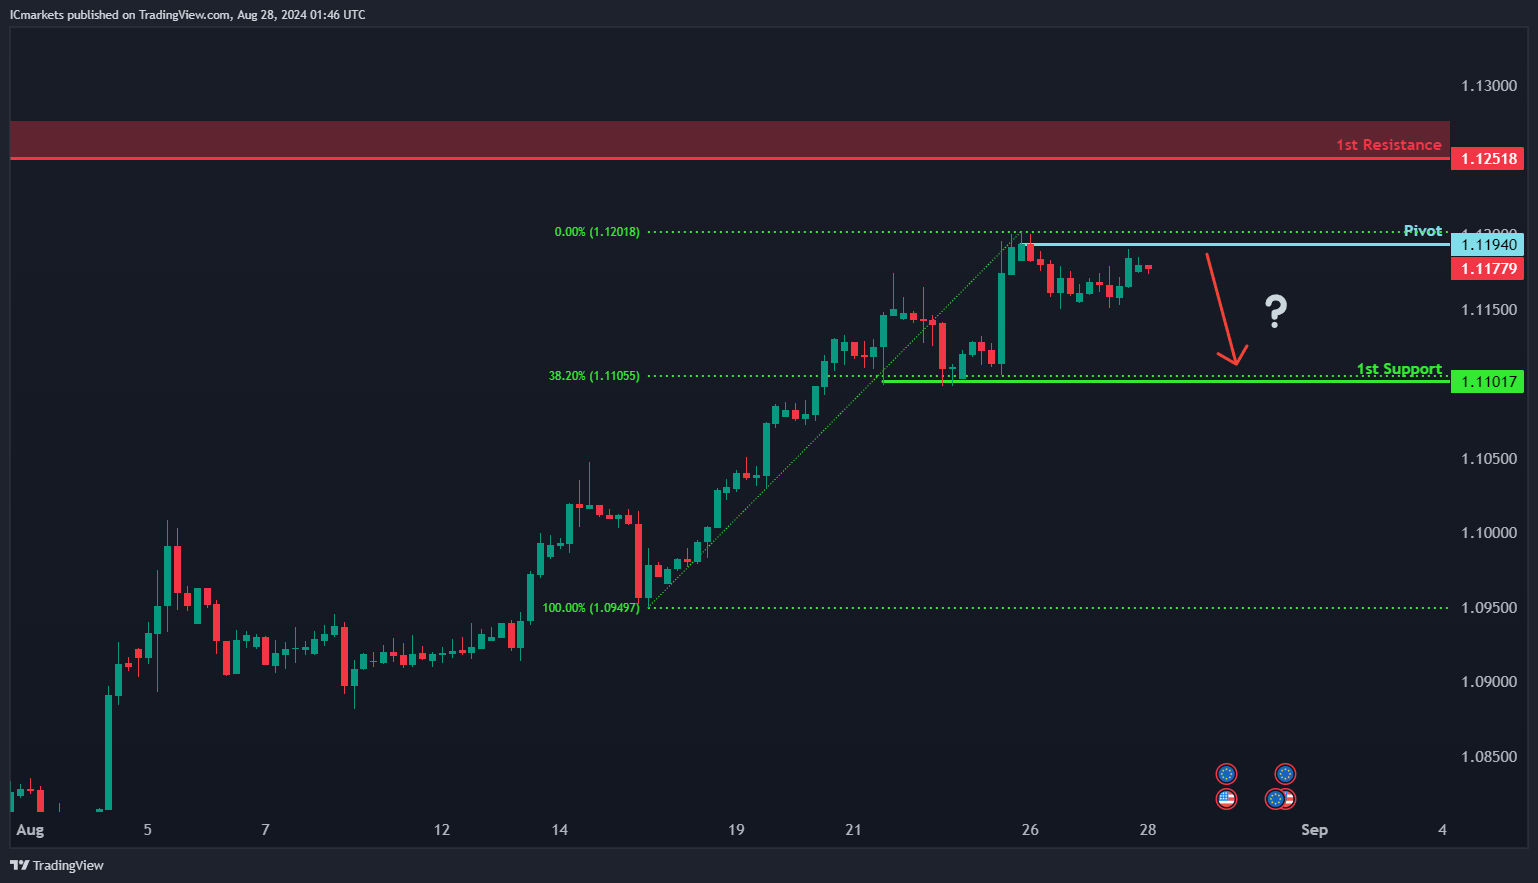
EUR/USD:
Potential Direction: Bearish
Overall momentum of the chart: Bullish
Price could potentially make a bearish reaction off the pivot and drop to the 1st support.
Pivot: 1.1194
Supporting reasons: Identified as multi-swing high resistance, indicating a level where the price has historically faced selling pressure.
1st support: 1.1101
Supporting reasons: Marked as multi-swing low support and aligned with the 38.20% Fibonacci Retracement, suggesting a level where the price might find support.
1st resistance: 1.1251
Supporting reasons: Identified as swing high resistance, indicating a level where the price might encounter resistance during an upward move.
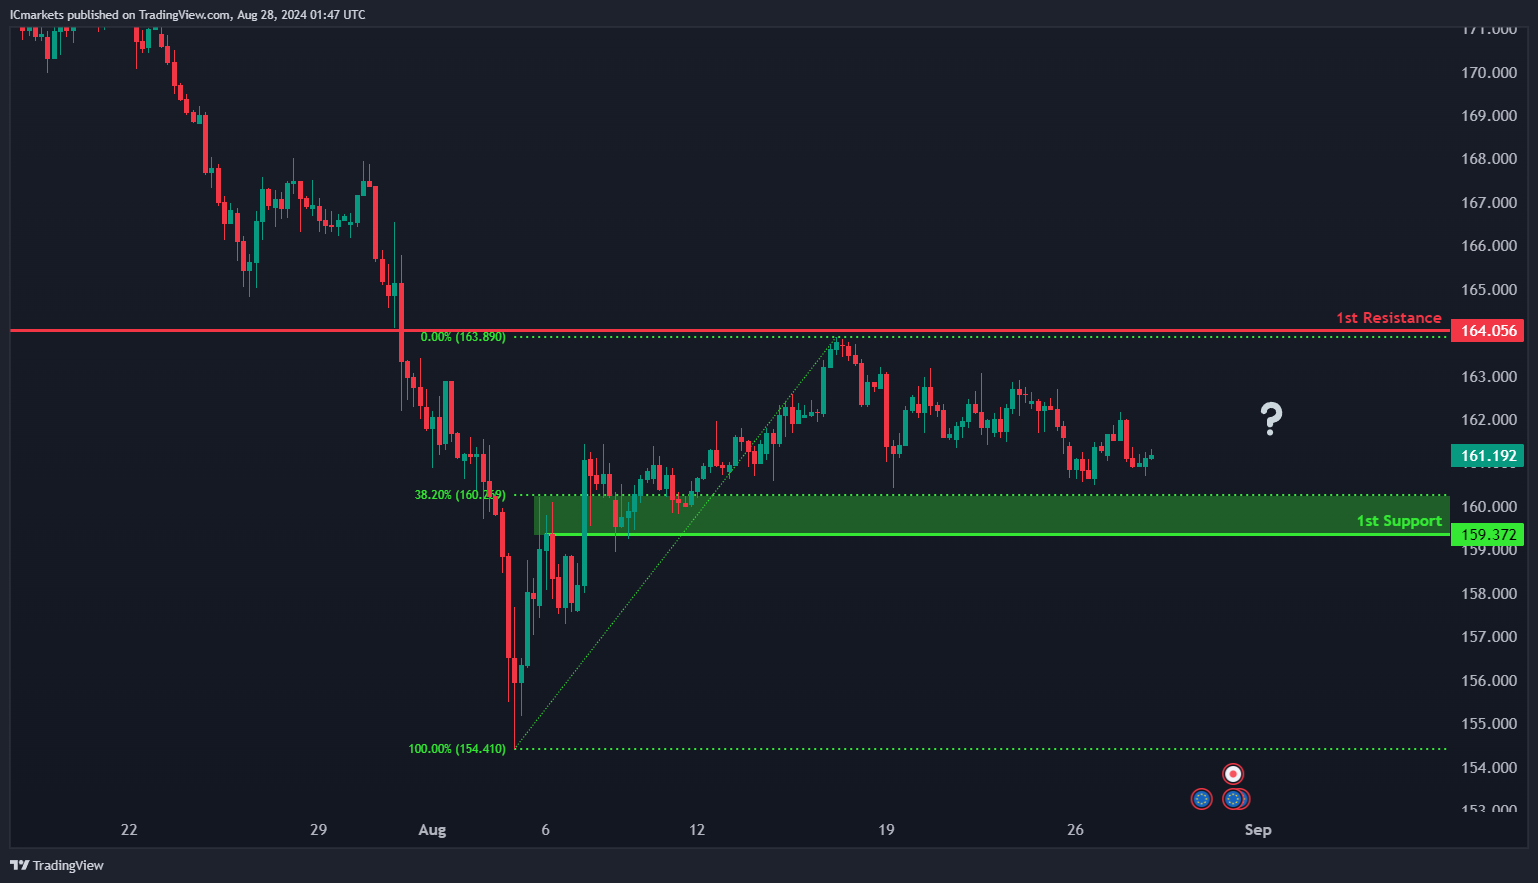
EUR/JPY:
Potential Direction: Neutral
Overall momentum of the chart: Neutral
Price could potentially fluctuate between the 1st resistance and 1st support level.
1st support: 159.37
Supporting reasons: Identified as an overlap support, aligned with the 38.20% Fibonacci Retracement, indicating a potential area where price could find support during a decline.
1st resistance: 164.05
Supporting reasons: Marked as an overlap resistance, suggesting a level where the price might face resistance if it attempts to rise.
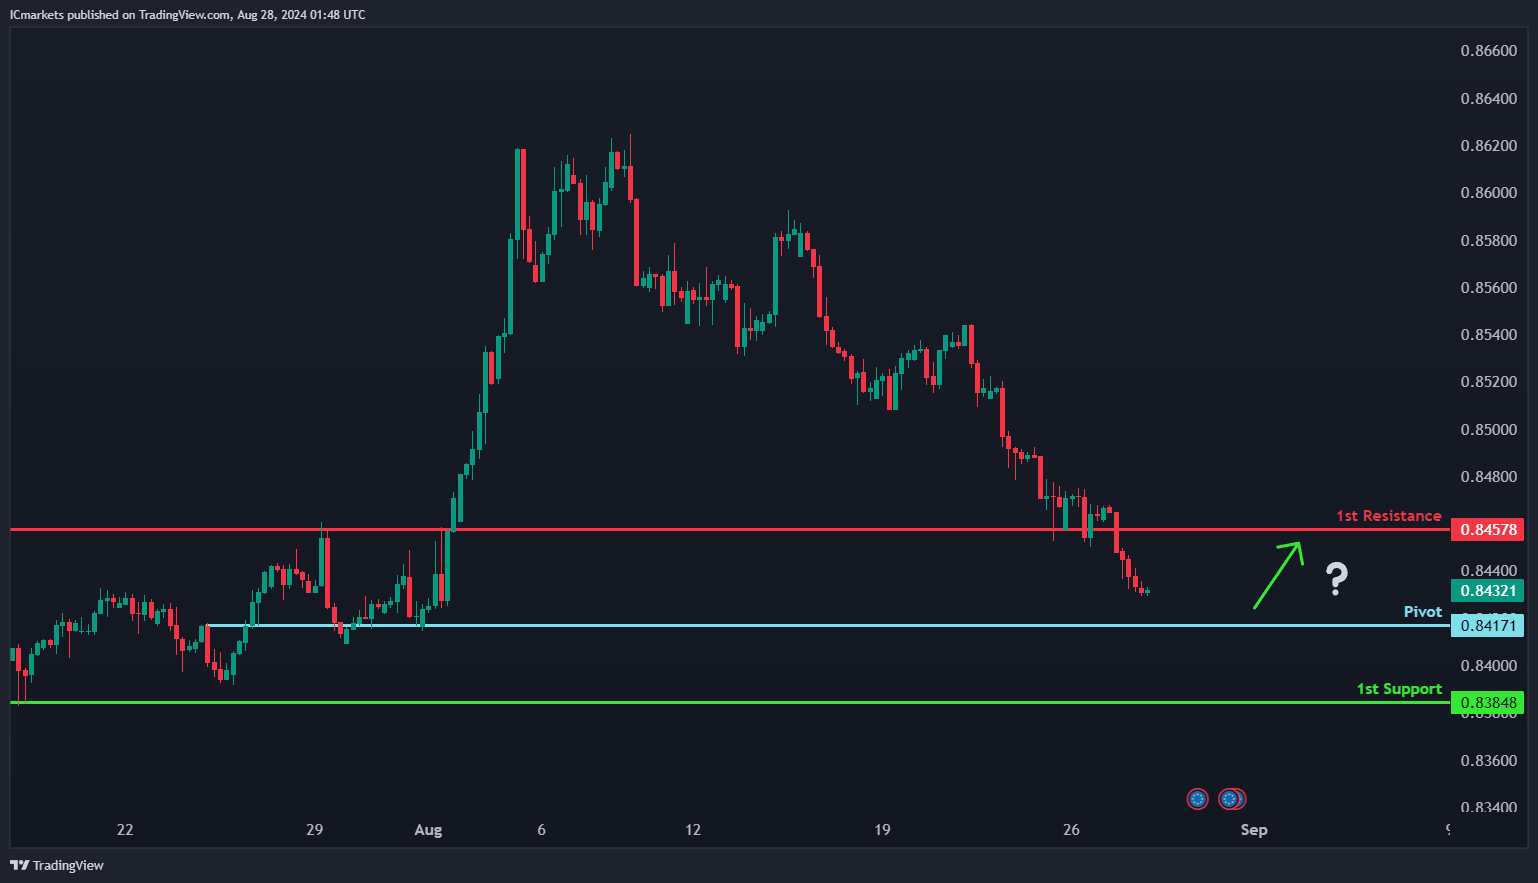
EUR/GBP:
Potential Direction: Bullish
Overall momentum of the chart: Bearish
Price could potentially make a bullish bounce off the pivot and head towards the 1st resistance.
Pivot: 0.8417
Supporting reasons: Identified as an overlap support, indicating a potential area where the price might find support and reverse to the upside.
1st support: 0.8384
Supporting reasons: Marked as pullback support, suggesting a level where the price could stabilize during a downturn.
1st resistance: 0.8457
Supporting reasons: Identified as pullback resistance, indicating a potential area where upward movement might encounter selling pressure.
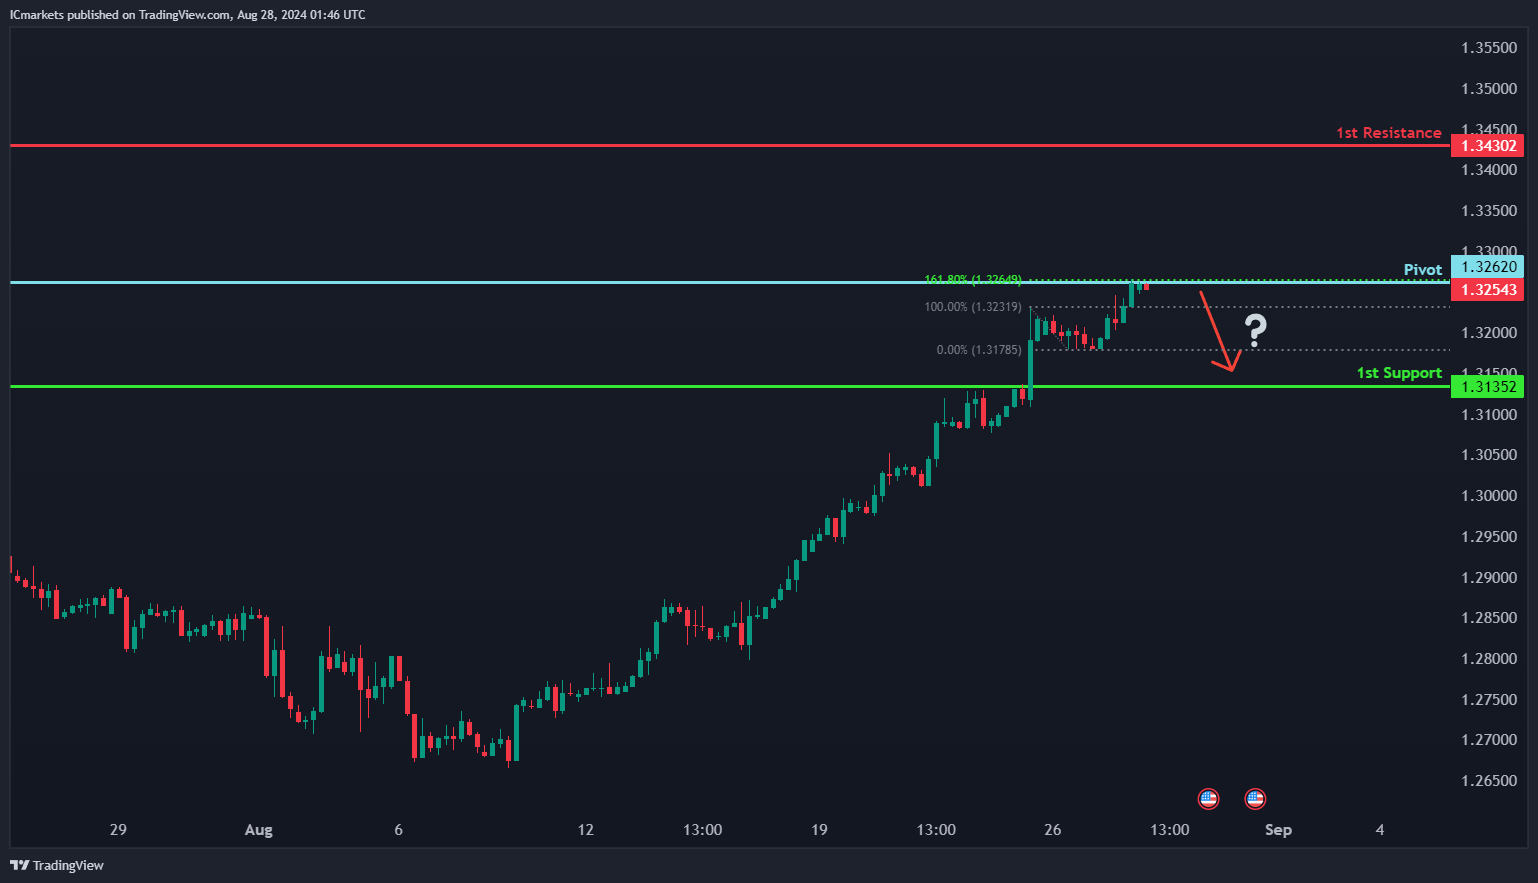
GBP/USD:
Potential Direction: Bearish
Overall momentum of the chart: Bullish
Price could potentially make a bearish reaction off the pivot and drop to the 1st support.
Pivot: 1.3254
Supporting reasons: Identified as swing high resistance, which could act as a significant barrier to further upward movement, reinforced by the 161.80% Fibonacci Retracement level.
1st support: 1.3135
Supporting reasons: Marked as pullback support, indicating an area where the price might find stability after a decline.
1st resistance: 1.3430
Supporting reasons: Identified as pullback resistance, where the price could encounter selling pressure if it moves higher.
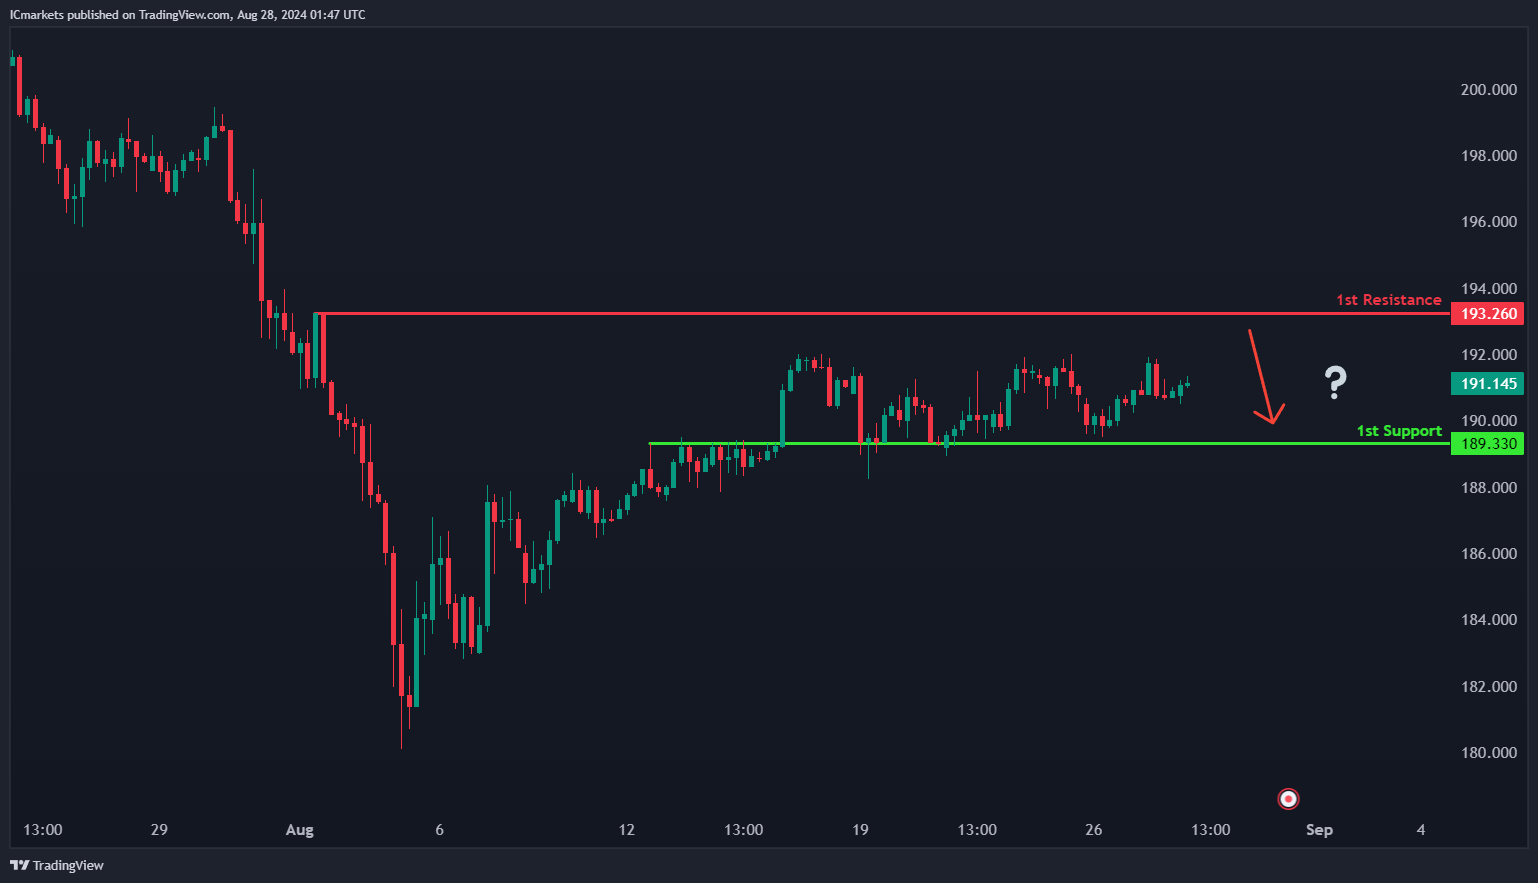
GBP/JPY:
Potential Direction: Neutral
Overall momentum of the chart: Neutral
Price could potentially fluctuate between the 1st resistance and 1st support levels.
1st support: 189.33
Supporting reasons: Identified as an overlap support level, which could act as a stabilizing point for the price during a decline.
1st resistance: 193.26
Supporting reasons: Marked as swing high resistance, suggesting a potential area where the price might face selling pressure or reversal if it moves upward.
USD/CHF:
Potential Direction: Bearish
Overall momentum of the chart: Bearish
Factors contributing to the momentum: Price is below the bearish Ichimoku cloud
Price could potentially make a bearish reaction off the pivot and drop to the 1st support.
Pivot: 0.8443
Supporting reasons: Identified as pullback resistance, indicating a potential area where selling pressure may resume.
1st support: 0.8343
Supporting reasons: Supported by the 127.20% Fibonacci Extension, suggesting a significant area where the price could find support during a decline.
1st resistance: 0.8533
Supporting reasons: An overlap resistance, which could act as a barrier if the price attempts to move upward.
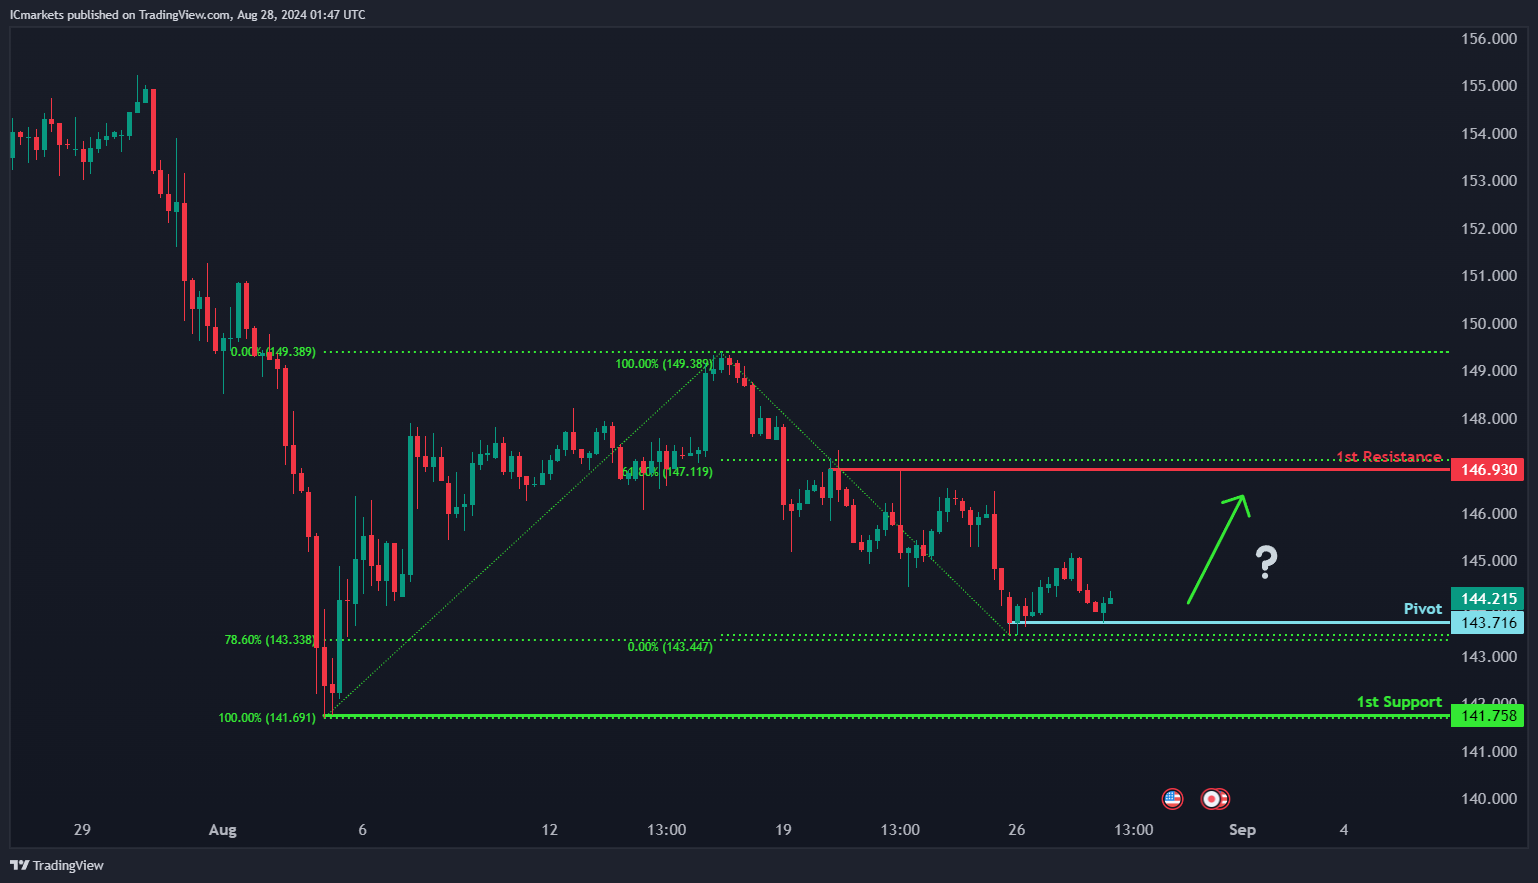
USD/JPY:
Potential Direction: Bullish
Overall momentum of the chart: Bullish
Price could potentially make a bullish continuation towards the 1st resistance.
Pivot: 143.71
Supporting reasons: Identified as an overlap support level with a 78.60% Fibonacci Retracement, suggesting it as a strong area for the price to bounce upward.
1st support: 141.75
Supporting reasons: Swing low support, indicating a significant area where the price has found support in previous declines.
1st resistance: 146.93
Supporting reasons: Multi-swing high resistance, combined with a 61.80% Fibonacci Retracement, marking a strong area where the price could face selling pressure.
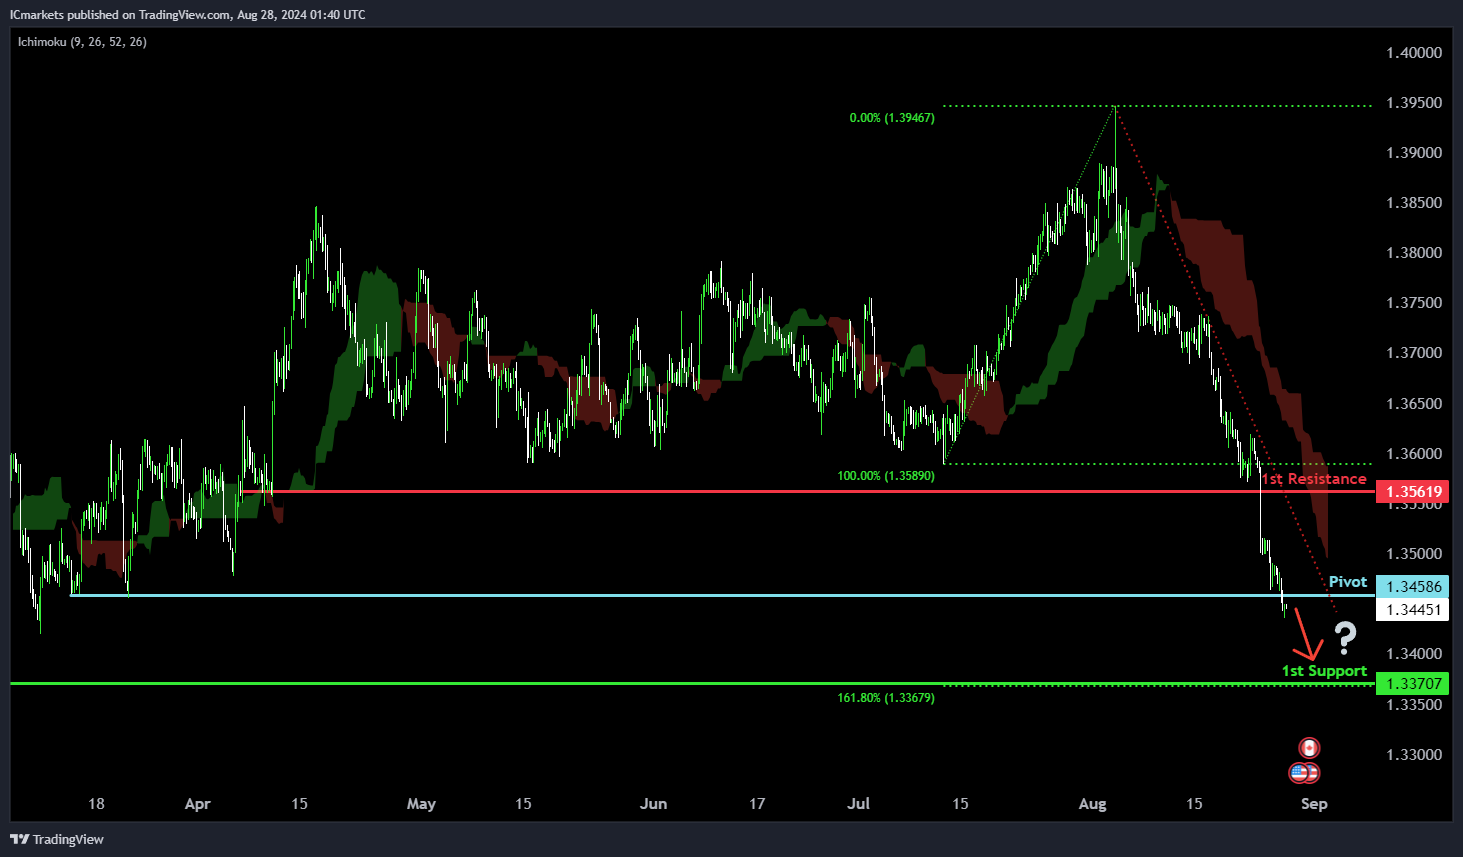
USD/CAD:
Potential Direction: Bearish
Overall momentum of the chart: Bearish
Price has made a bearish break below the pivot and could potentially fall lower towards the 1st support.
Pivot: 1.3458
Supporting reasons: Previously identified as a pullback support which now has been broken due to the strong bearish momentum.
1st support: 1.3370
Supporting reasons: Identified as a pullback support that aligns with a 161.8% Fibonacci extension, indicating a potential area where price could find strong support.
1st resistance: 1.3561
Supporting reasons: Identified as a pullback resistance, indicating a potential area that could halt any further upward movement. The presence of the bearish Ichimoku Cloud adds further significance to the strength of this resistance zone.
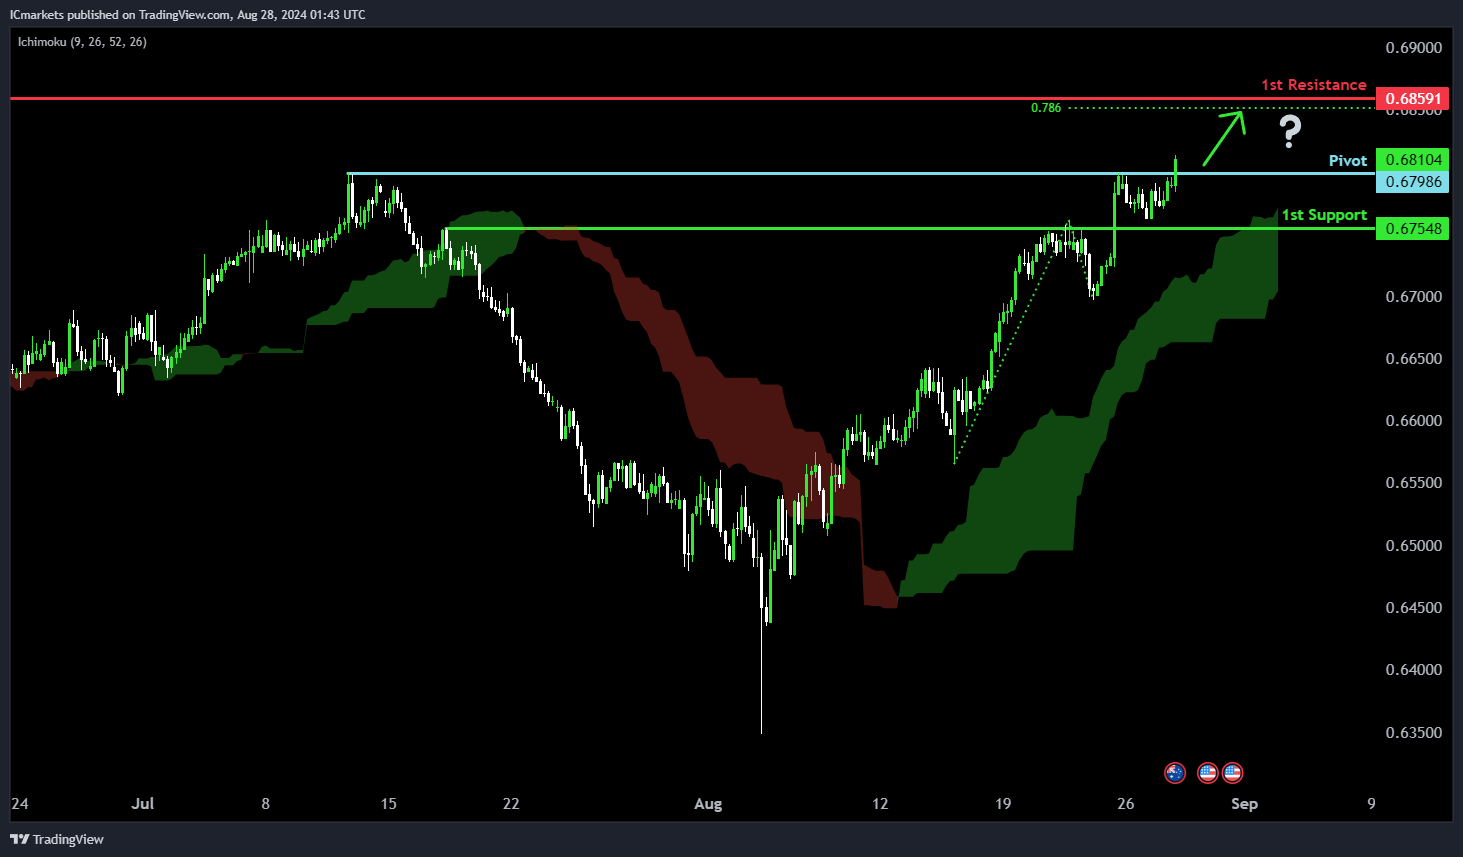
AUD/USD:
Potential Direction: Bullish
Overall momentum of the chart: Bullish
Price has made a bullish break above the pivot and could potentially rise towards the 1st resistance.
Pivot: 0.6798
Supporting reasons: Previously identified as a swing-high resistance which now has been broken due to the strong bullish momentum.
1st support: 0.6754
Supporting reasons: Identified as an overlap support, suggesting a potential area where price has recently found support. The presence of the bullish Ichimoku Cloud adds further significance to the strength of this support zone.
1st resistance: 0.6859
Supporting reasons: Identified as a swing-high resistance that aligns close to a 78.6% Fibonacci projection, indicating a significant area that could halt further upward movement.
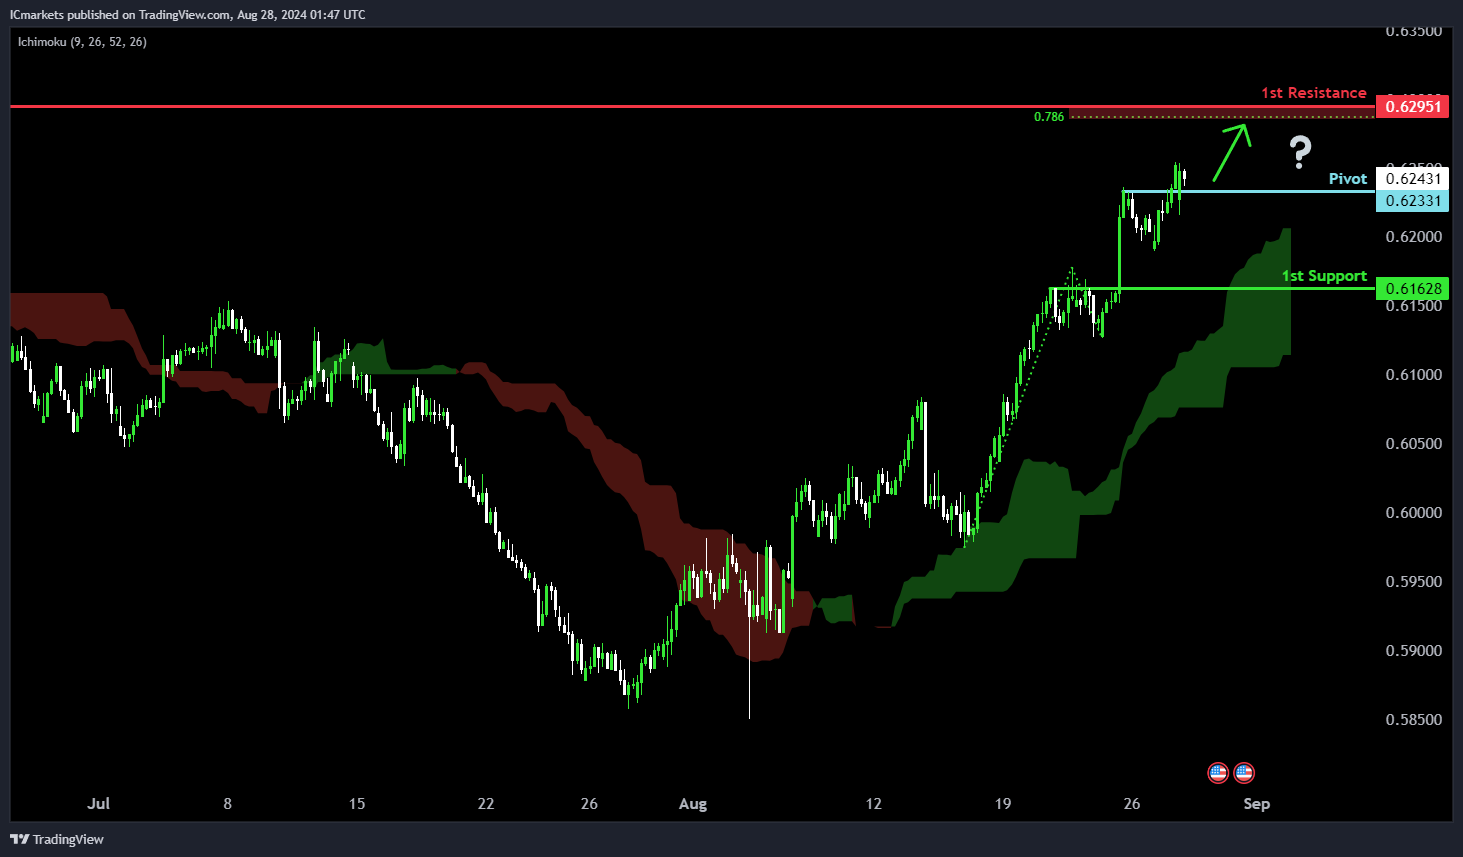
NZD/USD
Potential Direction: Bullish
Overall momentum of the chart: Bullish
Price has made a bullish break above the pivot and could potentially rise towards the 1st resistance.
Pivot: 0.6233
Supporting reasons: Previously identified as a pullback resistance which now has been broken due to the strong bullish momentum.
1st support: 0.6162
Supporting reasons: Identified as a pullback support, suggesting a potential area where price could find support. The presence of the bullish Ichimoku Cloud adds further significance to the strength of this support zone.
1st resistance: 0.6295
Supporting reasons: Identified as an overlap resistance that aligns close to a 78.6% Fibonacci projection, indicating a significant area that could halt further upward movement.
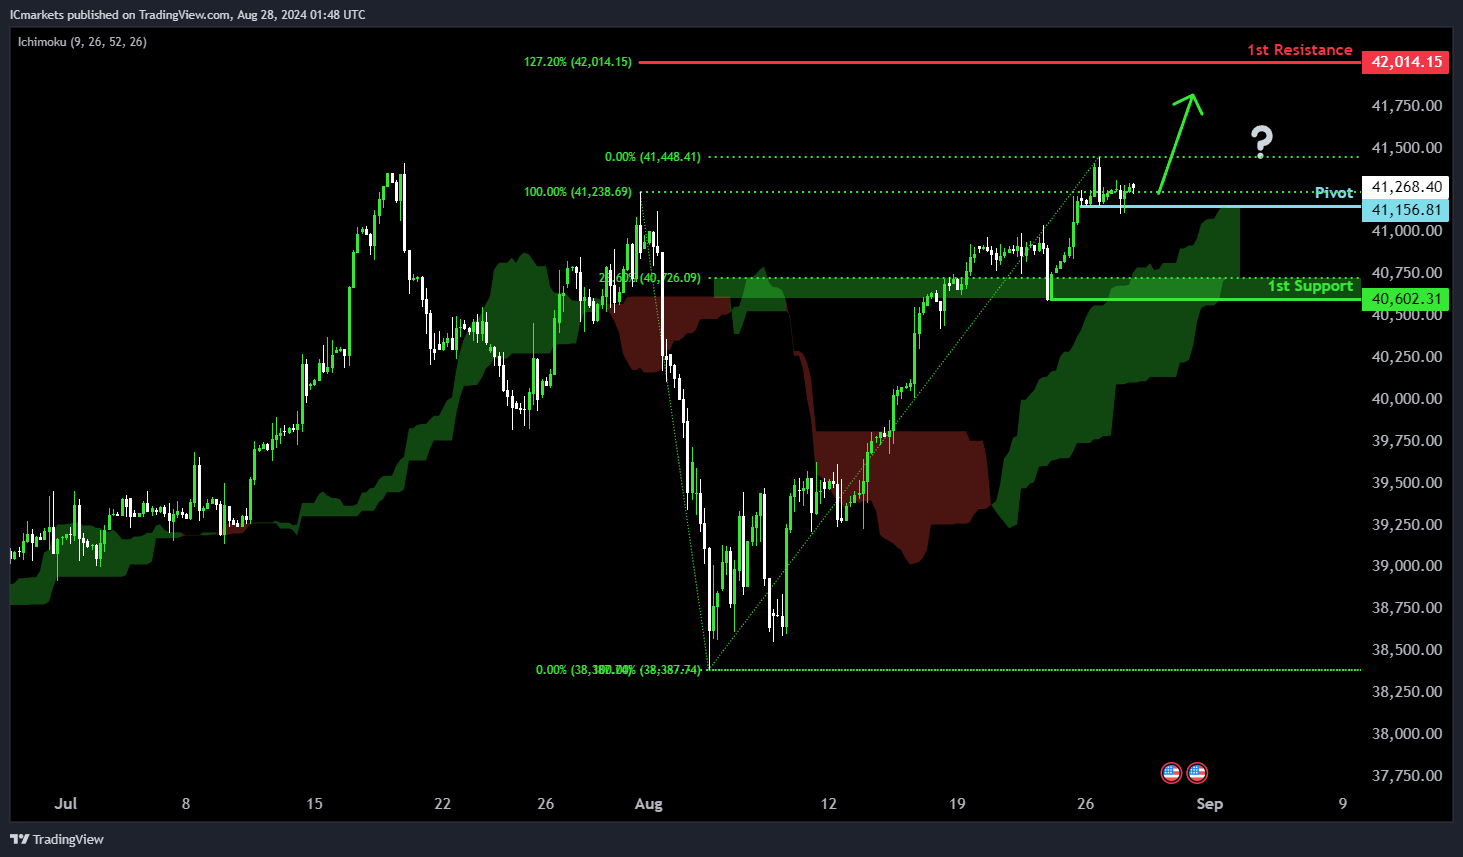
US30 (DJIA):
Potential Direction: Bullish
Overall Momentum of the Chart: Bullish
Price could potentially make a bullish bounce off the pivot to rise towards the 1st resistance.
Pivot: 41,156.81
Supporting reasons: Identified as a pullback resistance, suggesting a potential area where buying interests could pick up to resume the uptrend.
1st Support: 40,602.31
Supporting Reasons: Identified as a pullback support that aligns close to a 23.6% Fibonacci retracement, suggesting an area where price has found support recently. The presence of the bullish Ichimoku Cloud adds further significance to the strength of this support zone.
1st Resistance: 42,014.15
Supporting Reasons: Identified as a resistance that aligns with a 127.2% Fibonacci extension, indicating a significant area that could halt further upward movement.
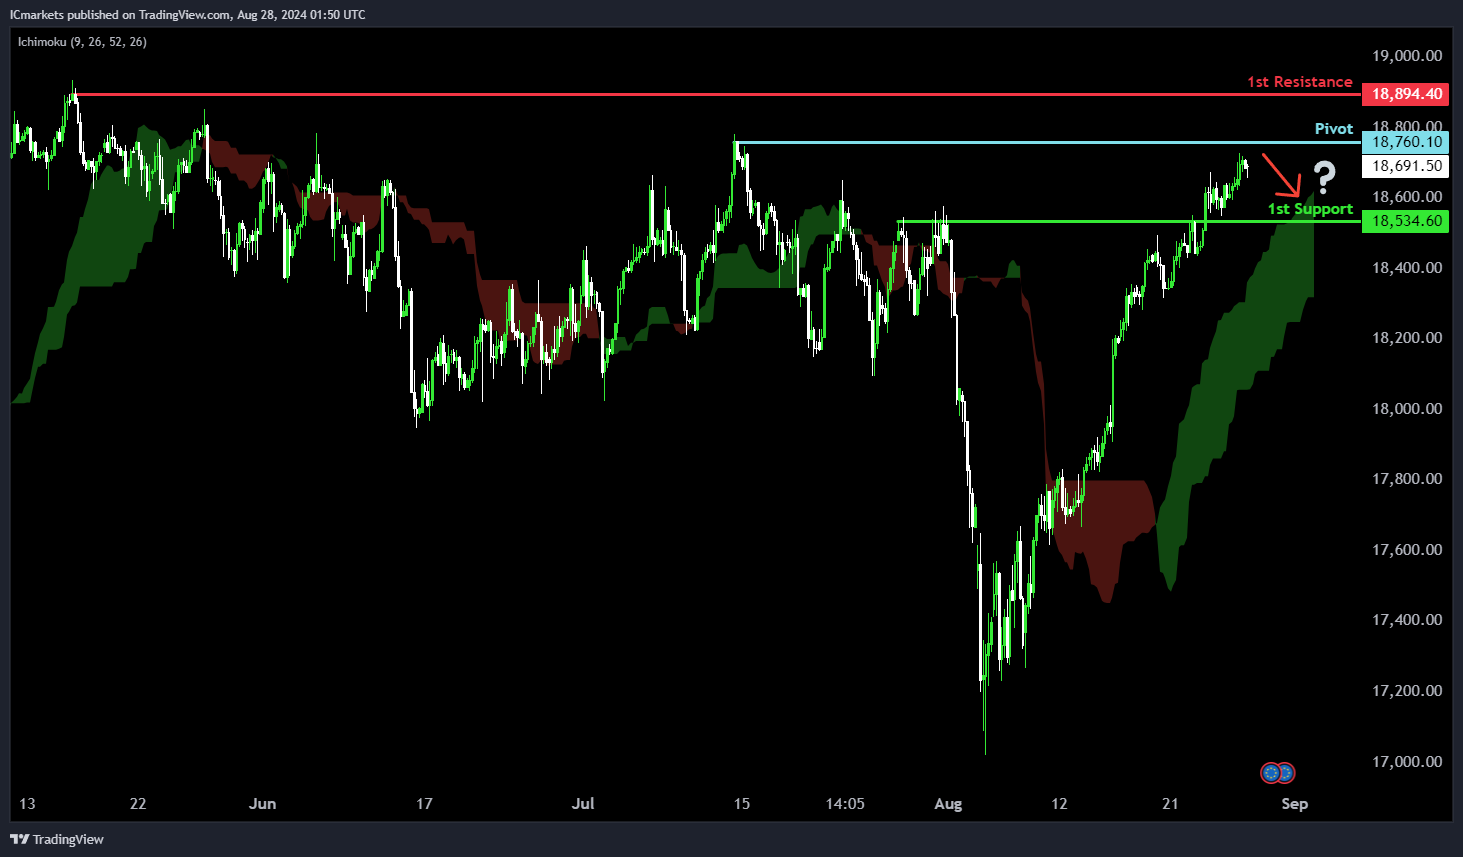
DE40 (DAX):
Potential Direction: Bearish
Overall Momentum of the Chart: Bullish
Price is rising towards the pivot and could potentially make a bearish reversal off this level to pull back towards the 1st support.
Pivot: 18,760.10
Supporting reasons: Identified as a swing-high resistance, suggesting a potential area where selling pressures could intensify.
1st Support: 18,534.60
Supporting Reasons: Identified as an overlap support, indicating a potential area where price could find support. The presence of the bullish Ichimoku Cloud adds further significance to the strength of this support zone.
1st Resistance: 18,894.40
Supporting Reasons: Identified as a swing-high resistance that aligns close to the all-time high, indicating a significant area that could halt further upward movement.
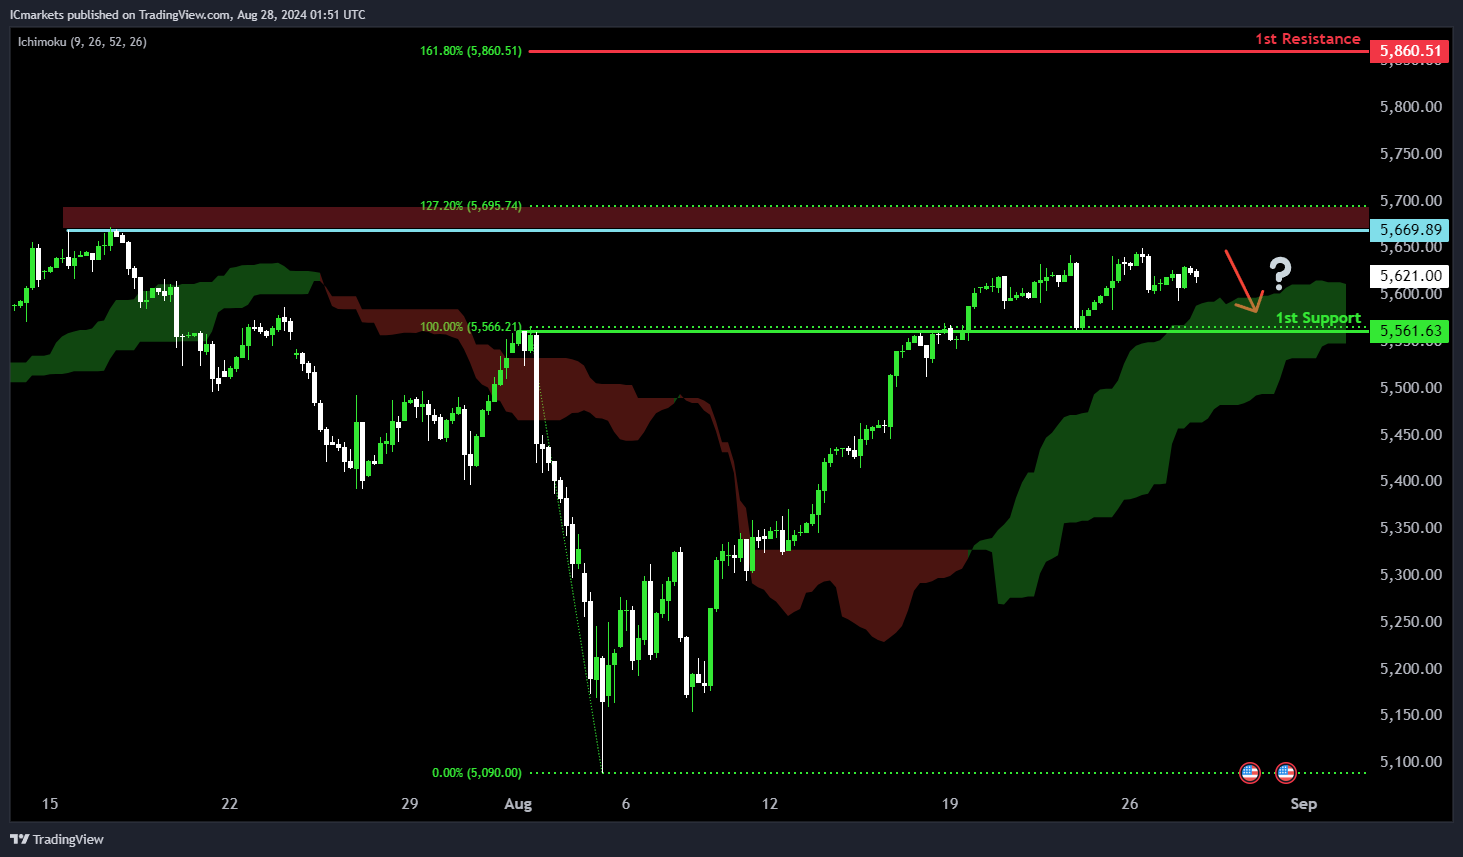
US500 (S&P 500):
Potential Direction: Bearish
Overall Momentum of the Chart: Bullish
Price is rising towards the pivot and could potentially make a bearish reversal off this level to pull back towards the 1st support.
Pivot: 5,669.89
Supporting reasons: Identified as a swing-high resistance that aligns close to a 127.2% Fibonacci extension, suggesting a potential area where selling pressures could intensify.
1st support: 5,561.63
Supporting reasons: Identified as an overlap support, suggesting a potential area where price could find support. The presence of the bullish Ichimoku Cloud adds further significance to the strength of this support zone.
1st resistance: 5,860.51
Supporting reasons: Identified as a resistance that aligns with a 161.8% Fibonacci extension, suggesting a critical area that could halt further upward movement.
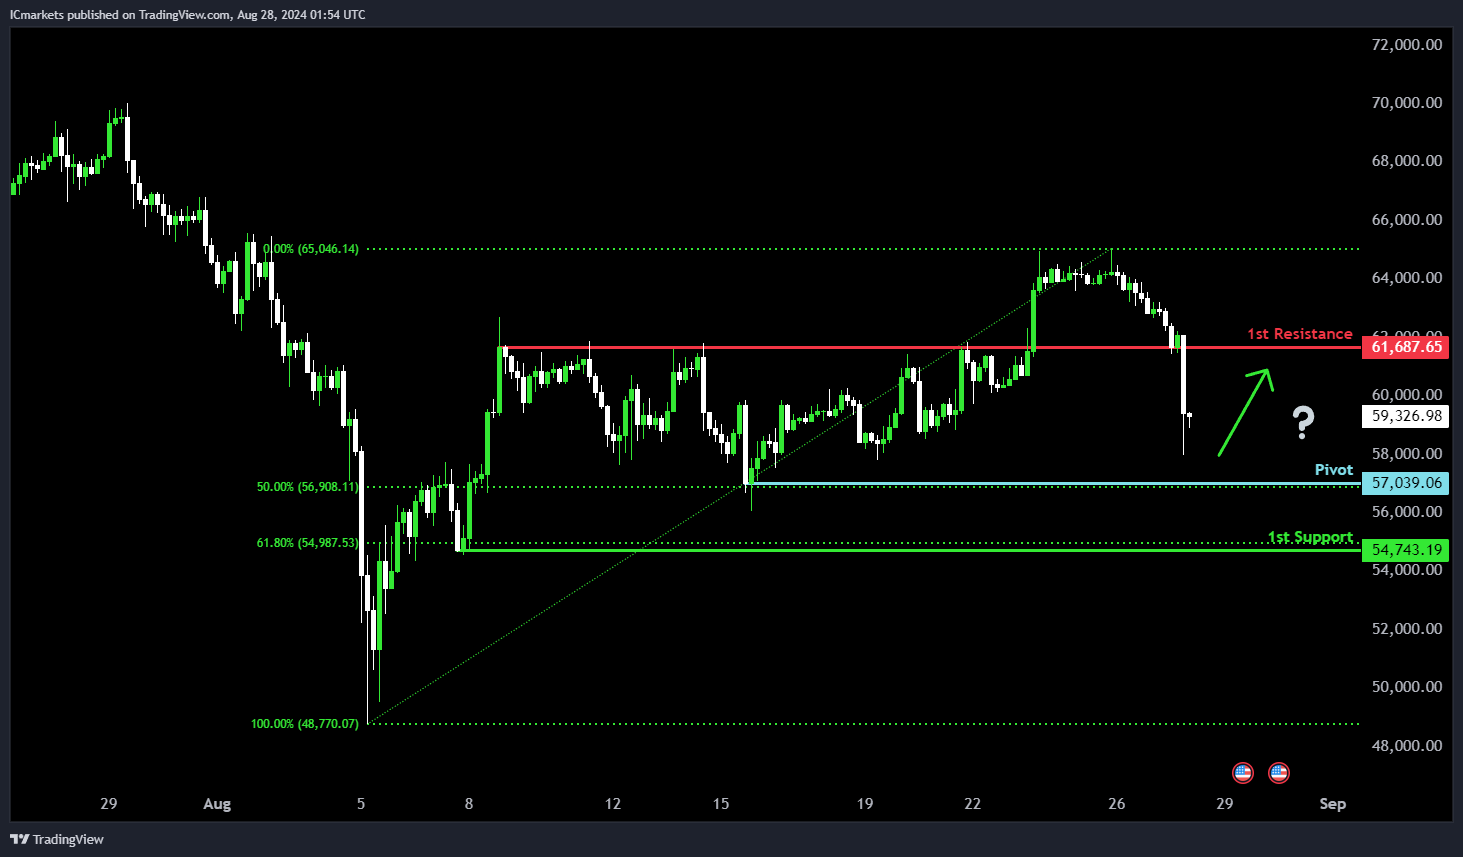
BTC/USD (Bitcoin):
Potential Direction: Bullish
Overall momentum of the chart: Bearish
Price is falling towards the pivot and could potentially make a bullish bounce off this level to rise towards the 1st resistance.
Pivot: 57,039.06
Supporting reasons: Identified as a pullback support that aligns with a 50% Fibonacci retracement, indicating a potential area where buying interests could pick up to stage a minor rebound.
1st support: 54,743.19
Supporting reasons: Identified as a pullback support that aligns close to a 61.8% Fibonacci retracement indicating a significant area where price has found support in the past.
1st resistance: 61,687.65
Supporting reasons: Identified as an overlap resistance, indicating a potential barrier that could halt further upward movement.
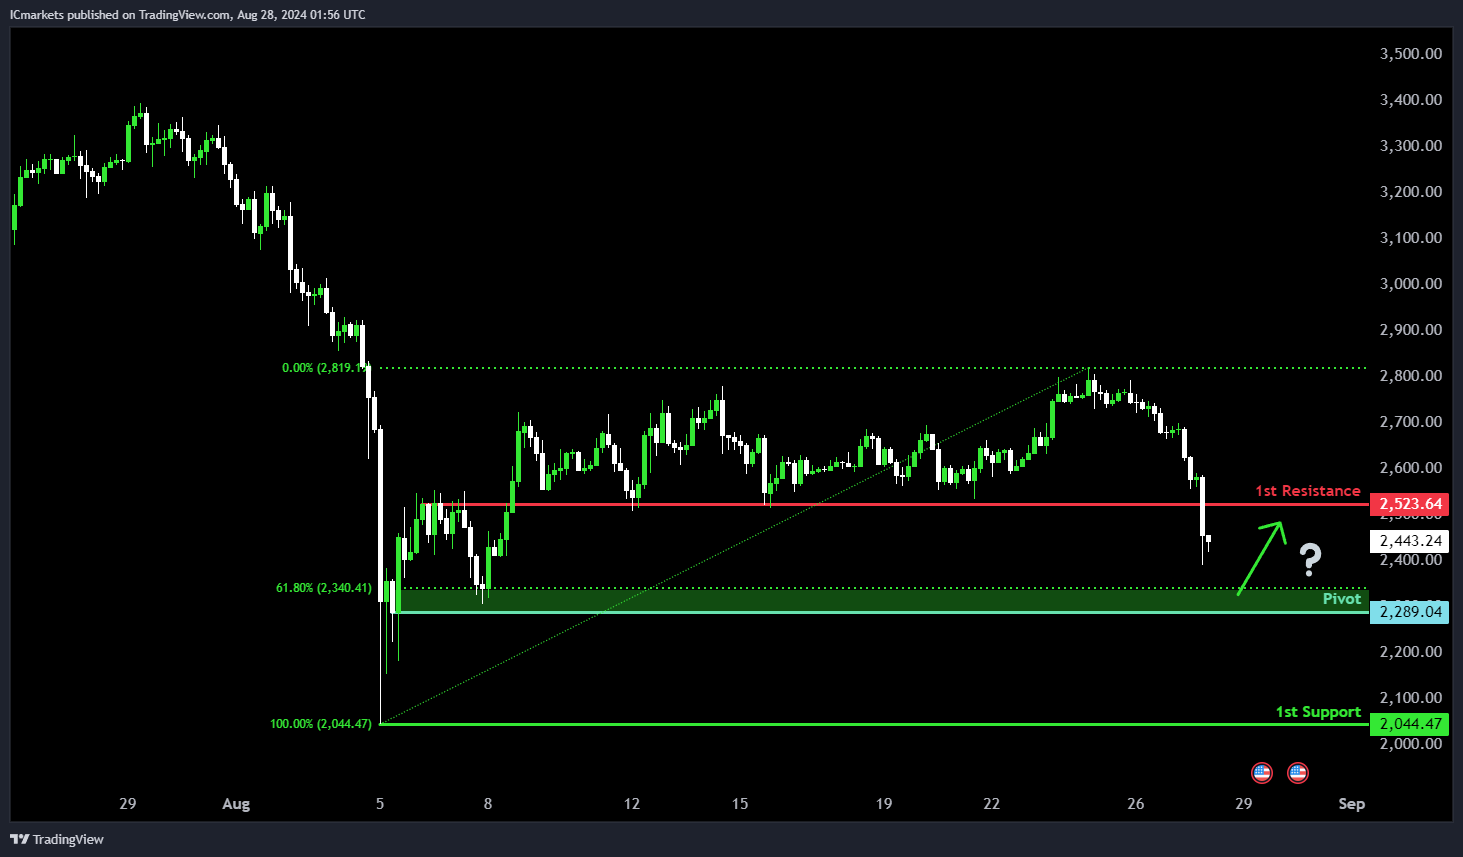
ETH/USD (Ethereum):
Potential Direction: Bullish
Overall momentum of the chart: Bearish
Price is falling towards the pivot and could potentially make a bullish bounce off this level to rise towards the 1st resistance.
Pivot: 2,289.04
Supporting reasons: Identified as a pullback support that aligns close to a 61.8% Fibonacci retracement, indicating a potential area where buying interests could pick up to stage a minor rebound.
1st Support: 2,044.47
Supporting Reasons: Identified as a swing-low support, indicating a potential area where price could find support.
1st Resistance: 2,523.64
Supporting Reasons: Identified as an overlap resistance, indicating a historical barrier where that could halt further upward movement.
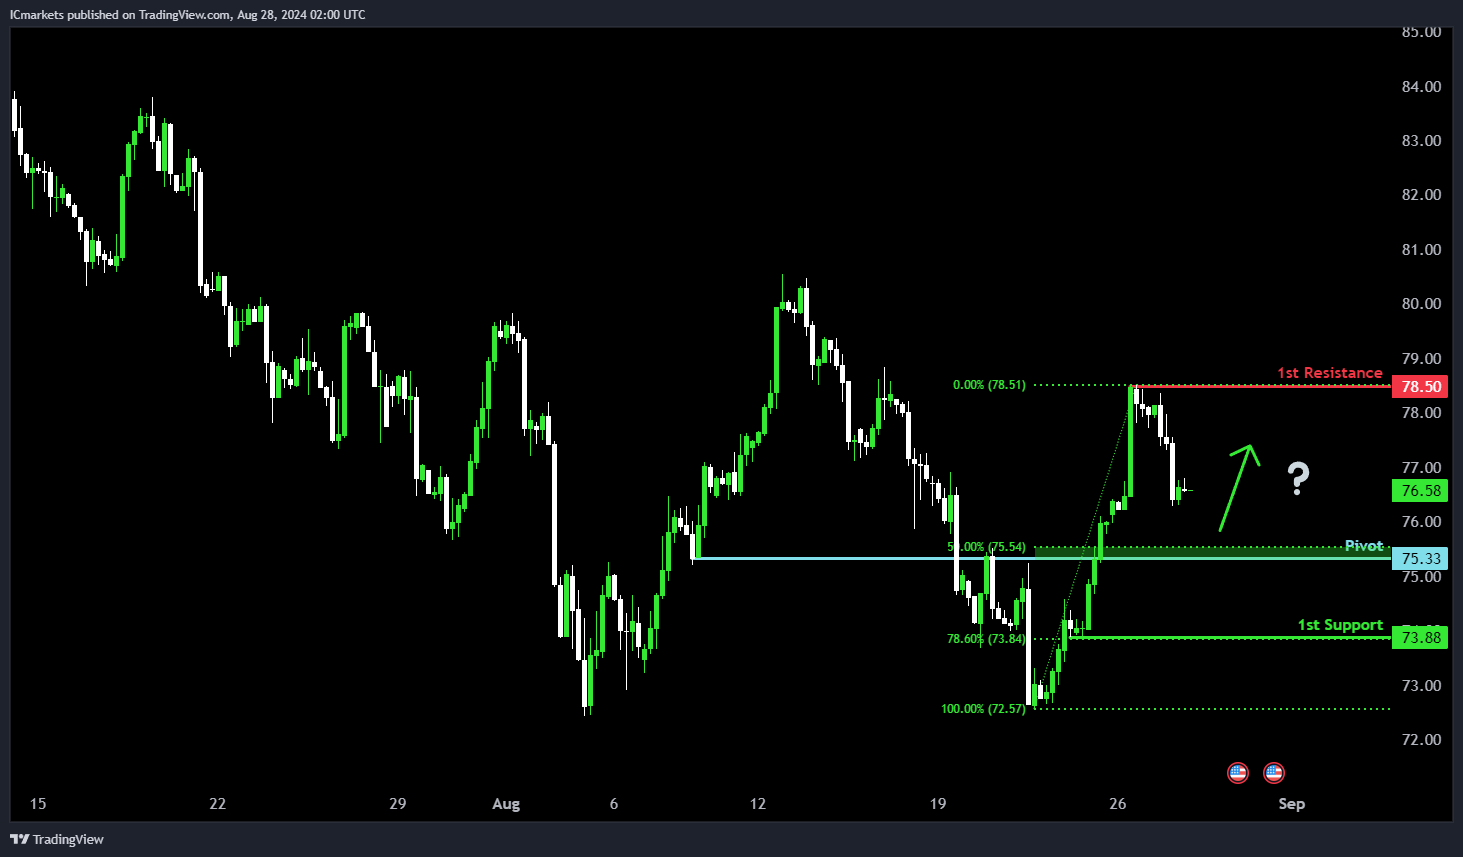
WTI/USD (Oil):
Potential Direction: Bullish
Overall Momentum of the Chart: Bearish
Price could fall towards the pivot and potentially make a bullish bounce off this level to rise towards the 1st resistance.
Pivot: 75.33
Supporting Reasons: Identified as an overlap support that aligns close to a 50% Fibonacci retracement, suggesting a potential area where buying interests could pick up to stage a rebound.
1st Support: 73.88
Supporting Reasons: Identified as a pullback support that aligns with 78.6% Fibonacci retracement, indicating a potential area where price could find support.
1st Resistance: 78.50
Supporting Reasons: Identified as a pullback resistance, indicating a potential barrier that could halt further upward movement.
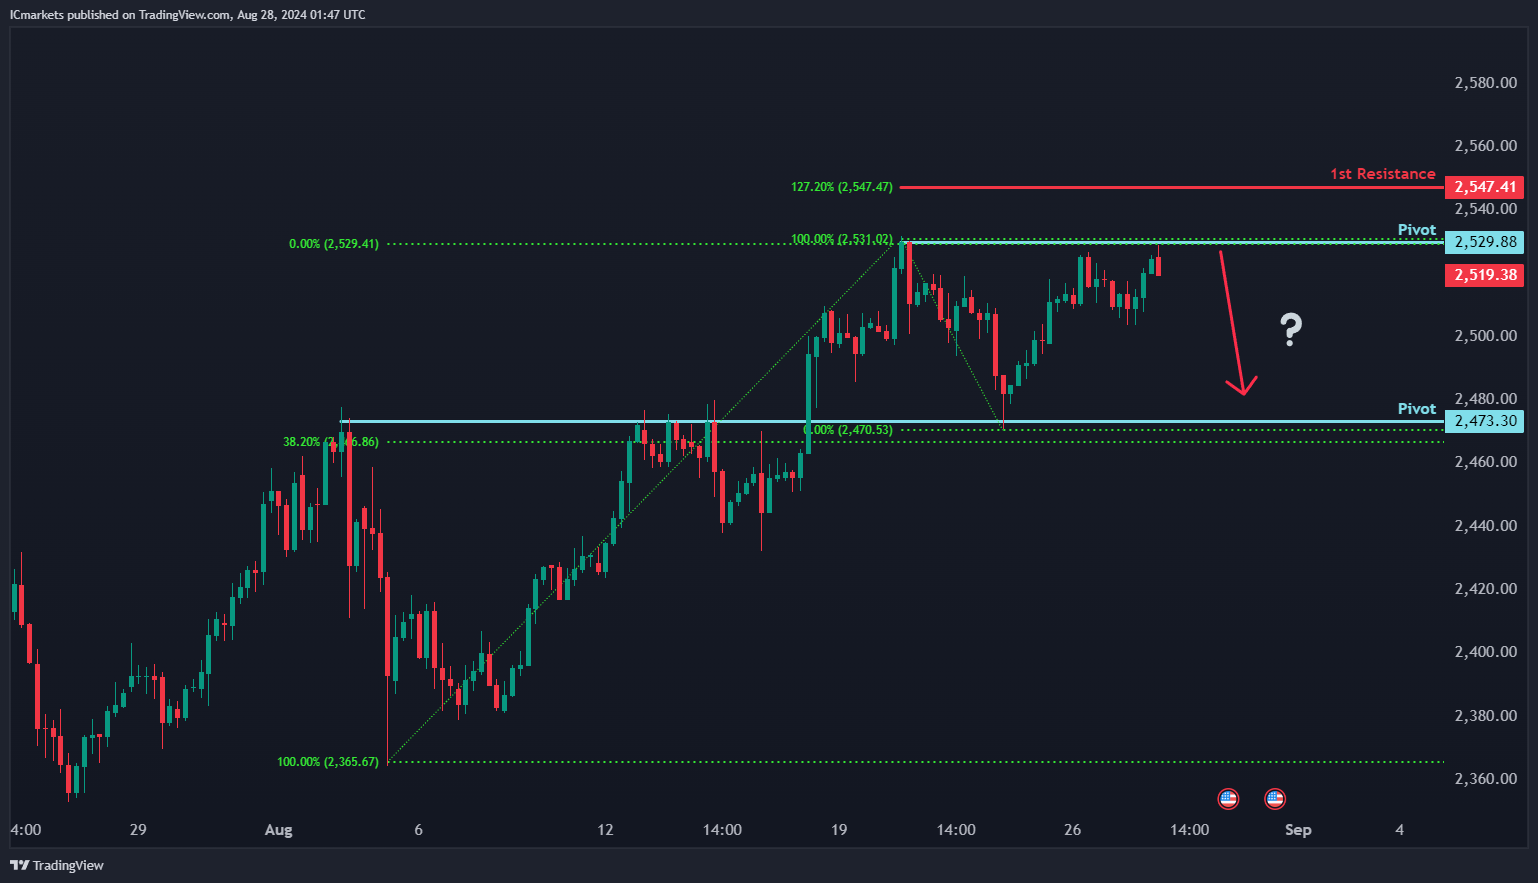
XAU/USD (GOLD):
Potential Direction: Bearish
Overall momentum of the chart: Bearish
Price could potentially make a bearish reaction off pivot and drop to 1st support.
Pivot: 2529.88
Supporting reasons: Identified as a multi-swing high resistance level, suggesting a strong area where the price might face selling pressure.
1st support: 2473.30
Supporting reasons: Pullback support, indicating a significant area where the price could find support during a decline.
1st resistance: 2547.88
Supporting reasons: Marked by a 127.20% Fibonacci Extension, indicating a potential area where the price might encounter resistance.
The accuracy, completeness and timeliness of the information contained on this site cannot be guaranteed. IC Trading does not warranty, guarantee or make any representations, or assume any liability regarding financial results based on the use of the information in the site.
News, views, opinions, recommendations and other information obtained from sources outside of www.ictrading.com, used in this site are believed to be reliable, but we cannot guarantee their accuracy or completeness. All such information is subject to change at any time without notice. IC Trading assumes no responsibility for the content of any linked site.
The fact that such links may exist does not indicate approval or endorsement of any material contained on any linked site. IC Trading is not liable for any harm caused by the transmission, through accessing the services or information on this site, of a computer virus, or other computer code or programming device that might be used to access, delete, damage, disable, disrupt or otherwise impede in any manner, the operation of the site or of any user’s software, hardware, data or property.